Categories
Forex Fibonacci

Fibonacci Levels: How Much Does 50% Level Influence the Market?

In today’s lesson, we are going to demonstrate an example of a chart, in which the price makes a reversal from 50% Fibonacci level. We know if the price makes a reversal from 61.8%, it usually goes up to 161.8%; if it makes a reversal from 38.2%, it goes up to 138.2%. In both cases, traders get good risk-reward. Do you ever wonder what happens if the price makes a reversal from 50%? Let us find this out through an example.

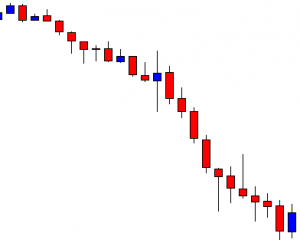
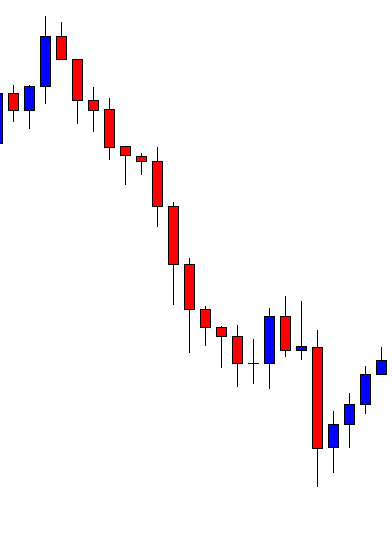
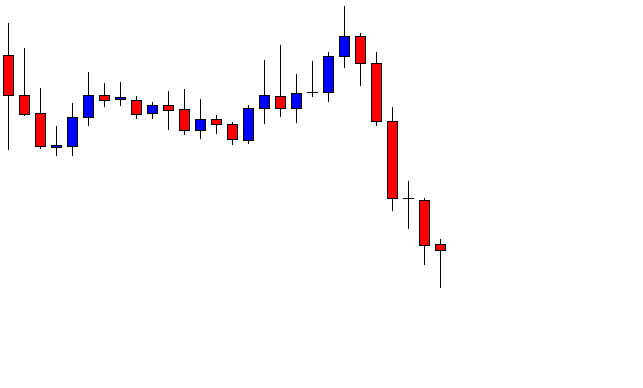
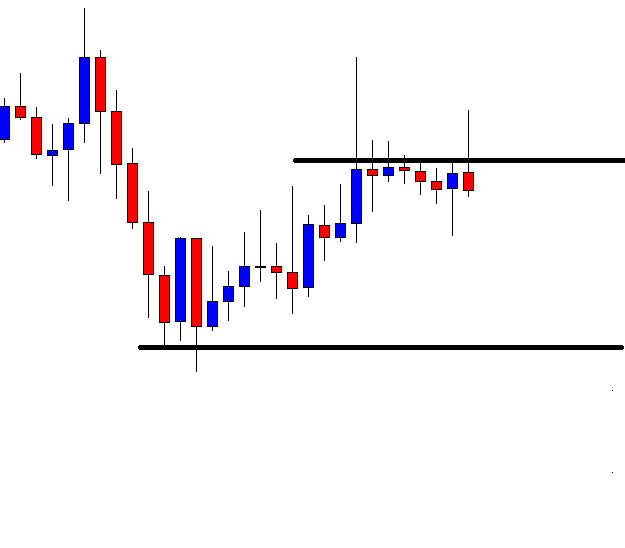
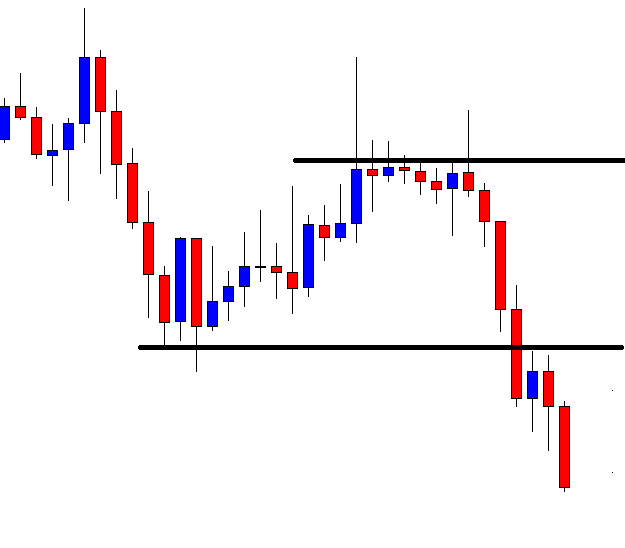
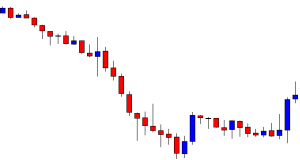
The chart shows that the price heads towards the South with good bearish momentum. It produces two bullish candles and heads towards the South. Look at the last candle. It comes out as a bullish inside bar. It makes a bullish correction. However, the sellers may wait for a bearish engulfing candle to go short in the pair.

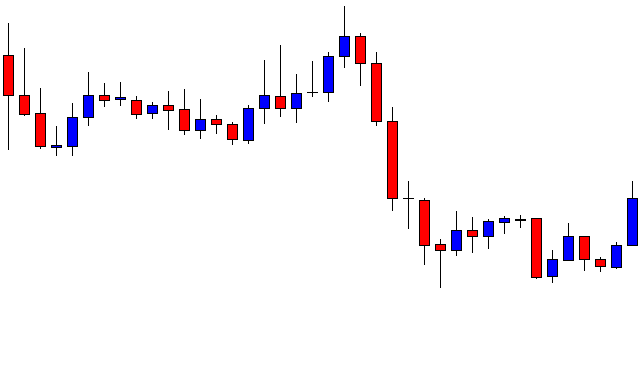
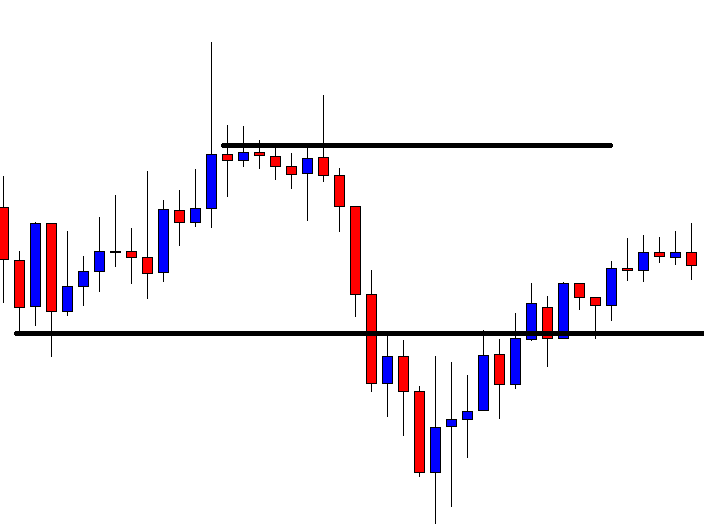
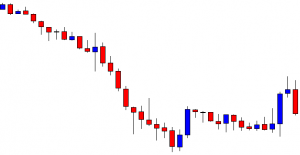
The price has been in a bullish correction. It produces some bearish reversal candles, but it does not create any bearish momentum. The last candle comes out with a little bullish body having a long upper shadow. Let us proceed to the next chart to find out what happens next.

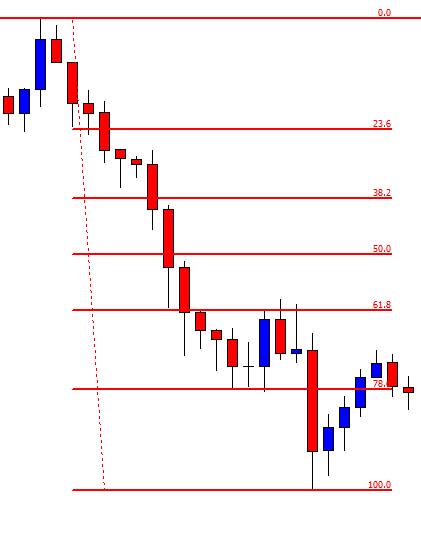
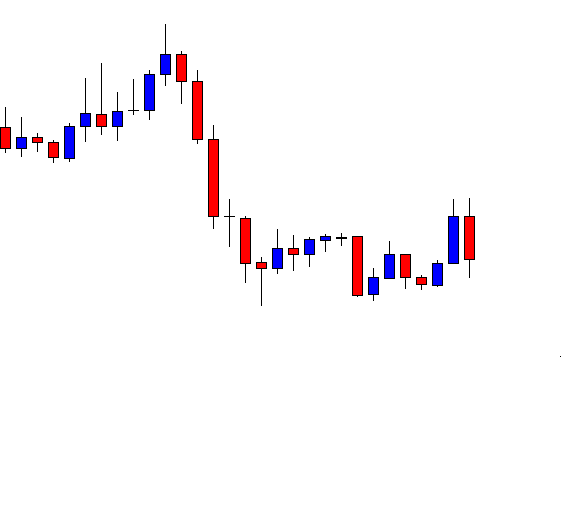
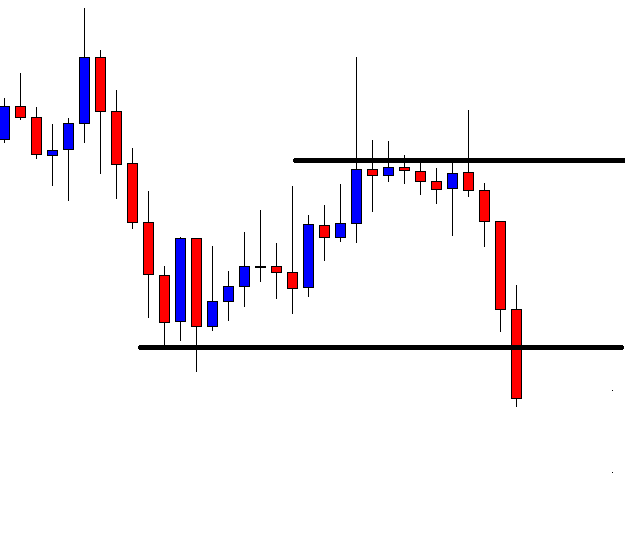
The last candle comes out as a bearish engulfing candle. It is a strong sign that the price may head towards the South again. The sellers may flip over to the minor chart to trigger entry.

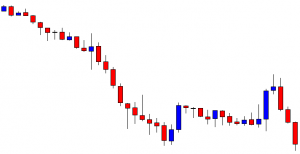
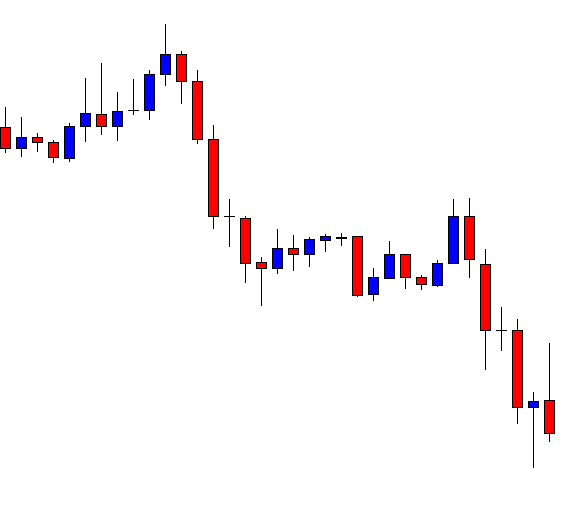
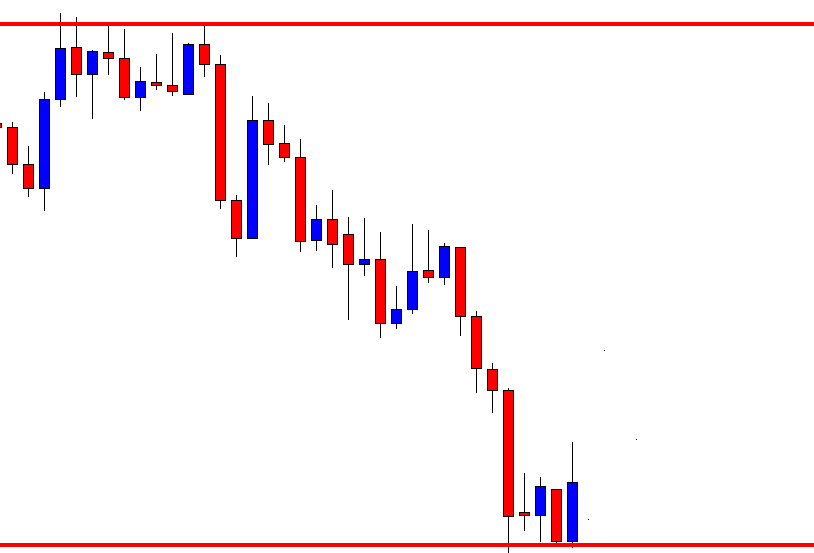
The price heads towards the South with extreme bearish pressure. The last candle comes out as a bearish Marubozu candle. It seems that the price may continue its bearish journey towards the South further. Let us find out what actually happens.

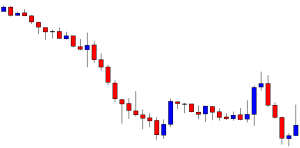
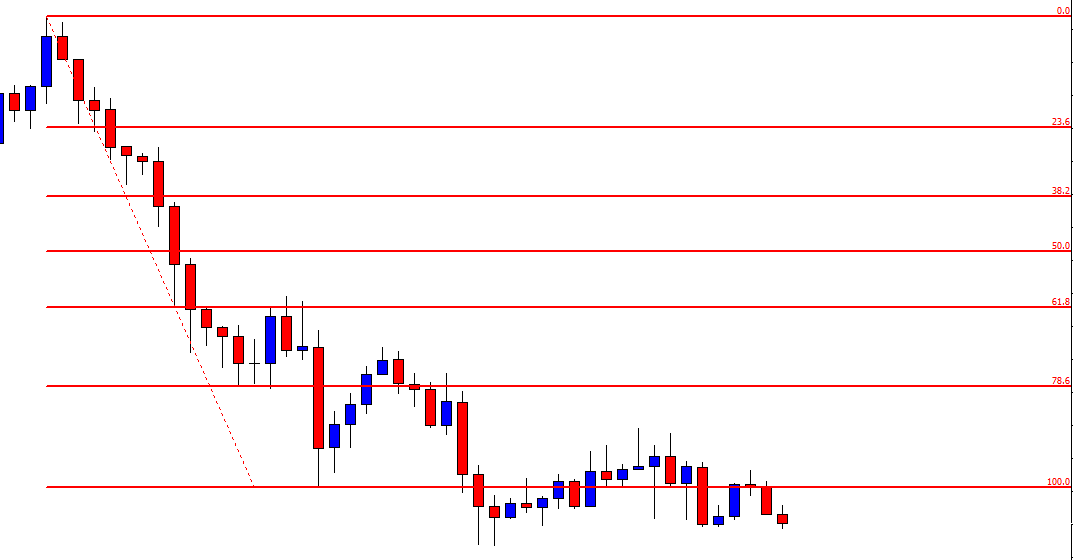
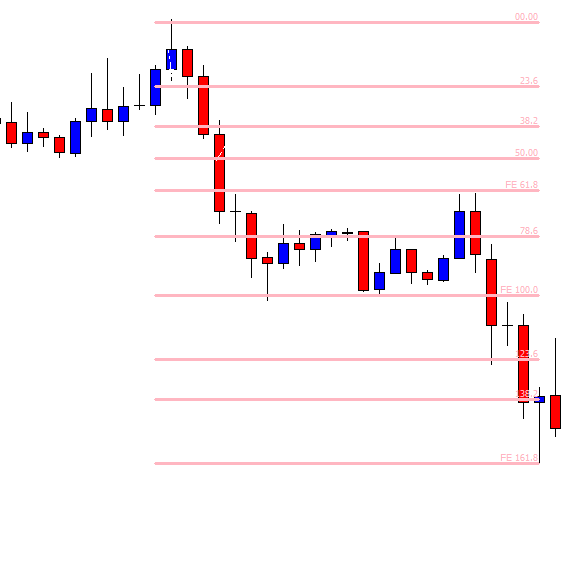
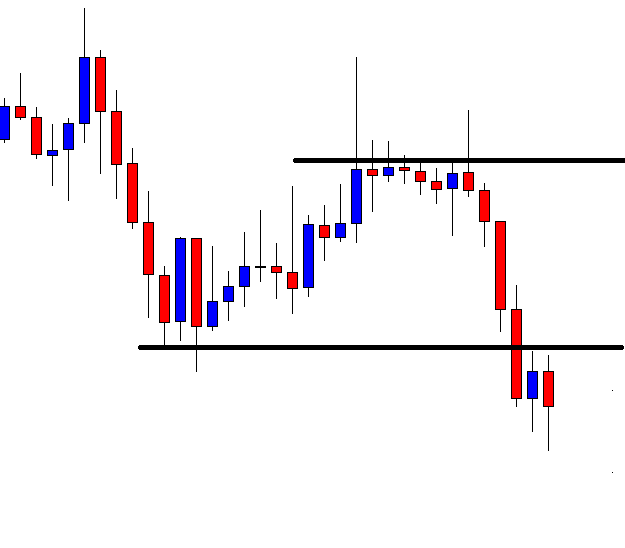
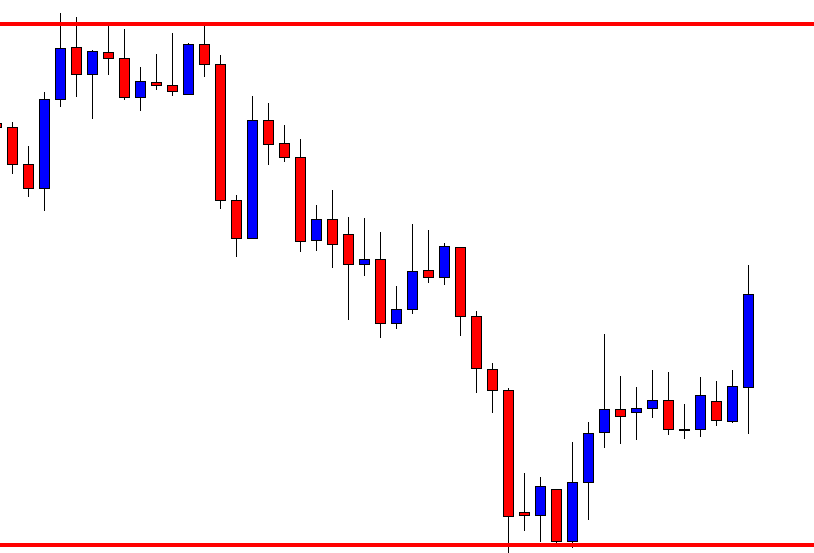
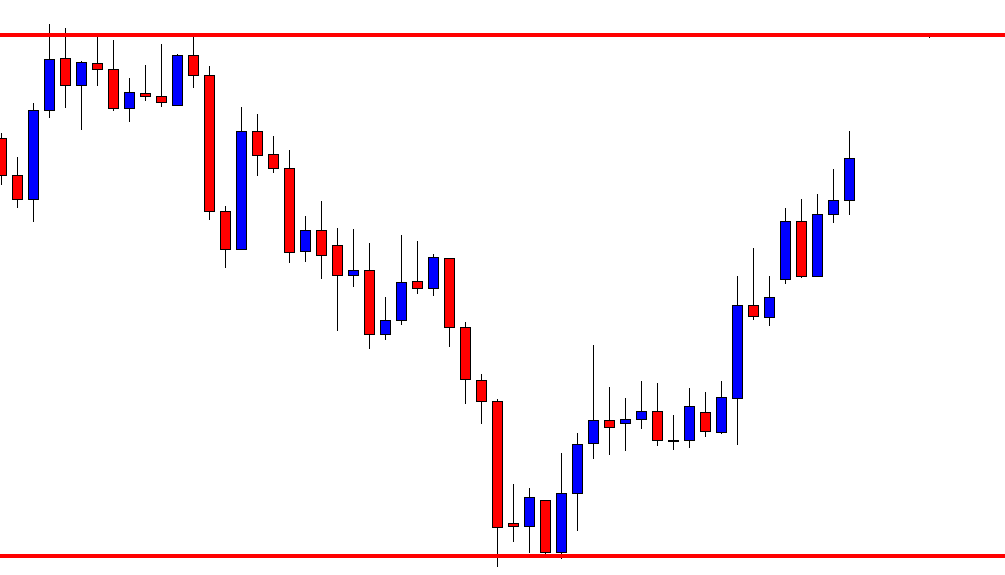
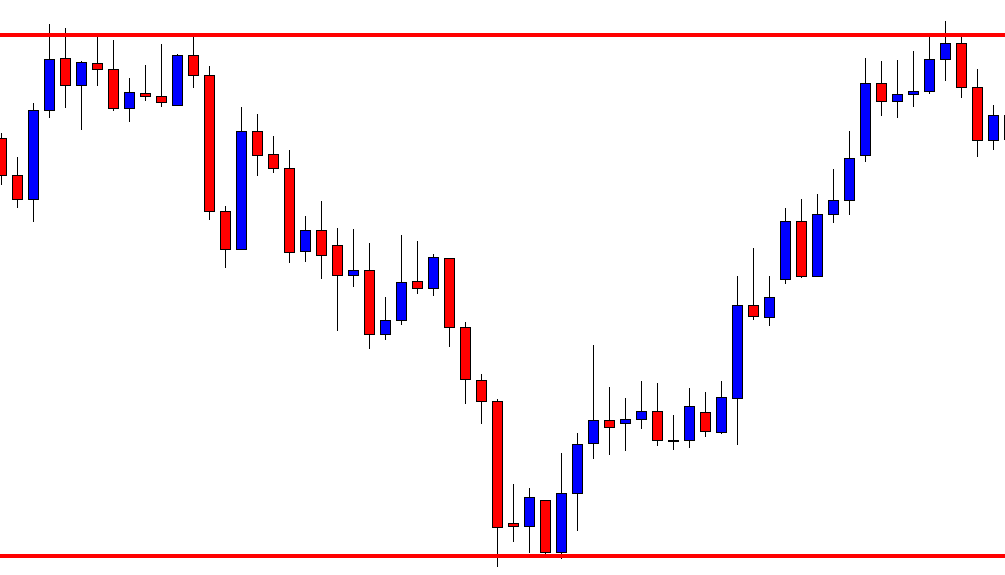
It does not continue its bearish journey. It finds its support. Upon producing a hammer, it heads towards the North with one more bullish candle. It seems that it may continue its bearish journey considering bearish engulfing candle as a reversal candle. Next, two candles come out as strong bearish candles too. What may be the reason that the price makes a bullish reversal here? Let us find this out with Fibonacci levels.

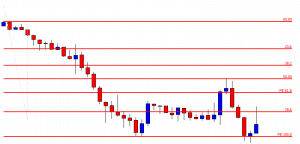
If we calculate, we find that the price makes a bearish reversal from Fibonacci 50% level. It then heads towards the South with extreme bearish momentum. However, it finds its support at the Fibonacci 100.00 level. Usually, this is what happens when the price trends from the 50% level. A question may be raised here whether we should take entry if the price trends from the 50% Fibo level. It depends on risk-reward. If it offers a good reward, then we may take an entry. In most cases, it does not offer a good reward; thus, we may skip taking those entries.


Categories
Forex Fibonacci

Fibonacci Trading: When Momentum is Lacking

Traders wait for the price to trend from 61.8% Fibonacci level. This is what attracts more traders to trade, which generates good momentum. When the price trends from 61.8% level, it usually goes up to 161.8%. Since the price gets enough space to move, it offers better risk-reward. This is another reason that Fibonacci traders love to trade in a chart when the price trends from 61.8%. However, the Forex market is uncertain. We may see that the price does not head towards 161.8% with good momentum upon trending from 61.8% from time to time. In today’s lesson, we are going to demonstrate an example of this.

This is an H1 chart. The chart shows that the price heads towards the South with good bearish momentum. Upon producing a strong bearish candle, it starts having a bullish correction. Fibonacci traders shall get themselves ready by drawing Fibo levels on the chart to find out potential short opportunities in the pair.

Here it is. The chart shows that the price breaches 78.6% level and trades above the level for two more candles. This means the price is in 61.8% zone. If the price trends from here, it may go towards 161.8% level. Yes, it would be better if the price goes towards the North and trends right from the level 61.8%. Nevertheless, the sellers still are to count the move from 61.8% zone. The chart produces a bearish engulfing candle followed by a doji candle. Since the reversal candle comes out as a bearish engulfing candle forming from 61.8% zone, some sellers may trigger a short entry (some may wait for the price to breach the last lowest low). Let us proceed to the next chart to find out what the price does.

The price heads towards the South and it makes a breakout at the last swing low as well. The pair may get more short orders now. However, the price does not head towards the South. It seems that 161.8% level is far away for the price to reach. It does not usually happen but this is how the Forex market runs. It does not always run on a single equation. A question may be raised here what does a trader do with his entry? Since it is an H1 chart based entry, it must be left behind and let it decide its fate by setting Stop Loss and Take Profit accordingly.

Categories
Forex Fibonacci

Fibonacci Trading and Deeper Correction

In today’s lesson, we are going to demonstrate an example where the chart produces a reversal candle at a Fibonacci level, but the price does not head towards the trend’s direction. It then makes a deeper correction. It finds its new resistance and heads towards the trend’s direction with good momentum. Let us now have a look.

The price heads towards the South with excellent bearish momentum. It produces six consecutive bearish candles, four of them having solid long bearish bodies. The sellers are to wait for the price to make a bullish correction and to produce a bearish reversal candle at the value area. Let us proceed to the next chart.


The price makes a bullish correction and produces a bearish engulfing candle. However, the price does not make a bearish breakout. It rather goes towards the North again. The last two candles come out as bullish candles. The price goes towards the North further for a deeper correction.

The chart produces a bearish Marubozu candle. The combination of the last two candles is called Track Rail. The Track Rail is one of the strongest reversal signal candles. The sellers may keep their eyes on this chart with attention. The Fibonacci traders may draw their Fibonacci levels to find out which level it is trending from.

Let us proceed to the next chart to find out what the price does.

The chart produces another bearish candle and makes a breakout at the wave’s lowest low. The Sellers then take control of the pair and drive the price towards the South at an extreme pace. The last candle on this chart comes out as an inverted hammer. It suggests that the price may keep heading towards the South. However, do not forget that the chart produces a bullish Pin Bar as well, and the last candle closes within the level of support where the Pin Bar bounces off.

Anyway, let’s draw the Fibonacci level on the chart and see how the price reacts to some levels.

The chart gives us a clearer picture. At first, the price produces the bearish reversal candle at 78.6. The asset does not make a breakout. Instead, it goes towards the North and finds its resistance at 61.8. The level produces a bearish reversal candle followed by a breakout at the wave’s lowest low. The price then hits 161.8 level with ease.

If the price makes a breakout by trending from 78.6, it may not hit 161.8 level. The price usually reverses at 138.2 if it trends from 78.6. Stay tuned. We are going to study with some live examples on this soon.


Categories
Forex Price-Action Strategies

Breakout Confirmation Candle and the Difference It Makes

Breakout trading strategy traders first wait for the breakout with good momentum. Then, they are to wait for the breakout confirmation candle. A breakout can be confirmed in two ways. It can take the price towards the trend, or it could come out as in inside bar reversal candle. As long as the candle closes below the breakout level, it confirms the breakout. However, these two types of breakout confirmation push the price towards the trend a bit differently. In today’s article, we are going to demonstrate an example of this.

The price after being bearish makes a bullish correction. The last candle comes out as a bearish pin bar. This is a strong bearish reversal signal. The sellers are to wait for the price to head towards the level of support, where the price has a bounce earlier.

The price heads down with good bearish momentum. It seems that it is going to make a breakout at the drawn level. The breakout sellers are to keep their eyes on the pair closely to take a short entry upon a bearish breakout and breakout confirmation.

Here it comes. The last candle breaches the level of support closing well below it. This is an explicit breakout, which the sellers wait for. If the next candle confirms the breakout, the sellers may drive the price towards the South further.

The next candle comes out as a bullish inside bar. However, it closes within the breakout level. It means the breakout is valid. It is not an A+ breakout confirmation. It offers less reward and does not drive the price towards the trend with good momentum. If the candle came out as a bearish candle closing below the breakout candle, it would be a different ball game. The price may make a move towards the downside by offering 1R at least. Let us see what happens here.

The next candle comes out as a bearish candle. Some sellers may trigger a short entry. In most cases, it does not travel as far as it has traveled to offer the entry.

It produces a strong bearish candle. It seems that the sellers are in control. The question is whether it travels the same distance of Stop Loss-Entry or not. Let us find out from the next chart.

The price starts making an upward correction. It goes back within the breakout level. This chart does not look good for the sellers any more unless it makes a bearish breakout at the last lowest low.

We have seen that the breakout candle and breakout momentum are good. However, the price does not head towards the trend and travel the distance as it usually does. This is what happens if the breakout confirmation candle comes out as an inside bar reversal candle. Thus, it is best if we skip taking such entry.

Categories
Forex Basic Strategies Forex Daily Topic Forex Price Action

Support, Resistance and Trade Management

-Support and Resistance are the two most important concepts in the financial market. Forex traders strongly rely on support and resistance, as well. Price action traders’ main weapon is support and resistance. In today’s article, we are going to demonstrate an example of how the price reacts to a major level of support and resistance. Let us get started.

Look at the chart. The price consolidates around the red-marked level, it finds its resistance there and makes a bearish move. After having a correction, it makes the new lowest low. This is now the sellers’ territory. Let us assume that there is no significant level, which may hold the price as support. Thus, we are not able to mark any level as support. The sellers are to wait for the price to consolidate and produce a bearish reversal candle to offer them short entry in this chart.

The price makes new lowest lows and heads towards the South with good bearish momentum. However, it seems that it may have found its support. It consolidates for a while around the red-marked level and produces a bullish engulfing candle. The buyers on the minor chart may get them engaged to keep an eye on the chart to go long above the highest high of the last candle. Let us find out what happens next.

The price heads towards the North. It consolidates and produces another bullish engulfing candle. It means the chart is now the buyers’ territory. This is where the game of support and resistance begins. You may have noticed that we have red-marked the level. This is the most significant level in this chart for the buyers. The price may consolidate and find its resistance in this chart before it reaches the red-marked level. However, this is where traders may make a decision concerning their long position. They may either close their whole trade or take partial profit.

The price keeps heading towards the North. It buyers are having a party here. They must not forget the red-marked level, though. Let us proceed to the next chart.

Look at the chart carefully. Do you notice that the price consolidates around the red-marked level, which is the swing high in this chart? It produces a bearish engulfing candle followed by another bearish one. The last candle on this chart comes out as a bullish inside bar. If the next candle comes out as a bearish engulfing candle, the sellers may drive the price towards the South. I am sure now you know where the sellers are to be careful with their trade management. Yes, they must take the red-marked support (swing low in this chart) into account to manage their short entries.