-Support and Resistance are the two most important concepts in the financial market. Forex traders strongly rely on support and resistance, as well. Price action traders’ main weapon is support and resistance. In today’s article, we are going to demonstrate an example of how the price reacts to a major level of support and resistance. Let us get started.


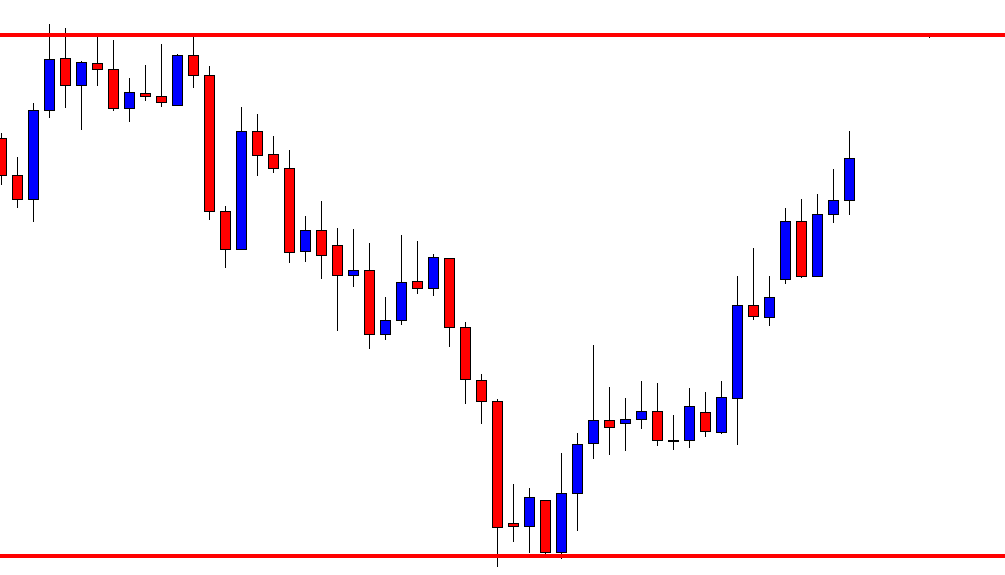
Look at the chart. The price consolidates around the red-marked level, it finds its resistance there and makes a bearish move. After having a correction, it makes the new lowest low. This is now the sellers’ territory. Let us assume that there is no significant level, which may hold the price as support. Thus, we are not able to mark any level as support. The sellers are to wait for the price to consolidate and produce a bearish reversal candle to offer them short entry in this chart.
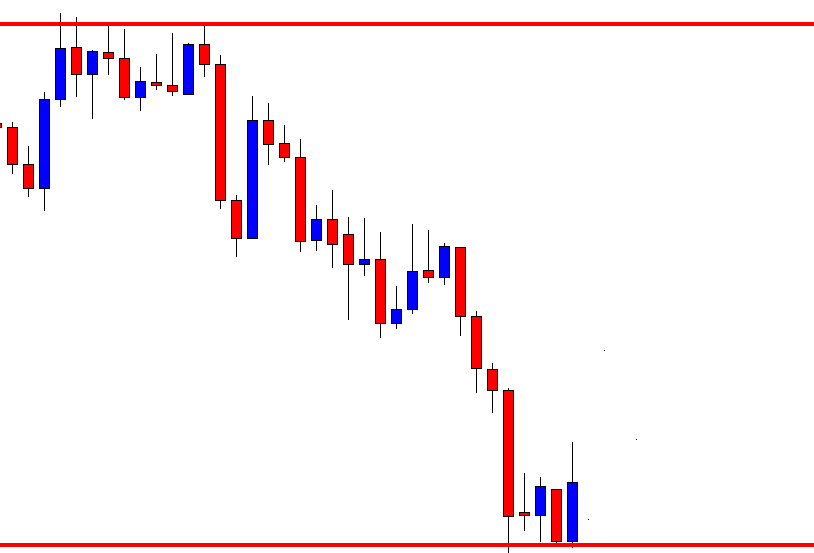
The price makes new lowest lows and heads towards the South with good bearish momentum. However, it seems that it may have found its support. It consolidates for a while around the red-marked level and produces a bullish engulfing candle. The buyers on the minor chart may get them engaged to keep an eye on the chart to go long above the highest high of the last candle. Let us find out what happens next.
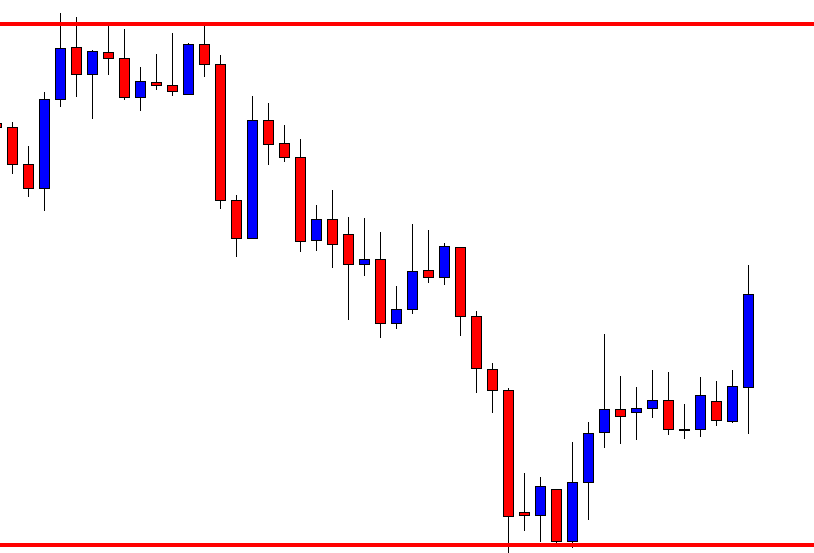
The price heads towards the North. It consolidates and produces another bullish engulfing candle. It means the chart is now the buyers’ territory. This is where the game of support and resistance begins. You may have noticed that we have red-marked the level. This is the most significant level in this chart for the buyers. The price may consolidate and find its resistance in this chart before it reaches the red-marked level. However, this is where traders may make a decision concerning their long position. They may either close their whole trade or take partial profit.
The price keeps heading towards the North. It buyers are having a party here. They must not forget the red-marked level, though. Let us proceed to the next chart.
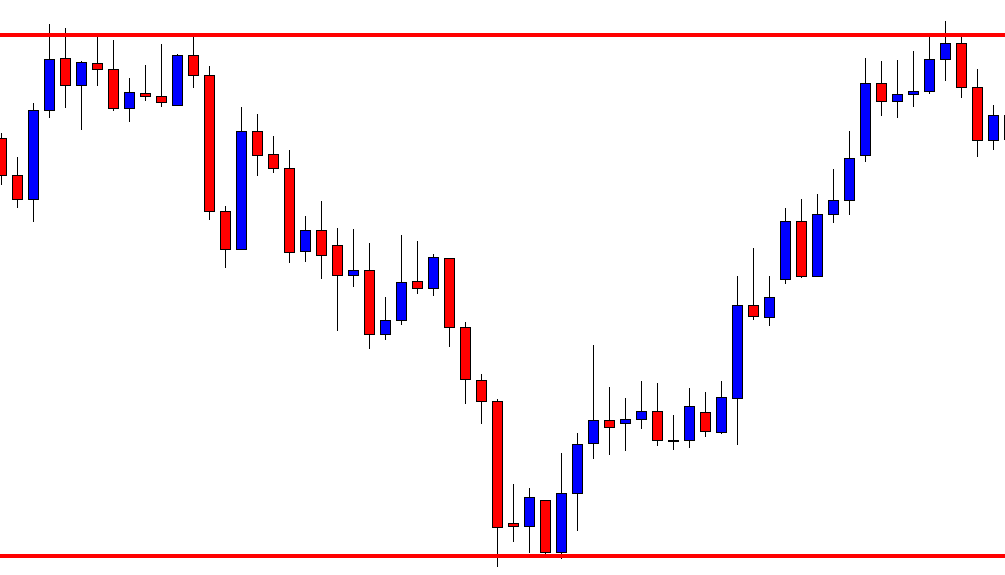
Look at the chart carefully. Do you notice that the price consolidates around the red-marked level, which is the swing high in this chart? It produces a bearish engulfing candle followed by another bearish one. The last candle on this chart comes out as a bullish inside bar. If the next candle comes out as a bearish engulfing candle, the sellers may drive the price towards the South. I am sure now you know where the sellers are to be careful with their trade management. Yes, they must take the red-marked support (swing low in this chart) into account to manage their short entries.