Categories
Forex Basic Strategies

Profit Today from These Tried & Tested Breakout Strategies

Let’s talk about currency breakout strategies. Have you ever heard that most breakouts are fake or that you should avoid operating breakouts? In the results of the World Cup Futures Championship 2017, first place went to Stefano Serafini, with an impressive return of 217%. What was Stefano Serafini’s main strategy to achieve such an impressive performance? Intraday breaks. So it would be very positive for you to do the following, the next time you see a so-called guru saying “most breakups are fake” or “avoid breakups”. Share this article with them.

In this article, we will teach you two currency breakout strategies to help you increase your accuracy and profitability when operating them. Of course, we will additionally teach you how you can use this to avoid any fake breakout.

While there are many types of currency breakout strategies, they can be classified into two broad categories:

1 – Setup “Momentum breakout”

2 – Setup “Breakout pullback”

In the article we present today we will focus on the second breakout strategy (the “Breakout pullback”), as it is much easier for operators to learn and execute it because it requires less skill.

Setup “Breakout Pullback”

Before you can even operate the pullback setup, you will need to identify some of the pullback patterns by analyzing the price action. Once you learn this, you’ll be able to identify “A+” setups. That is, the best patterns. These will increase your accuracy and profitability by operating them. There are many activities that you can develop to identify “A+ ” pullback setups, but there are two things I will give you so that you can go working.

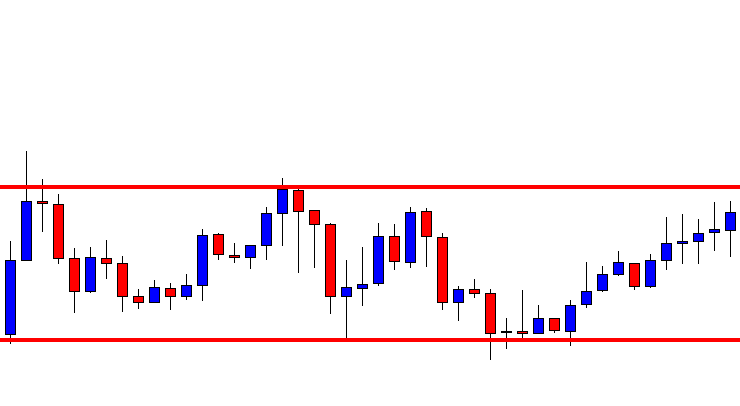
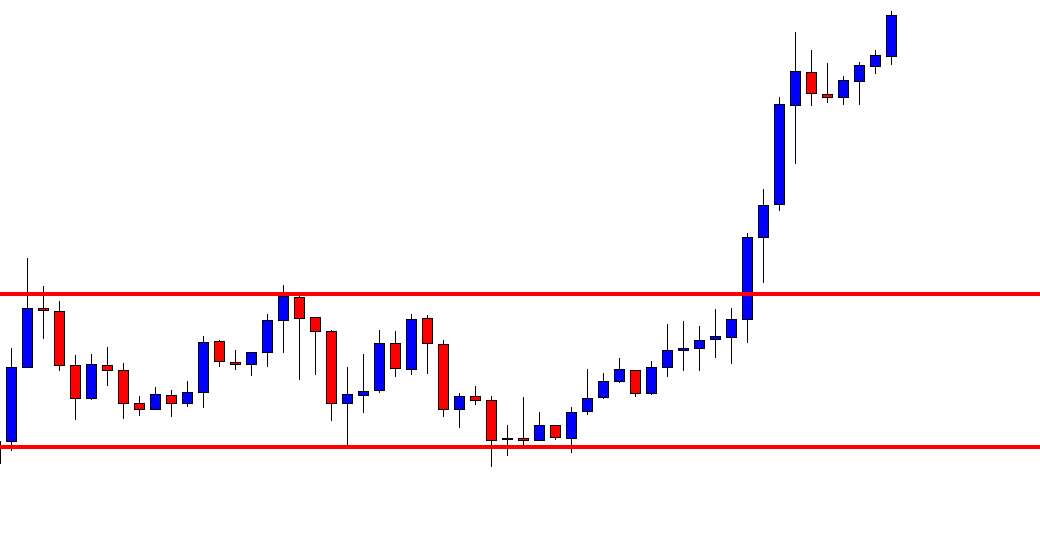
Breakout Pattern: Finding a Key Level of Support or Resistance

Why two touches, huh? While the market can reach a key level of support or resistance with just a touch in that area, what usually indicates a potential flow of institutional commands and players who want to maintain that level, are two touches. These indicate a higher probability and number of orders in that area. The more buyers or sellers have that level, the greater the likelihood that the transaction will succeed.

Why? One reason is that those same players, when they skip stop loss orders after the level of support or resistance is broken, are removed part of the flow of orders against that break. This makes it easier for the rupture to continue.

In addition to this, big players, with smart money, after being eliminated (and detecting a good breakout) will often switch sides after their stop orders are skipped, which will provide a greater boost to the breakout. Therefore, it is important to identify a level that has a minimum of two touches (the more, the better) to increase the likelihood that a breakout setup will form.

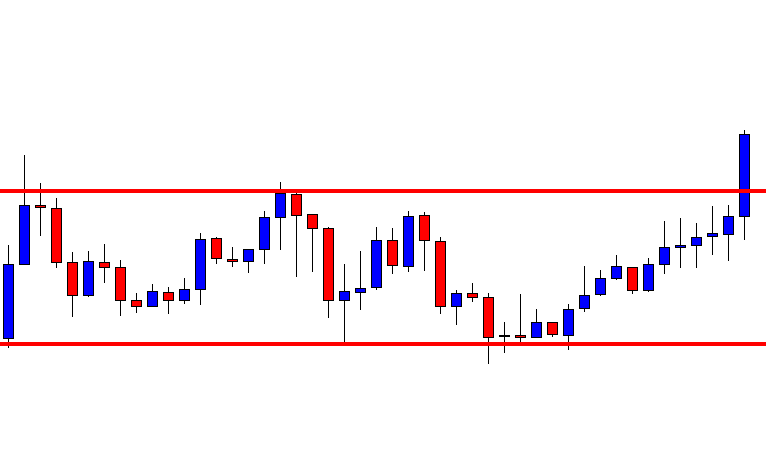
Breakout Pattern: Minor Reactions or Setbacks

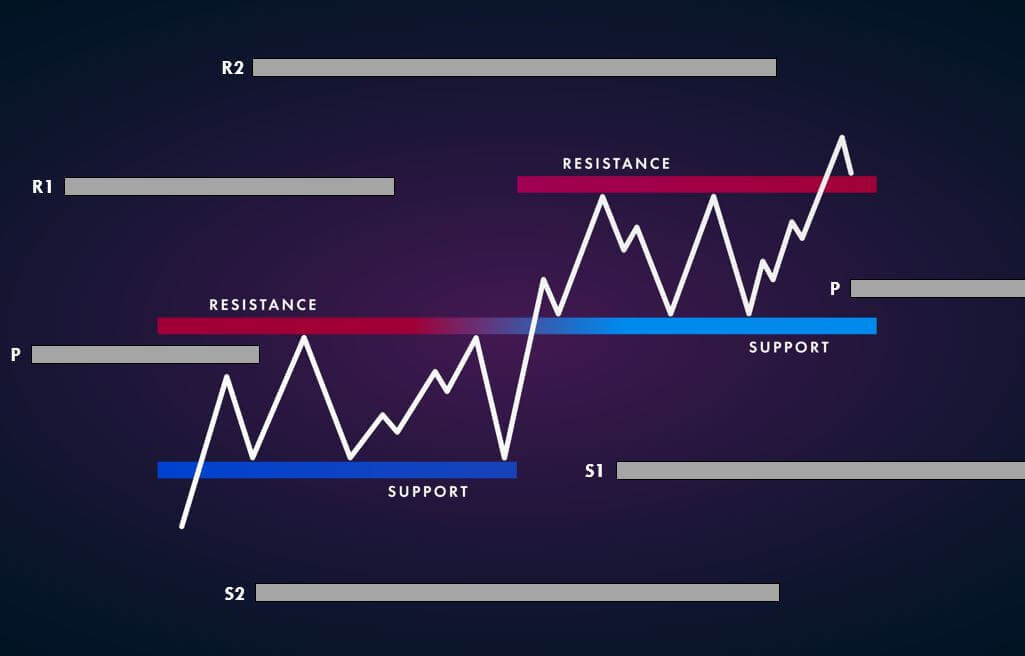
Why does analyzing a recoil or reaction before a key level of support or resistance help break operations? Let’s say the market is on an uptrend and is finding a level of resistance where there are likely to be bearish positions at that level. If the bullies reach the resistance level, for the first time, and the market regresses, say 50 pips, if the second time the price reaches that resistance level, the market only regresses 25 pips, this will indicate a weaker reaction from the bearings.

A weaker reversal of the bearings equals a lower flow of orders and strength in their favor. As his side continues to weaken, this will give the bassists the signal that they are more likely to see a breakup and communicate that his side is losing the battle. These weaker reactions warned that the bearings were less able to bring down the price while the bullies kept their foot on the accelerator, producing an eventual leak. Therefore, be sure to look for weaker reactions each time you are before a key support or resistance level to identify a high-probability break. Be sure to look for weaker reactions each time you are before a key level of support or resistance.

Key: An additional pattern, which you can apply in the price action, is to look for breakout setups that are forming in trend vs countertrend. After I’ve taught you two underlying components of a breakout strategy, we can talk about how we can achieve a pullback breakout.

The “Breakout Pullback”

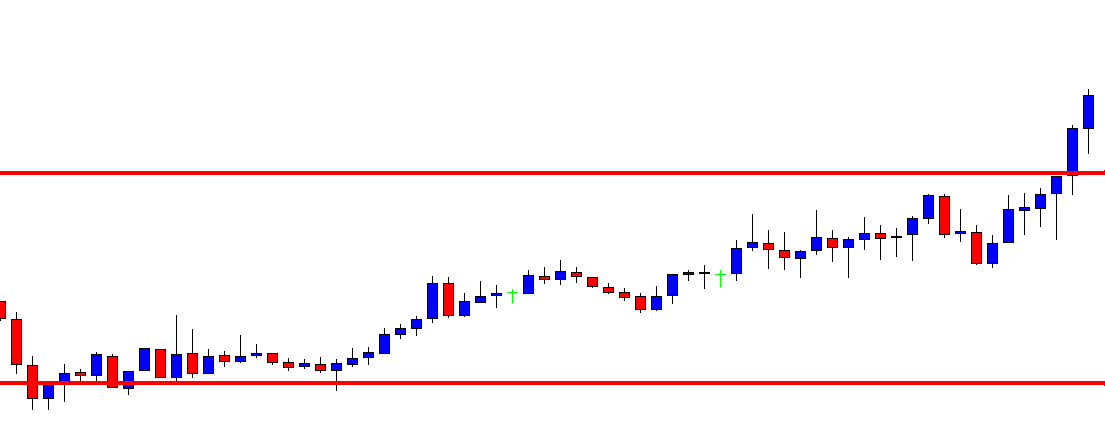
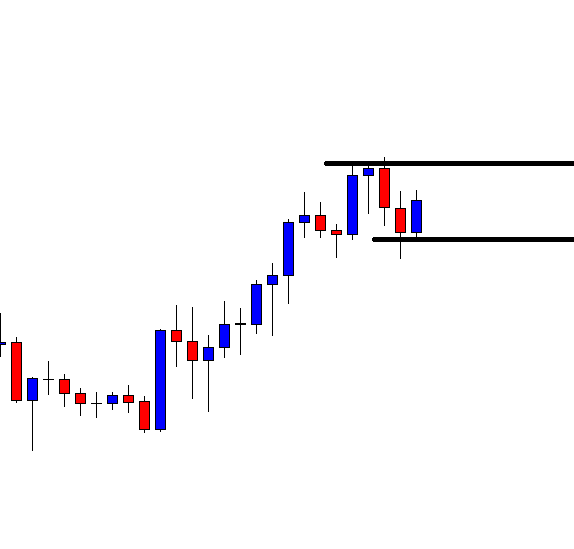
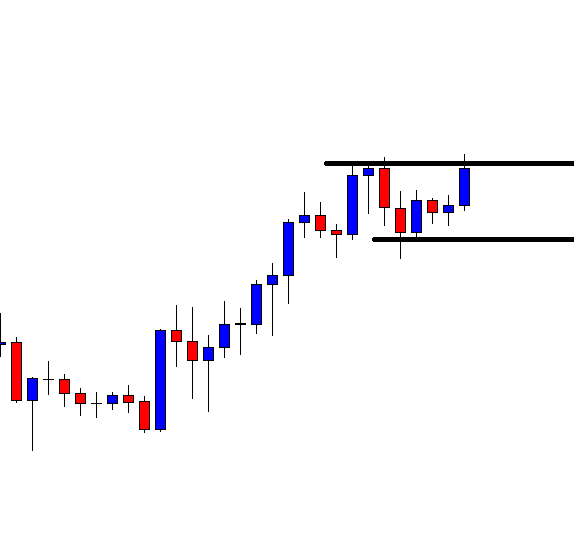
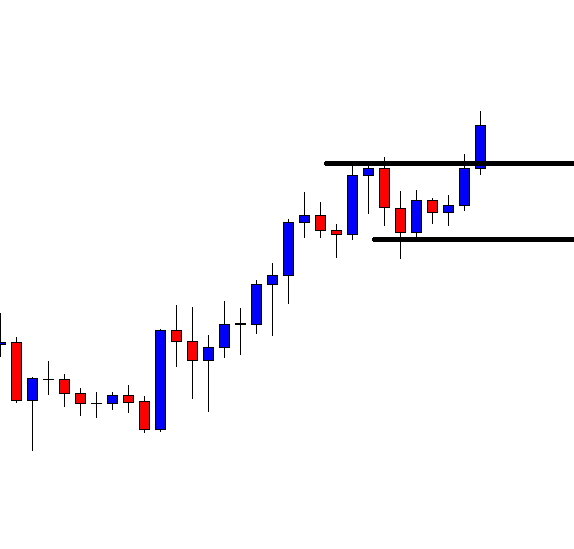
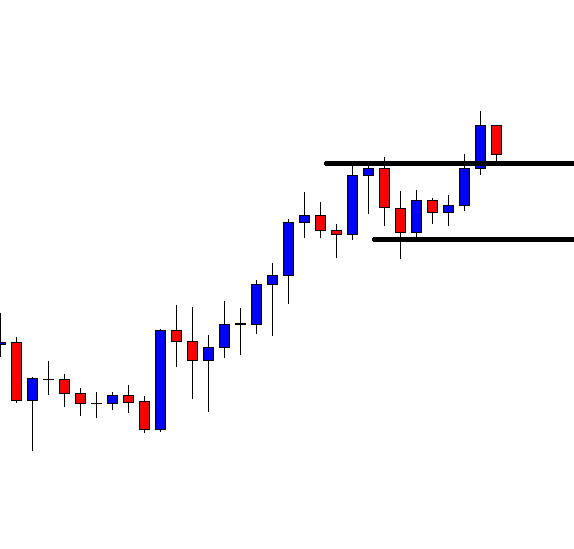
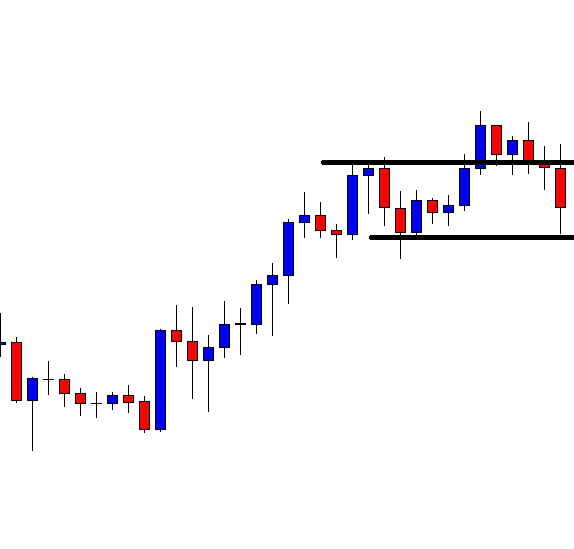
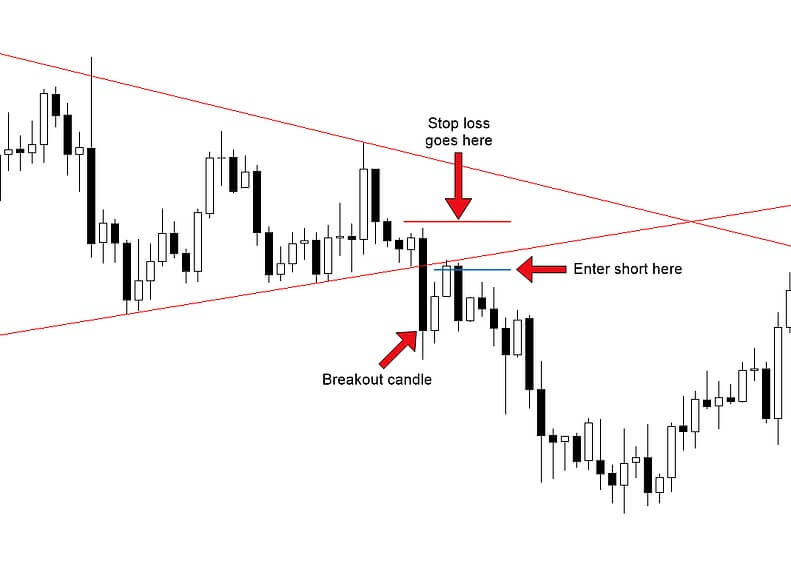
Assuming you have found a situation where both touches are given at the same key support or resistance level, along with weaker reactions before you get there, let’s talk about how you can enter a breakout pullback setup. Once the price has broken the support or resistance level, I will place a limit order on that specific support or resistance level to operate in the direction of the break.

NOTE: I don’t expect a price action confirmation sign to form at that level. If you have read the price action context correctly and found an interesting break, any signal confirming the price action will only give you a weaker ticket, and then your profitability will be reduced. If you could learn to read the price action, you won’t need any price action confirmation signal to enter the market, because the flow of orders from the big players will already be there.

When I operate a breakout pullback setup, once I identify the breakout, I open my operation, long or short, at the level where the pullback is performed. If the command flow at that level is interesting, there will be larger players willing to be long or short at that level without the need for any price action confirmation. When I operate a breakout pullback setup, once I identify the breakout, I open my operation, long or short, at the level where the pullback is performed.

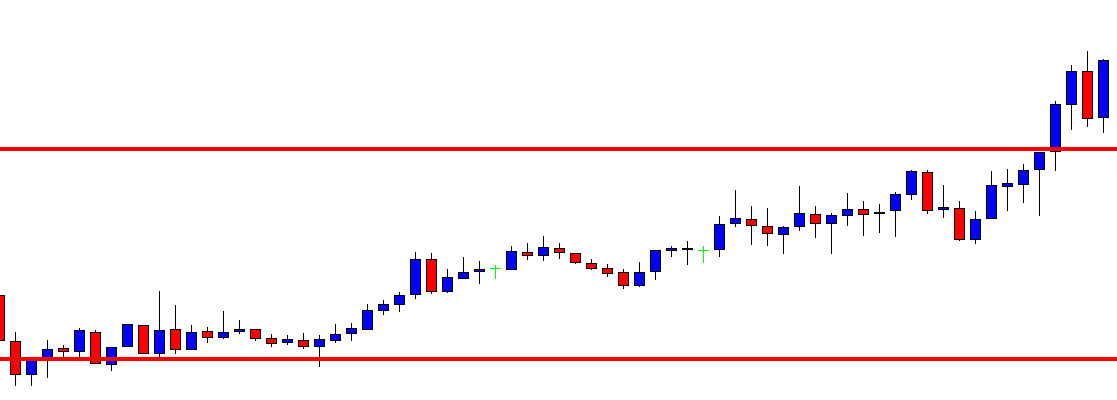
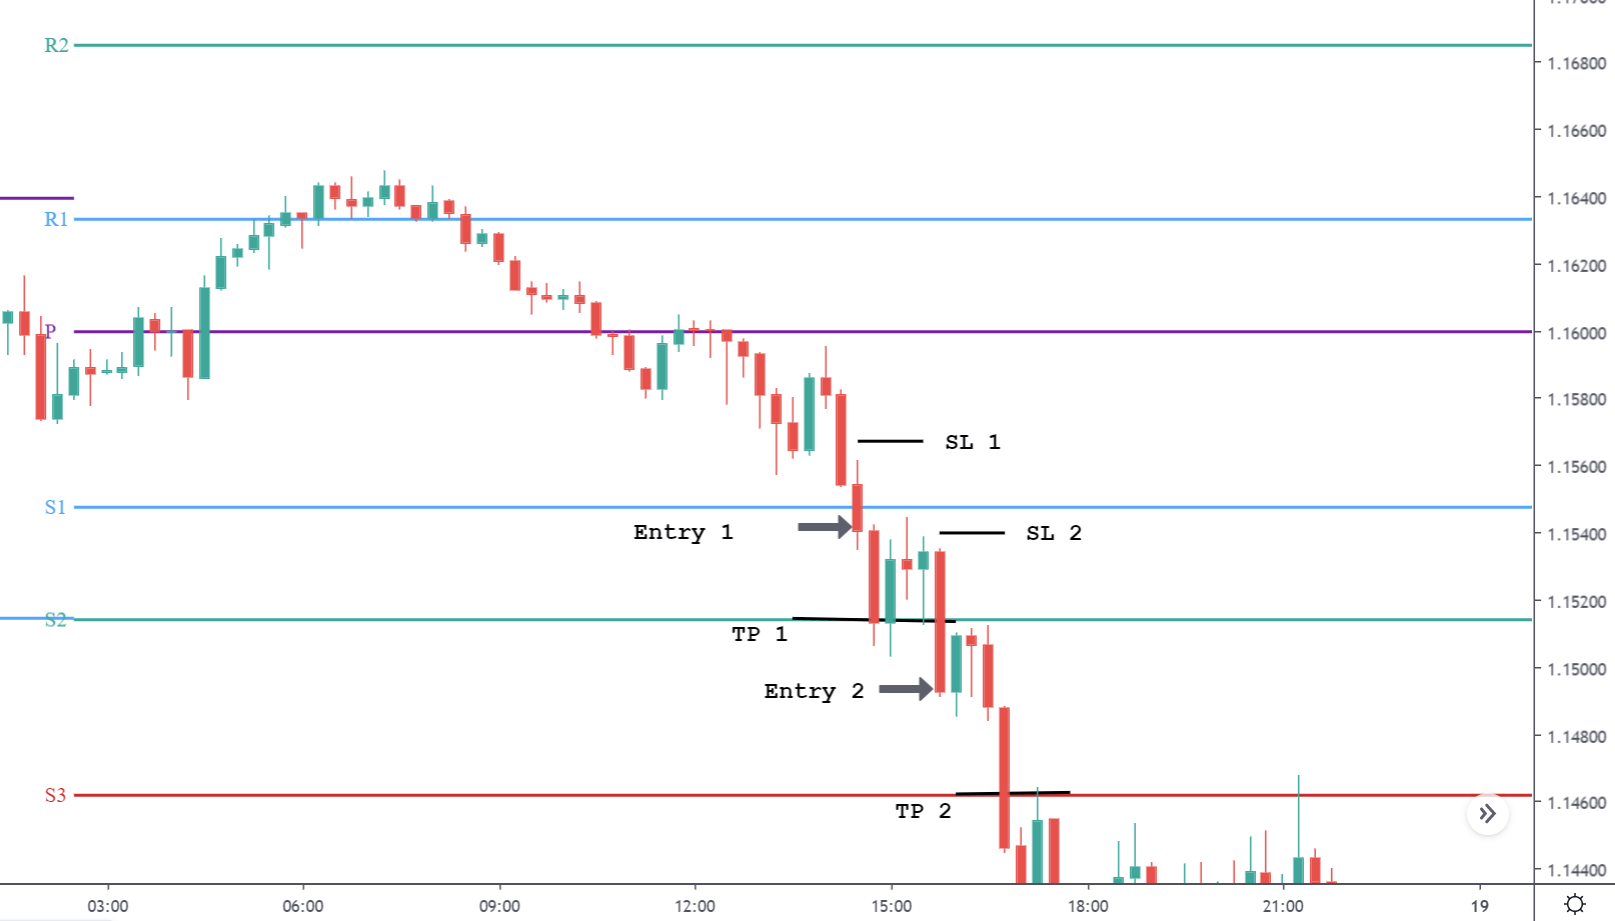
When there are two taps on a support level, together you bounce weaker and weaker. Once the market broke the level, I put my order for short. After returning to my level, and narrowly entering the negative ground, the pair fell generating more than 100 pips of profit. If I had waited for any sign of confirmation, like a bar pin or something like that, I would have gotten a worse ticket and a lower profit potential.

You can see another example of a live trade using a pyramid trading strategy where I go into a pullback breakout in both trades, trading with the tendency to make additional profits.

Avoiding False Breakout

You can tell a lot about how to avoid false breakout when operating a pullback breakout setup. There are many breakup patterns that often fail.

To simplify, the best thing you can do is:

  1. Learn to read the price action context
  2. Operate with the trend as much as possible.

By learning to read the context of price action, you will have a better understanding of finding key levels of support and endurance where there is a large flow of orders around that level. You will also have the ability to know how to detect much better trend contexts, which are much more favorable for breakout trading setups. This is because there will be more flow of orders in your favor to support your operation.

In Sumary…

Trading breakout patterns in currencies can be a highly profitable trading strategy when you learn to identify “A+” breakout setups. There are two types of breakout, which are a) the breakout itself, and b) the breakout pullback.

There are also breakout patterns that you can detect in price action and help you find breakout operations of higher probability. Trading breakout patterns in currencies can be a highly profitable trading strategy when you learn to identify breakout setups.

At first, try operating pullback breakout setups as they require fewer skills and will help you have confidence in breakouts over time. Finally, when trading the pullback breakout make sure you don’t expect confirmation signals of the price action as they will give you a worse entry and reduce your profitability.

Categories
Forex Daily Topic Forex Price Action

The H1-15M Combination Trading Has a Lot to Offer

In today’s article, we are going to demonstrate a combination strategy. The combination is made of the H1 and the 15M chart. Since these two are busy intraday charts, thus a trader can find a good number of entries with this strategy. Let us now proceed and find out how it works.

The above image displays the H1 chart. The chart shows that the price gets caught within two horizontal levels. At the last bounce, the chart produces a bullish engulfing candle and heads towards the North. The sellers may wait for the chart to produce a bearish reversal candle at the level of resistance. On the other hand, the buyers are to wait for a breakout at the level.

The bull wins. A good-looking bullish candle breaches through the level of resistance, closing well above the level of resistance. Some traders may trigger a long entry right after the last candle closes. Some may initiate their long entries by setting limit order above the level of resistance. Every strategy has some advantages as well as disadvantages. Anyway, we are going to flip over to the 15 M chart to trigger an entry.

This is how the 15M chart looks. The last candle closes as a bullish candle too. This suggests that the bull has taken control. The H1-15M combination traders are to wait for the price to consolidate and produce a 15 M bullish candle to offer them a long entry.

The chart produces a bearish engulfing candle followed by a bullish engulfing candle. The buyers (H1-15M combination traders) may trigger a long entry now. The stop loss is to be set below the level of new support (breakout level), and take profit may be set with 2R. Let us proceed to the next chart to find out what the price does after triggering the entry.

This is the H1 chart. The chart shows that the price heads towards the North with good bullish momentum. The buyers achieve their 1R with ease. The point we may notice that the price never even comes back to the breakout level again after triggering the entry.

By using the H1-15M strategy, traders can get an excellent risk-reward. It offers a high winning percentage as well. In most cases, the price heads towards the trend’s direction with good momentum. On the contrary, the 15M chart may not always consolidate and produce the signal candle. Thus, traders may not get as many entries as they would like. However, since it is the H1-15M combination, it still offers a good number of entries per week in major pairs.

Categories
Forex Course

96. Trading Breakouts using Pivot Points

-Introduction

We know that pivot points are no different from the typical support and resistance levels. We also saw how these levels were respected when trading a ranging market. But, could it used to trade breakouts? Let’s find out in this lesson.

Just like your normal Support and Resistance, the pivot levels don’t hold forever. At one point or the other, the price breaks out from these levels. In our range strategy, we always hit buy at the support and sell at the resistance. But there are times the market breaks from these levels and stops us out. When such things happen, we can develop another plan ready for the same and take advantage of it.

In the trading community, there are two types of traders: aggressive traders and conservative traders. And the approach to trade breakouts is different for both. So, we made two strategies to benefit the aggressive as well as the conservative traders.

The Pivot Points Breakout Strategy

Doing it the Aggressive way

The aggressive approach to trade breakouts is very simple. The strategy for such traders is to trigger the trade when the price breaks above resistance or below the support. The logic to this is that the resistance/support which was supposed to hold is now not being respected. It means that the opposite party is showing more strength. Hence, we will also be following the stronger side.

Aggressive traders are the ones to catch the initial move of the breakout. But there is high risk involved in these types of entries.

Trade Example

Below is the chart of GBP/CHF on the 15min timeframe. The pivot points are marked as shown. Initially, we can see that the price broke below S1 support. Here, aggressive traders can get in for a sell after the close of the candle. Later, the price continued to fall down and ended up breaking the S2 support as well. This could be another entry for the aggressive breakout traders.

Placements

As aggressive traders, it is important to have good risk management on the trades. The most basic necessity is the placement of stop-loss and take-profit orders. For the above trades, traders can keep the stop-loss just above the level they entered the trade. However, it would be better to place the stop-loss much higher than that level because we can stay safe from spikes. And a typical TP would be the next Support level. Refer to the above chart to get better clarity on it.

Doing it the Conservative way

The conservative approach is more of a safe approach to trade breakouts. According to this strategy, look to enter the trade when the price retests the level after breaking through that level. In trading terms, this is called the ‘role reversal’ concept. This concept simply means the turning of ‘support into resistance’ and ‘resistance into support.’ For example, when the price breaks below the support level, it is not a ‘support’ anymore; but is now ‘resistance.’ Now, let’s put this into action.

Consider the same chart shown above. We shall be looking if there are opportunities for conservative traders in the same market. In the below chart, we can see that the market broke below the S1. So, now we treat S1 as the resistance and prepare to sell when the price retraces to the S1 level. Similarly, we can enter for a sell when the price breaks below S2 and retests back to S2.

When it comes to the placement of stop-loss and take-profit, one can follow the same approach, as explained in the aggressive traders’ placement.

This brings us to the end of this lesson. Note that the above strategy is only to get an understanding of how to trade breakouts using pivot points. It is highly recommended to apply other technical tools to have more odds in your favor. Cheers.

[wp_quiz id=”69720″]
Categories
Forex Daily Topic Forex Price-Action Strategies

Don’t Lose Patience if a Chart Does not Produce the Signal

Breakout strategy traders wait for a breakout followed by a breakout confirmation candle. If the next candle does not close with a new higher high/lower low from the breakout candle, traders must not trigger entry. The price may go towards the trend sometimes, but it often goes another way. In today’s lesson, we are going to demonstrate an example of this where everything looks good, but it ends up without producing a signal candle.

The chart shows that the price heads towards the North with good bullish momentum. It finds its resistance and makes a correction. Upon finding its support, the chart produces a bullish engulfing candle. The candle suggests that the price may head towards the North. The buyers are to wait for the breakout followed by a breakout confirmation candle to trigger a long entry.

The price heads towards the North but does not make a breakout candle yet. The last candle closes within the level of resistance. The buyers must wait and keep their eyes on the chart since the breakout may take place anytime soon.

Here it comes. The last candle on the chart breaches through the level of resistance closing well above it. This is one good breakout candle. This must attract the buyers to stick with the chart and hope for the next candle to close above the breakout candle to trigger the entry. It looks extremely good. The entry is knocking at the door. Let us proceed to the next chart.

The breakout strategy buyers must be disappointed. After all the hours of waiting, the chart produces a bearish inside bar. Pullback buyers may wait for a bullish engulfing candle to go long in the pair. However, this chart does not have anything to offer for the breakout strategy traders at the moment. Let us proceed to the next chart to find out what happens.

The chart produces a bullish inside bar. However, the price heads towards the South with good bearish momentum. The last candle seems to hit the level of support as well. This means it does not produce any signal for the pullback buyers as well. It is disappointing when traders do not get the signal they wait for a long time. However, it does not hurt as much as a losing trade does. After a long wait, if a chart does not produce the signal, it often leads us towards taking bad entry in other pairs. Let us make sure we never do that. Patience is a great virtue as far as Forex trading is concerned. Traders must make sure that they have this virtue.