Categories
Forex Course

200. The Correlation Between USD/CAD Pair & Crude Oil

Introduction

Crude oil, also known as black gold, is the major energy source that runs the economy. Canada is among the top oil producers in the world. It is one of the major oil exporters to the USA. Canada exports more than 3 million barrels of petroleum and oil products, a figure that is sufficient to impact USD/CAD’s movement.

USD/CAD and Crude Oil – The Correlation

The volume of crude oil that Canada exports to the US generate massive demand for the CAD. Moreover, Canada’s economy depends a lot on its exports, and approximately 85% of the country’s exports go to the US.

Therefore, the value of USD/CAD is significantly impacted by how the consumers in the United States reach oil prices. If the US’s demand increases, manufacturers have to order more oil to cater to the rising demand. This can result in rising oil prices, thereby resulting in reducing the value of USD/CAD.

Conversely, if the US’s demand falls, the manufacturer will not need to order in more oil to make goods. Subsequently, the oil prices might fall, which would be bad from the CAD value. So essentially, USD/CAD has a negative correlation.

It’s all about Supply and Demand

Supply and demand are the prominent influencers of the correlation between USD/CAD and crude oil, impacting the demand and supply of US dollars and Canadian dollars.

Export of cruise oil covers a significant percentage of the US currency acquired by Canada. This means that a shift in the price and volume of crude oil will have a considerable impact on the flow of the Greenback into the Canadian dollar.

Furthermore, high crude oil prices also imply a higher flow of USD into Canada due to its exports. This implies that there will be a strong supply of the USD into the Canadian dollar, thereby increasing the value of the Canadian dollar.

Similarly, when the crude price falls, the US dollar supply will be lowered as opposed to the Canadian dollar, leading to a decreasing value of the Canadian dollar.

[wp_quiz id=”97486″]
Categories
Forex Basic Strategies Forex Daily Topic

Trade Ranges Like A Pro with this Effective Forex Trading Strategy

Introduction

The market does not move in random directions. It either trends or consolidates. As many would not know, the market is like a closed circle, and the same states keep repeating over and over again. Thus, in trading, one must learn how to become pro at reading these market states.

On that same note, we shall be going over an effective strategy when the market is in a consolidation/ranging state. However, before jumping right into the strategy, it is important to understand the basics and related concepts.

What is a consolidation phase in a market?

There are several ways to comprehend the consolidation phase of the market. There is logical reasoning behind the occurrence of this state, and is not simply a random pattern that shows up quite often.

The consolidation state is that phase of the market when the market moves in a sideways direction. This state is also referred to as a range. The reason for its occurrence is related to the strength between bulls and bears.

Comprehending a Range

There are two parties in the market – the bulls and the bears. Their strength is what describes the state of the market. In a trending market, either of the parties is powerful. For instance, if the market is going up, it simply means that the bulls control the market. In a consolidation state, both bulls and bears show equal strength. The bulls show strength by pushing the market higher, while the bears show power by taking the price right back down. As a result, the prices in both directions – which we refer to as a range.

How to draw a range?

To trade this range strategy, it is vital to understand how a range is drawn. A range is made up of two levels:

  • Support
  • Resistance

Thus, drawing the correct support and resistance levels will result in a perfect range.

Another point considered is the size of the range. The larger the range, the better. The other small consolidations in the market are ignored. Following is an example of how we pick an ideal range.

In the above example, both are ranges as the market is moving in a sideways direction. However, we do not consider range-1 as a range for our strategy. This is because a single line going up and down fails to depict the market’s price action.

Supply and Demand Range Strategy

What is the usual approach to trading a range? It is to buy at the support and sell at the resistance. But we’re going to step the game a little bit. The supply and demand range strategy uses the same principles of a typical range, in addition to other factors.

Step by step procedure to trade the Supply and Demand Range Strategy:

  1. Find a legitimate range in the market. Mark the Support and Resistance levels appropriately.
  2. Determine the direction of the market prior to the range.
  3. Find a potential supply/demand level.
  4. Get in when the market breaks through the range and reaches the supply/demand zone.

Buy Example

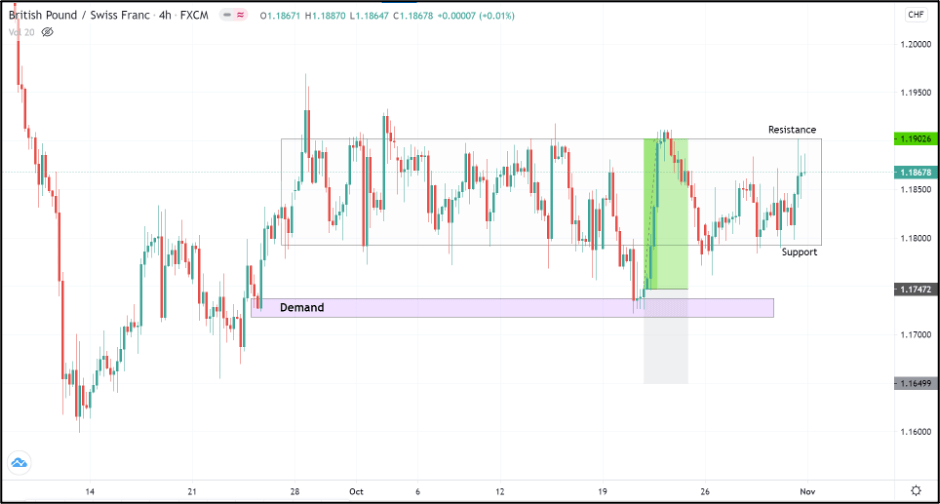
Consider the below chart of GBPCHF on the 4H timeframe. We see that the market has been ranging between 1.1902 and 1.1800. Observe that the support and resistance levels have been marked by cutting off the false market breakouts.

To trade this market, our job is not simply to hit the buy at the support and sell at the resistance. As mentioned, we take into account the preceding direction and the supply and demand levels around it.

The direction of the market prior to the range was an upside, indicating that the bulls were in control previously. A point to note is that, despite the market being in a range, it does not change the fact that the bulls are still powerful. Thus, we rather look for buying opportunities than shorting signals.

To do so, we wait for the price to drop below the bottom of the range and hold at any one of the demand zones. Once the market begins to reverse its direction from south to north around the demand zone, we can go long. The same scenario has been illustrated in the chart below.

Placements

Stop Loss – Well below the demand zone would be decent.

Take Profit – Top of the range would be an ideal spot to take profits.

Sell Example

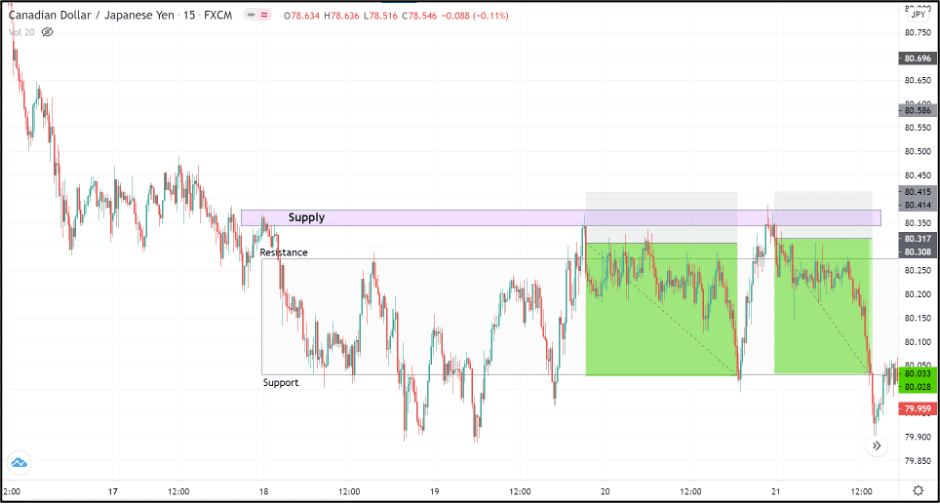
Consider the chart of CAD/JPY on the 15min timeframe shown below. The recent market price action depicts that the market is moving sideways. The market’s overall trend is down, indicating that the bears are in control of the market.

Since the scenario is opposite to the previous example, we wait for the market to break through the resistance and reach any potential supply level. In the below example, we can see that the price broke through the resistance twice reacted off from the supply, as shown. Thus, we can look for entries when the market begins to switch direction to the downside.

Placements

Stop Loss – Above the supply zone

Take Profit – Bottom of the range

Conclusion

The only way to trade a range is not by buying and selling from the top and bottom of the range. It can be professionally traded with the application of other factors. And this range strategy particularly dealt with the strength of the bulls and bears and the concept of supply/demand.

We hope you were able to comprehend our Supply and Demand Range strategy. Do test them out for yourself and let us know your results in the comments below. Happy trading!

Categories
Forex Daily Topic Forex Economic Indicators

What Moves the Forex Markets?

Analyzing the Forex Market

There are three ways to interpret the Forex markets: Fundamental Analysis, Technical Analysis, and Sentiment Analysis. But the markets move for just one reason: Supply and demand.
Supply and demand changes slowly or fast, depending on the current economic events, but that change is due to the Sentiment or beliefs of the major operators about what they think are imbalances of the market. That happens when institutional traders believe the current price is not a fair price, and it is due to change in the near or far future. The best strategies combine the tree methods to make the trading decisions, but a trader must always keep in mind the fundamental forces that move the Forex markets.

Fundamental Analysis

Fundamental Analysis deals with the economic and political events and situations that change supply and demand. Among the most important indicators are economic Growth Rates, Inflation, Interest Rates, Government Debt and Spending, Gross Domestic Product, and Unemployment. Fundamental Analysis combines all this information to determine the possible sentiment of the market participants and ultimately forecast the future performance of an asset.

Supply and Demand

Currencies’ prices change primarily driven by supply and demand. If the supply is larger than the demand, the price drops, and if the opposite happens, it goes up. We, as traders, cannot determine if the imbalance of the supply-demand forces is due to hedging, speculation, or monetary conversion. For example, the US dollar moved with strength from 1998 to 2001 when the Internet as the NASDAQ boom drove international investors to participate in the US financial markets in search of high returns. Investors had to buy dollars and sell their local currency, so the Dollar gained strength. At the end of 2001, the political climate changed after the 9/11 event, the stock market fell hard, and the FED started to cut interest rates. Therefore, stock investors moved their capital elsewhere, so they sold the Dollar, and its price dropped.

Capital Flows and Trade Flows

The flows of capital and trade are two major factors in the balance of payments. These two factors quantify the amount of demand for a currency. Common sense tells us that a balance of zero is needed for a currency to hold its value.
A negative number in the balance of payments will indicate that capital is leaving the domestic economy more rapidly than it is entering. Under these circumstances, the currency should move down. The opposite should happen if the balance of payments is positive.
An example of this is the Japanese Yen. Despite the fact of negative interest rates, the Japanese yen has managed to trade mostly moved by its high trade surplus; thus, this currency tends to increase in value. The Japanese government uses a negative interest rate policy and increases the money supply (by printing new money), counteract the inflows of currency coming from the export business to hold the currency’s value to a level not endangering its export business.

The capital flows show a measure of the net amount of currency bought and sold due to capital investments. A positive figure implies that the inflows originated from international investors entering the country exceded those bought by domestic investors abroad.

Physical Flows

Physical flows are originated by foreign investments, directly purchasing real estate, manufacturing facilities, and acquisitions of local firms. These operations require that foreign investors buy dollars and sell their local currency.
Physical flows data are essential, as they show the underlying changes in the physical investment activity. A change in the local laws encouraging foreign investments would boost Physical inflows. That happened in China when it relaxed the laws for foreign investment due to its entry into the World Trade organization in 2001.

Portfolio Inflows

Portfolio inflows measure the capital inflows in the equity and fixed-income markets.

Equity Markets

The Internet and computer technology enabled a greater easy to move fast and easily capitals from one market to another one in the search for profit maximization. A rally in the stock market can be an opportunity for any investor no matter where he lives. If the equity market rises, the money will flow in and drive the local currency up. If it moves down, investors would quit and move their money away.
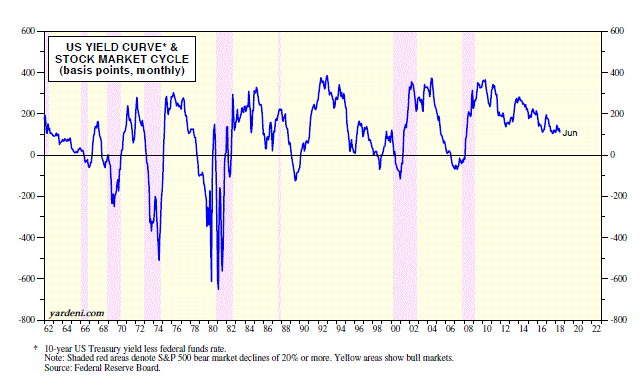
Fig 1 – US Yields versus Stock Market Cycles

(source: http://estrategiastendencias.blogspot.com/)

The attraction of the equity markets compared to fixed-income markets ( bonds and monetary investments) is growing since the early 90ies. For example, the foreign transactions of US government bods dropped from 10-1 to 2-1.
That can also be verified when we see that the Dow Jones has over 80 percent correlation with the US Dollar Index.
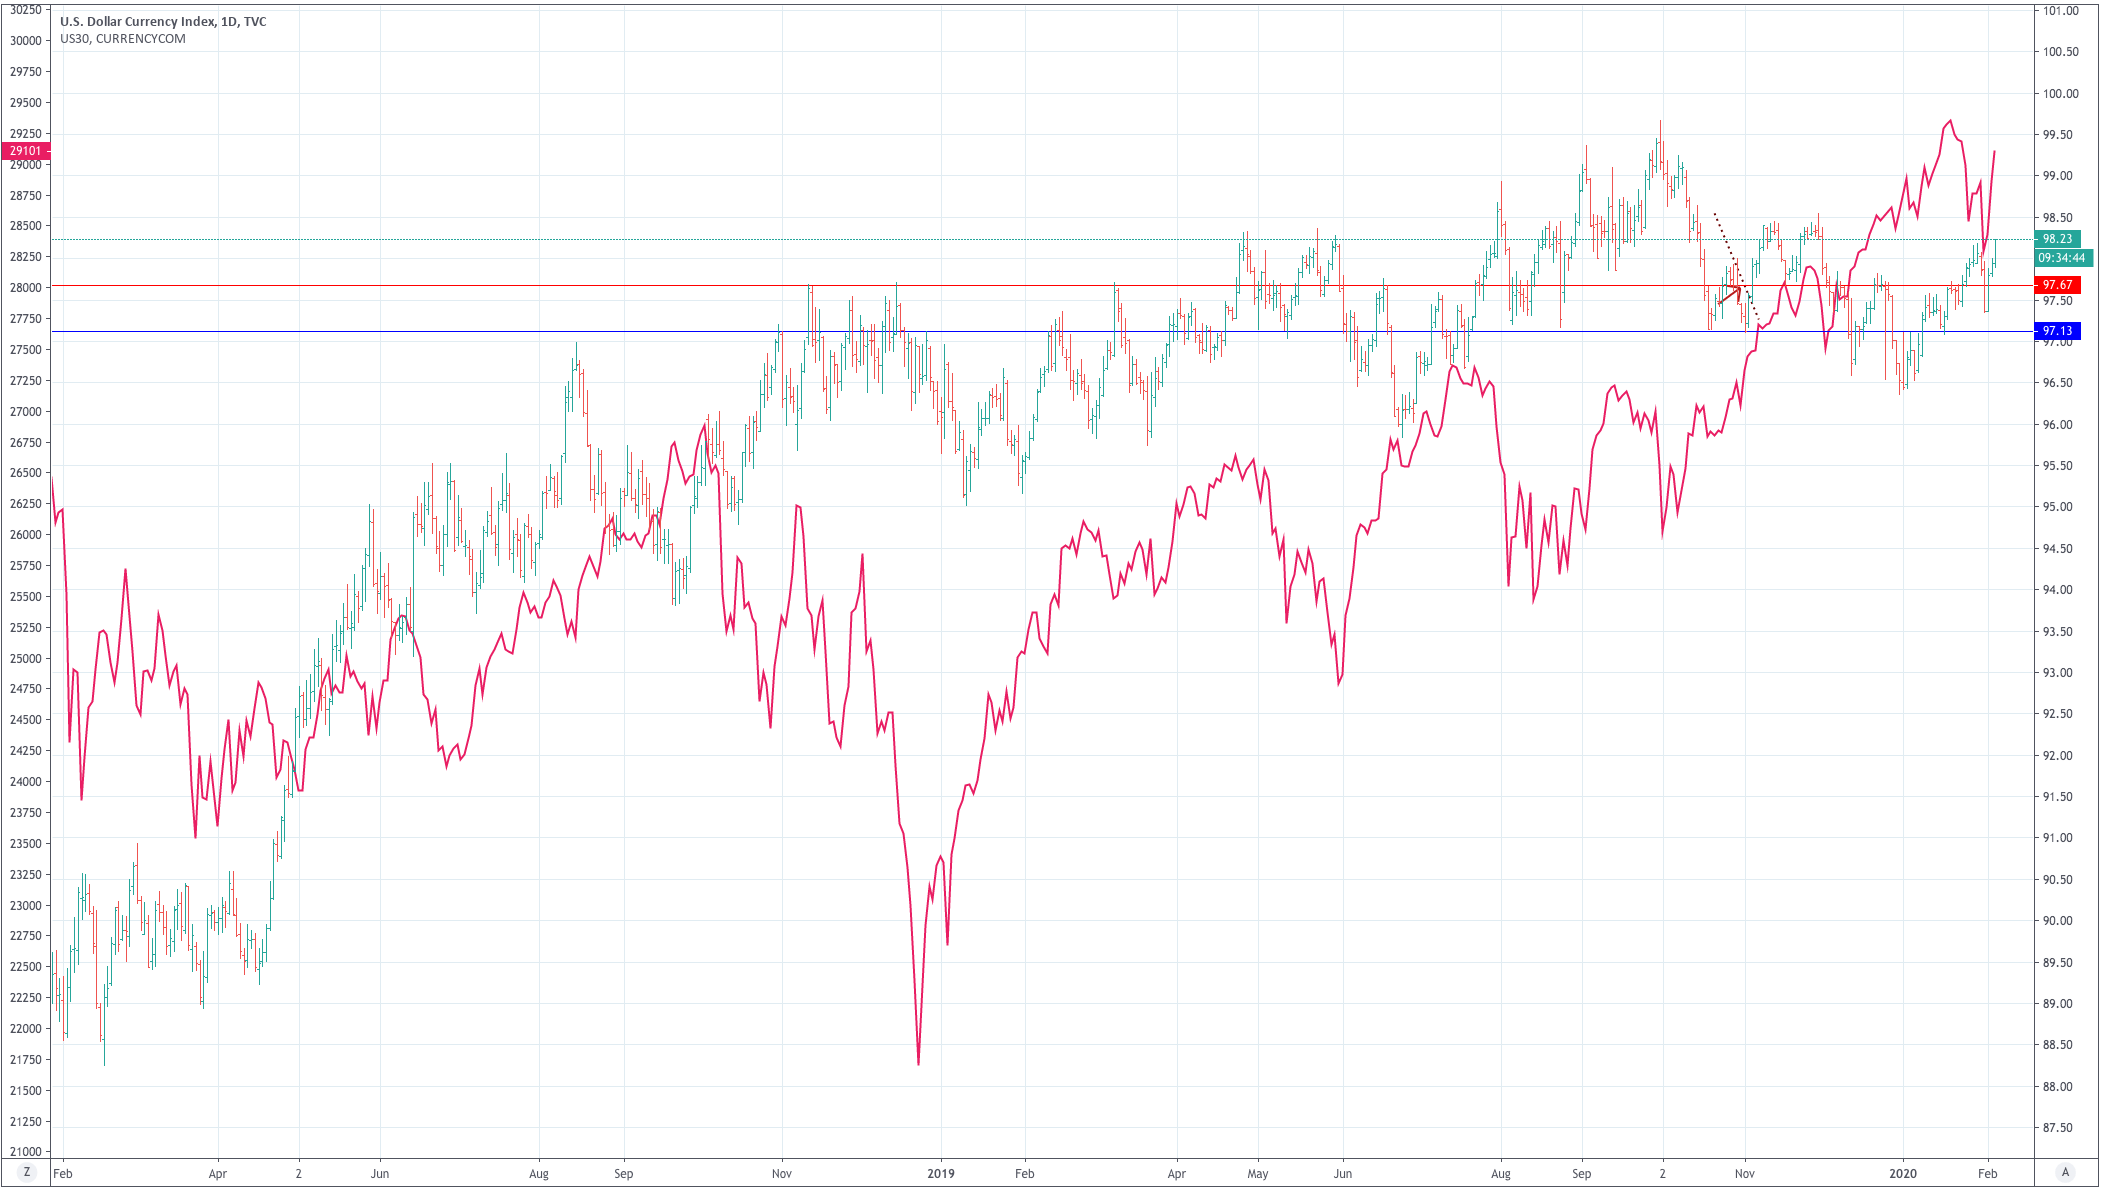
Fig 2 – US Dollar Index and the DOW-30 correlation  (Created using Tradingview)

Fixed Income Markets

Fixed income markets start being appealing in times of global uncertainty due to the perceived safe-haven nature of this type of investment. As a result, countries offering the best returns in fixed income products are more appealing and attract foreign money, which would need to be converted to the country’s money, boosting the demand for this particular currency.
A useful metric to analyze fixed-income flows is the short and long-term yields of the different government bonds. For example, comparing the 10-year US Treasury note yield against the yields on foreign bonds. The reason is that investors tend to move their money to countries offering the highest-yields. Thus, for instance, a rise in yields would signify a boost in the inflow of fixed-income capital, which would push the currency up.
Aside from the US Treasury notes, the Euribor futures or the futures on the Interbank Rate is a good gauge for the expected interest rate in the Eurozone.
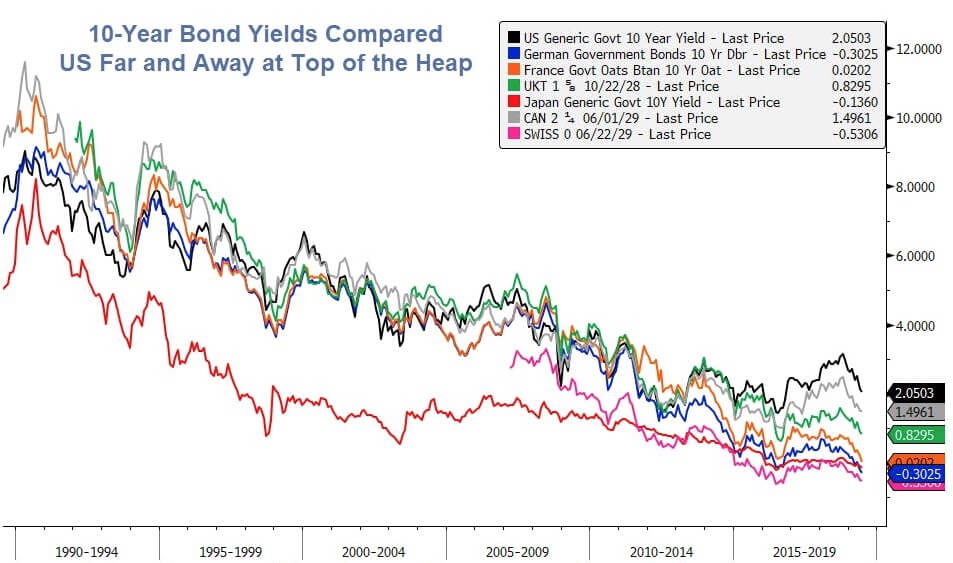
Fig 3 – 10-year note yield curves on Industrialized Countries

(from https://talkmarkets.com/)

Trade Flows

Trade flows are needed for import and export transactions. The Trade flows figure is a measure of the country’s trade balance. Countries that are net exporters will show a net surplus. Also, they will experience a rise in the value of their currencies as the result of the exchange transactions, when exporting companies trade the foreign currency for local money, as the local currency is bought more than sold.
Net importer countries will show a negative figure in its trad flow metric, and, since its currency is more often sold than bought will experience a push to the downside.

Economic Surprises

It seems logical that changes in any of the discussed flows would affect the involved currency pair. Traders, though, should focus on economic surprises. That is, data releases that are considerably different from the consensus forecasts. An unexpected figure would shatter the market and likely produce a long-term trend change. The trader should not trade the event itself, but use it to forecast future price trends and plan his short-term trading strategies with the long-term figure in mind.


Reference: Day Trading and Swing Trading the Currency Market, Kathy Lien


Categories
Forex Basics

Supply, Demand and Liquidity as Drivers of Prices

Markets are “places” where people and institutions exchange assets. It may be stock shares, commodities, grain, livestock, or currencies, but all markets behave similarly. Buyers and sellers look for the best possible price. A buyer seeks to buy at the cheapest possible price, while the seller wants to sell at the highest price.

How prices move

If we order buyers and sellers by the price they are willing to accept, we could see some buyers are bidding an amount very close to the price sellers are asking, and from there, the distance grows in a kind funnel-like shape.

For a sell to occur, one of them must cross the bridge and accept the other side’s price. Also, when a seller moves and takes the ask price for the first time, the “Last price” moves down a little. If another seller does the same, there might be other buyers willing to buy at the same level or not. If there are more buyers at that level, the next seller who takes the ask does not create an additional downward movement. If all buyers disappear from this level, the seller should accept a worse price, moving the asset down, or hold until a buyer takes his bid.

Conversely, if a buyer takes a bid price for the first time, the price of the asset moves up. If other buyers get in and deplete this level from sellers, they should buy at higher prices or wait till a seller takes his ask price.

Supply and Demand

Demand

The demand for an asset decreases as the price increases. The rate of that decline depends on the need for the asset and also on the perceived future value of the asset.

Supply

The supply increases as the price increases. The rate of increment depends mostly on the sellers’ belief about the future price growth of the security.

Equilibrium

Supply and demand are what drives prices up and down. If there are an equal number of buyers and sellers, the price stays at one level and is said to be in equilibrium.

When there are more buyers than sellers, the price moves up until a new equilibrium is reached. Conversely, if the number of sellers is higher, the price moves down until sellers and buyers get the new equilibrium.

Fair Price

The equilibrium is the result of a consensus about the fair price of the security, but fair price changes with the passage of time. The change in fair price may come from technical factors ( overbought-oversold levels, pivot points, breakouts), economic reports such as interest rates, GDP, manufacturing, nonfarm Payrolls, and inflation, or unexpected news events. The new price does not manifest itself in a single and swift price movement because that price is not known at the time. That’s the reason for the appearance of trends.

Liquidity

Liquidity is the term used to define the number of buyers and sellers present in the market.

In a very liquid market, the number of buyers and sellers is vast. Large-sized orders do not affect the price much. Also, bid and ask prices get closer to each other because buyers and sellers compete among themselves to offer their best bid and ask prices. That means spread tightens.

A market with low liquidity shows a scarcity of buyers and sellers. The size and number of operations are tiny, and one small order can produce significant price variations up or down. Also, usually, spreads widen because there is less competition among participants. Low liquidity may cause market manipulations since it is easy to drive prices up or down.

Liquidity does not depend only on the market in question. It changes with the time of the day. For instance, the EURUSD shows less liquidity during the Tokyo session. Then it grows when the European exchanged opens, and it maximizes at the open of the US session. Finally, it fades after Europe closes its markets and traded volume declines further after the US closes.

Final words

  • Supply and demand drive the prices up or down until an equilibrium is reached.
  • The equilibrium breaks by a change in the perception of value by the parties trading it.
  • High liquidity is the key factor for tightening spreads and making markets flow without price manipulation.