Categories
Forex Fundamental Analysis

The Impact of ‘Gross Domestic Product Estimate’ Economic Indicator On The Forex Market

Introduction

In most economies globally, the GDP data is published by governments or government agencies quarterly. This would mean that analysts, economists, and households would have to wait for a full quarter to know how the economy is performing. Naturally, this long wait can be frustrating and, in some cases, inconveniencing. Therefore, having some form of estimate as to what the GDP might be can be quite useful.

Understanding Gross Domestic Product Estimate

As the name suggests, the GDP estimate serves to estimate an economy’s GDP before the release of the official government-published GDP report.

These estimates are arrived at by surveying the industries within the country. In the UK, for example, the following industries are surveyed; production, manufacturing, mining and quarrying, agriculture, construction, private services, and public services. Most estimates adopted globally use the bottom-up methodology.

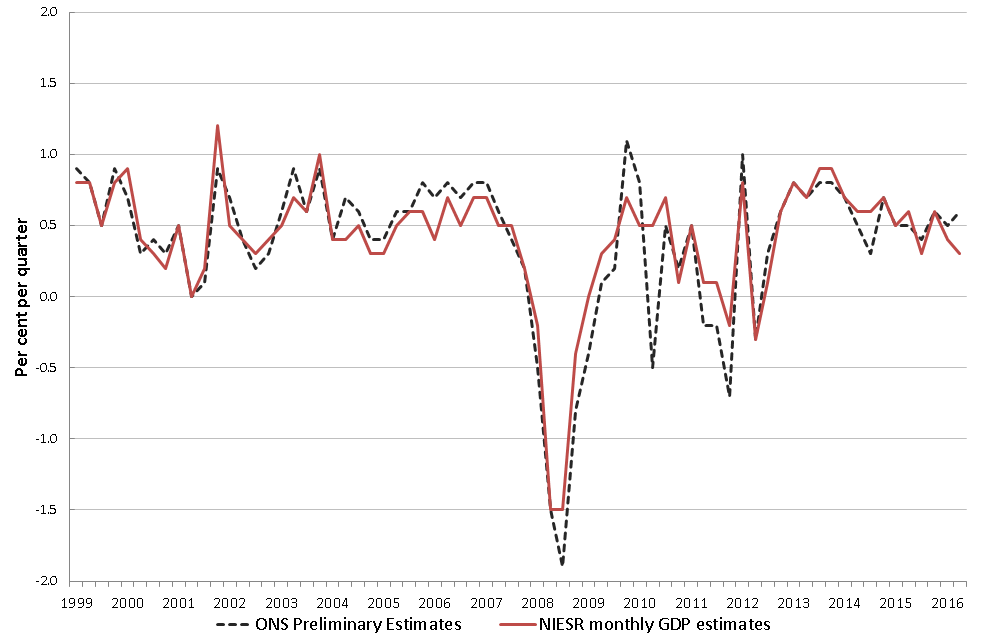
Source: National Institute of Economic and Social Research

In the UK, the National Institute of Economic and Social Research (NIESR) publishes a rolling monthly estimate of the GDP growth using the bottom-up methodology. Hence, its GDP estimate covers the preceding three months. Since the GDP estimates are published monthly, it means that NIESR releases at least four GDP estimates before the government’s publication. Using the bottom-up analysis to estimate the GDP, NIESR uses statistical models to aggregate the most recent trends observed within the GDP subcomponents. The statistical models are fed the latest trends, and they forecast the most probable outcome in these subcomponents. Note that these forecasts are only short-term.

While the GDP estimates are not always accurate to the exact decimal percentage, they provide an accurate GDP representation.

Using the Gross Domestic Product Estimate in Analysis

The GDP estimate data can be used in the timely analysis of economic performance. Here is how this data can be used.

In many countries, the macroeconomics policies are usually set more frequently than quarterly. However, since the economic performance is the centerpiece in any macroeconomic policy-making, it is vital to know the most recent GDP data. By tracking the trends of the top components of the GDP, the GDP estimates can provide the most recent data. Therefore, this will help the policymakers to implement more informed policies. Let’s see how the contrast between the GDP estimate and the actual GDP can make a difference in policy implementation.

For example, during the second quarter of 2020, governments and central banks wanted to implement expansionary fiscal and monetary policies. At this point, the only GDP data available to them is the actual GDP for the first quarter of 2020. But for most economies, the 2020 Q1 GDP showed economic growth. On the other hand, the more recent GDP estimates could show that contractions were already visible in the economy.

In this scenario, if policymakers were to use the actual data available to then – the Q1 GDP – they would have made undesirable policies. These policies would have further harmed the economy. On the other hand, if the GDP estimates would have been used to aid the policy implementation, chances are, the most suitable and appropriate monetary and fiscal policies would have been adopted. Here, the GDP estimate would have helped them make relevant policies and ensuring that these policies are implemented timely.

Furthermore, the GDP estimates can also be used to establish whether the policies implemented are working as expected. If expansionary policies are implemented, their primary goal is to spur demand and stimulate economic growth. Using the GDP estimate, policymakers can track to see if there are any changes experienced in the economy. Some aspects like inflation take a long time to adjust, but demand generated by households is almost instantaneous. Therefore, the GDP estimate can be used to gauge the effectiveness of the implemented policies. Take the stimulus packages adopted in Q2 2020 after the pandemic; they were meant to stimulate demand by households, which would lead to economic recovery. With the GDP estimate, we could tell whether the stimulus package worked or not.

When accurate, the advance GDP estimate can be a leading indicator of the actual GDP. Therefore, the GDP estimate data can be used to show the prevailing trends in the economy. For instance, it can be used to show looming periods of recession and any upcoming recoveries. Say that the trailing three months captured by the GDP estimate shows that the economy’s major subcomponents are struggling with demand and contracting. This data can be taken to mean that for that quarter, there is a higher probability that the overall economy would contract. Conversely, when the subcomponents being tracked show growth, it can be expected that the overall economy would have expanded in that quarter.

It’s not just the governments that can benefit from the GDP estimate data. The private sector as well can use the data to plan their economic activity. Take the example that the GDP estimate shows that a particular sector in the economy has been contracting for the previous three months. Investors in this sector can presume that the demand for goods or services from the sector is depressed. In this instance, to avoid venturing into loss-making businesses, investors can make informed decisions about where and when to invest their money.

Impact on Currency

When the GDP estimate shows that the short-term economy is expanding, the domestic currency will appreciate relative to others. A short-term expansion indicates that demand levels in the economy are higher, which implies that unemployment levels are low and households’ welfare is improving.

The domestic currency will depreciate if the GDP estimate shows that the economy is contracting. The primary driver of a contracting economy is decreased expenditure by households contributing almost 70% of the GDP. The decline in demand can be taken as a sign of higher unemployment levels.

Sources of Data

In the UK, the National Institute of Economic and Social Research publishes the monthly and quarterly UK GDP estimate.

How GDP Estimate Release Affects The Forex Price Charts

The most recent UK GDP estimate published by NIESR was on October 9, 2020, at 11.10 AM GMT and accessed at Investng.com. Moderate volatility on the GBP can be expected when the NIESR GDP estimate is published.

During this period, the UK GDP is estimated to have grown by 15.2% compared to 8.0% in the previous reading.

Let’s see how this release impacted the GBP.

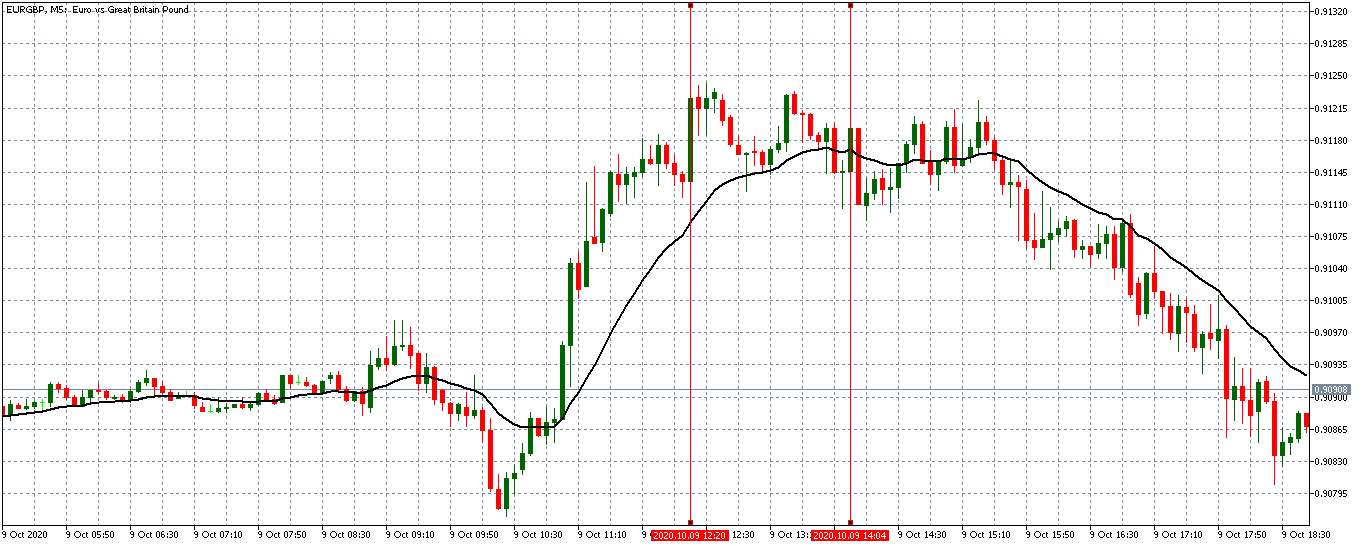
EUR/GBP: Before NIESR GDP Estimate Release on October 9, 2020, 
just before 11.10 AM GMT

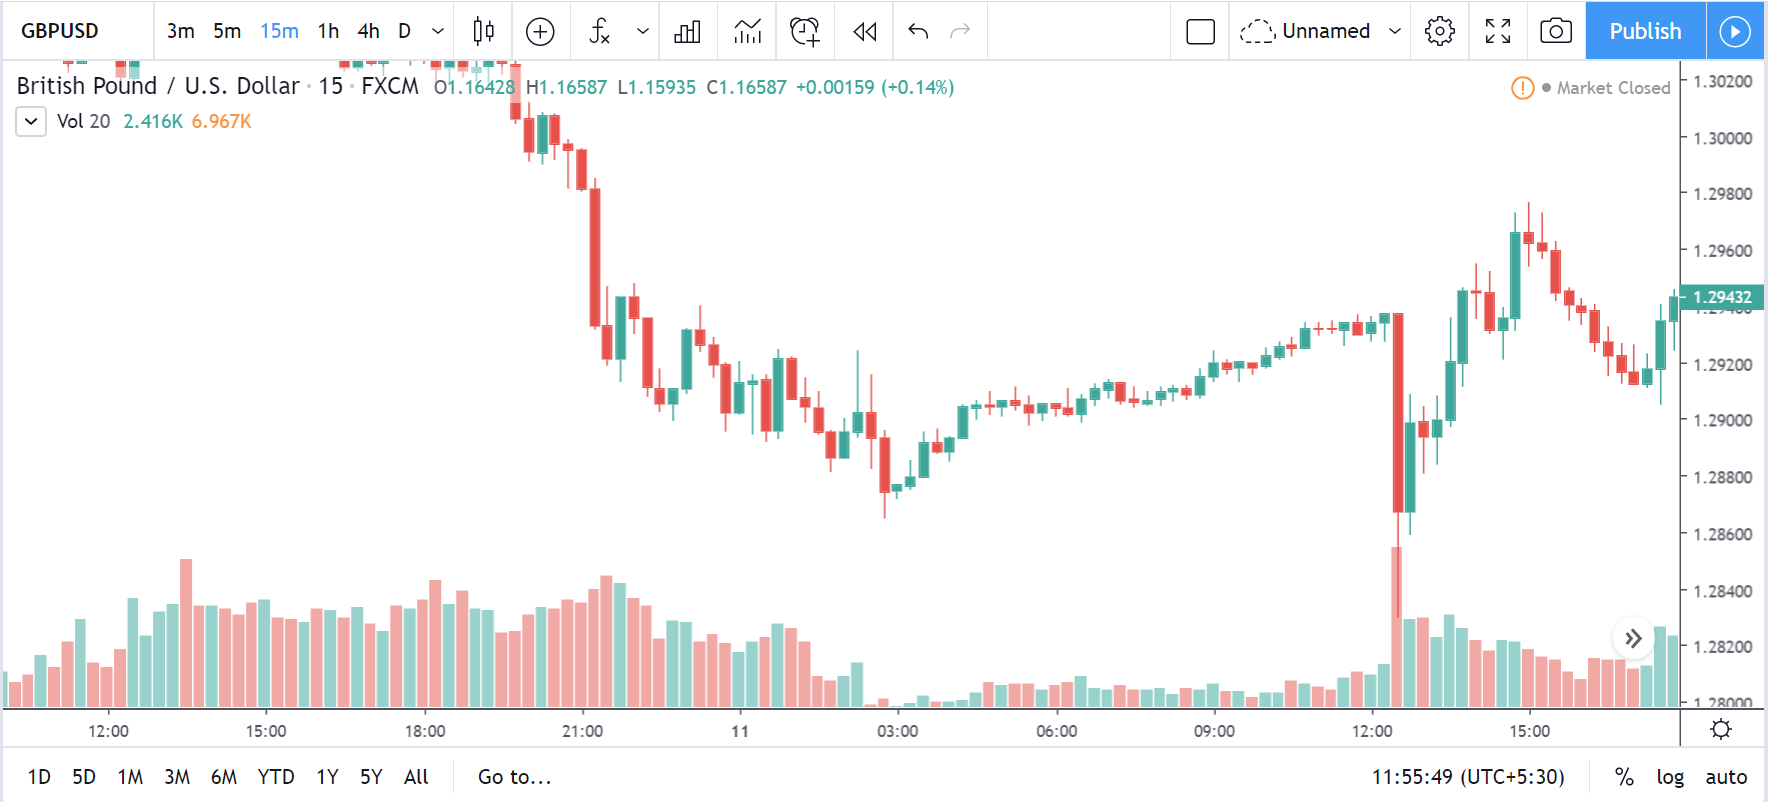
Before the release of the NIESR GDP Estimate, the EUR/GBP pair was trading in a subdued uptrend. The 20-period MA transitioned from a steep rise to an almost flattened trend with candles forming just above it.

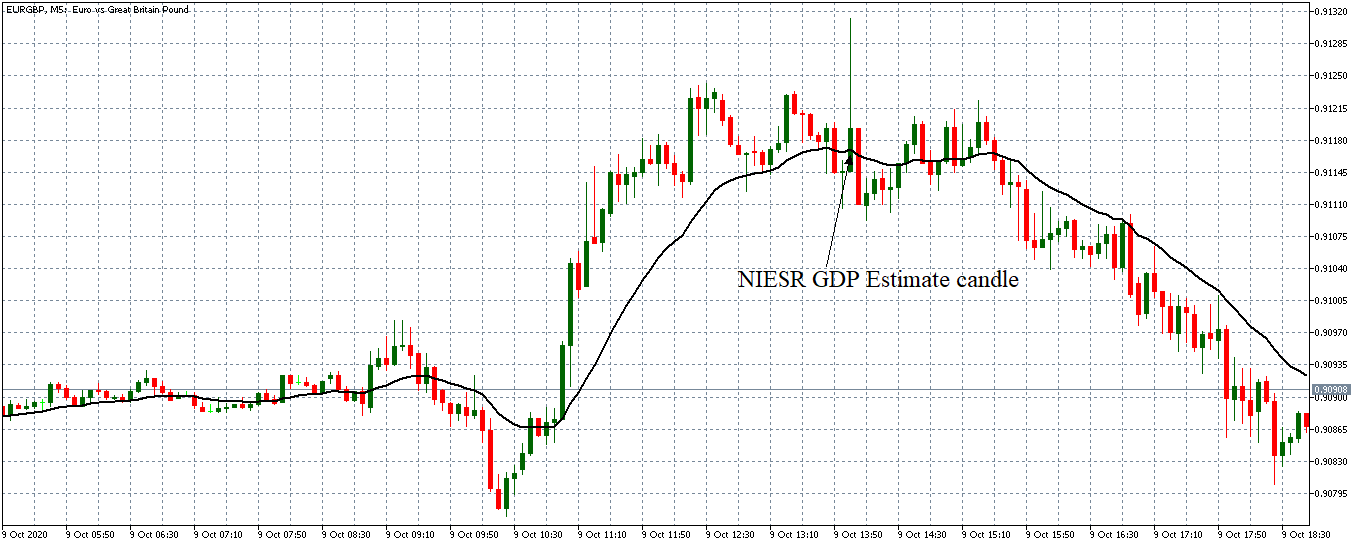
EUR/GBP: After NIESR GDP Estimate Release on October 9, 2020, 
at 11.10 AM GMT

After the GDP estimate release, the EUR/GBP pair formed a 5-minute bullish ‘inverted hammer’ candles with a long wick. This candle represents a period of volatility in the pair as the market absorbed the data. Subsequently, the pair traded in a neutral trend before adopting a steady downtrend with the 20-period MA steeply falling.

Bottom Line

The GDP estimate is not just relevant to investors and policymakers; as shown by the above analyses, it can result in periods of increased volatility in the forex market when it is published. Cheers!

Categories
Forex Fundamental Analysis

Comprehending ‘Credit Rating’ & Its Importance as a Macro Economic Indicator

Introduction

The credit rating of an institution, organization, the government is like a pseudo report card of its ability to pay back its debt. The credit rating process is thorough and detailed. The credit rating of a country or a government, in that case, can significantly impact the inflow of domestic and foreign Investments. It is one of the major indicators around which a lot of volatility occurs in the financial markets; therefore, understanding the credit rating system is important.

What is Credit Rating?

Credit Scoring

Among the general population, people who have a job are usually aware of a credit score that is attributed to them buy one or more agencies within that country. For example, in India, CIBIL, which stands for Credit Information Bureau (India) Limited, is the primary agency that assigns credit rating to individuals.

The credit rating of an individual largely determines the eligibility to apply for a loan from any financial institution. A high score would indicate that the individual is capable of repaying on time, and conversely, a low score would mean that there is a high risk of defaulting on repayment by the individual. The credit score of an individual takes into account the history of loans, repayment records and past defaulting records, and his current net income. Based on all these factors, the calculated score then tells their worthiness of credit.

For example, a CIBIL score greater than 750 in India is usually seen as a minimum requirement to be eligible for a loan by most banks. The individual usually seek out to maintain a high CIBIL score to be eligible to borrow a higher amount of loan and lower interest rates as a lower score would greatly diminish their loan eligibility, and even if they do get a loan, they will have to pay higher interest rate than people with a good CIBIL score.

Credit Rating 

Credit scoring applies to individuals within a country, whereas credit rating applies to institutions, organizations, and governments. Similar to credit scoring credit rating tells whether that organization is credit working or not.

Credit rating becomes important as here the borrowers are big institutions, government, large financial organizations, and the lenders are also big investors or foreign bodies. The loan amount is high, often ranging in millions and billions, and the duration of the loan is also long. Hence, investors actively seek credit ratings before deciding to purchase a particular Bond and lending their money.

How are the Credit Ratings calculated?

There are many globally popular credit rating agencies. In the United States, three companies, namely, Fitch Ratings, Standard and Poor’s Global (S&P Global), and Moody’s Corporation, are the most famous and sought after agencies.

The credit rating process is very thorough and accounts for the entity’s entire debt and its repayment history. The process requires credit rating from the agency to meet with the organization and going over their financial records to assess their current financial status and assess their eligibility. They also take into account that past loan repayments and spending patterns, their current financial assets, and future economic prospects.

After this, a group of credit raters will work out the credit rating for that organization. The process may take up to 4 weeks in general. When the credit rating is ready, it is given out to the company and for a press release. The credit rating agencies usually follow an alphabet combination rating system.

For example, according to Standard and Poor’s Ratings, an organization having AAA rating is said to be outstanding, which is the highest rating possible. Next below is AA+, which means excellent this goes down a rating of D, which is the lowest score. The formats of writing may vary slightly from company to company, but in general, they have an understandable notation of alphabet combinations.

Are Credit Ratings important?

The credit ratings became particularly important after the 1936 rule, which restricted Financial Institutions to lend money to speculative bonds, i.e., having low credit ratings in other words.

Many companies now actively seek to get their credit rating assessed to gain the confidence of investors. The financial markets also have seen enough market crashes, the system collapses, and payment defaults even by the most reputed organizations and nations also. The European debt crisis and the Greece default one of the most popular instances wherein national level collapse of financial institutions and debt default occurred in the recent times of 2010-2011.

In one sense, there is a link between capital inflow and credit rating, hence government and financial corporations, when requiring money, the credit rating becomes a significant number.

The credit rating is not a performance report for a particular set year; instead, it is a continuously updated statistic that tells the credibility of the entity at the current time. For example, a country with the best credit rating last year may not have the same rating this year. The credit rating cuts through all the false alarms and directly gauges the financial numbers, which always tell the truth.

Hence, once the agencies publish credit ratings for a particular sovereign body, there tends to be a lot of volatility as investors either become gain or lose confidence in that body. Conversely, a decreased credit rating than the previous number, also stirs down the market in a negative direction.

Credit ratings, particularly sovereign credit ratings, are major indicators for investors, and hence the government bodies take utmost attention to loan repayment to avoid defaulting and thereby spoiling their credit rating, which will cost them future monetary indentures. Government bodies are aware that decreased credit rating will result in foreign investors stepping back, and consequently, losing their funding, which can, in extreme cases, lead to a total collapse of the institution or an economy at a large scale.

How can the Credit Ratings be Used for Analysis?

An institution with a low credit rating is considered a high-risk investment as the prospects of that company being able to repay is low.

A decrease in the sovereign credit rating signals an economic slowdown from which the country may take a significant time to recover. Conversely, a high credit rating for sovereign bodies and conglomerates indicates that the economy is stable and growing, and there are ample financial resources to pay back the debt on time.

Credit ratings are released quarterly, usually, after the financial numbers of the organization are released. They can be used as current macroeconomic indicators and also be used to predict future expansion plans of the borrowing party, as an institution borrows money to expand or invest in its growth.

Sources of Credit Rating Reports

For reference, Fitch credit ratings are published frequently on their official website.

Since Credit Rating is a major indicator, media coverage is huge and is easily available across the internet. For reference, this is a rating table given in Wikipedia.

Impact of the ‘Credit Rating’ news release on the price charts 

After understanding the meaning and significance of Credit Rating in a country, we shall now see the impact it makes on the currency after the Ratings are declared. There are many agencies that give Ratings to different countries, but the two most reliable and followed are the Ratings given Fitch and Standard and Poor’s (S&P). In today’s article, we will be analyzing the Credit Rating of the United Kingdom announced in the month of December. Credit Rating is said to be a major event in both the forex and stock market, which has a long-lasting effect on the value of a currency. Therefore, the rating could largely determine the degree of volatility in the currency pair.

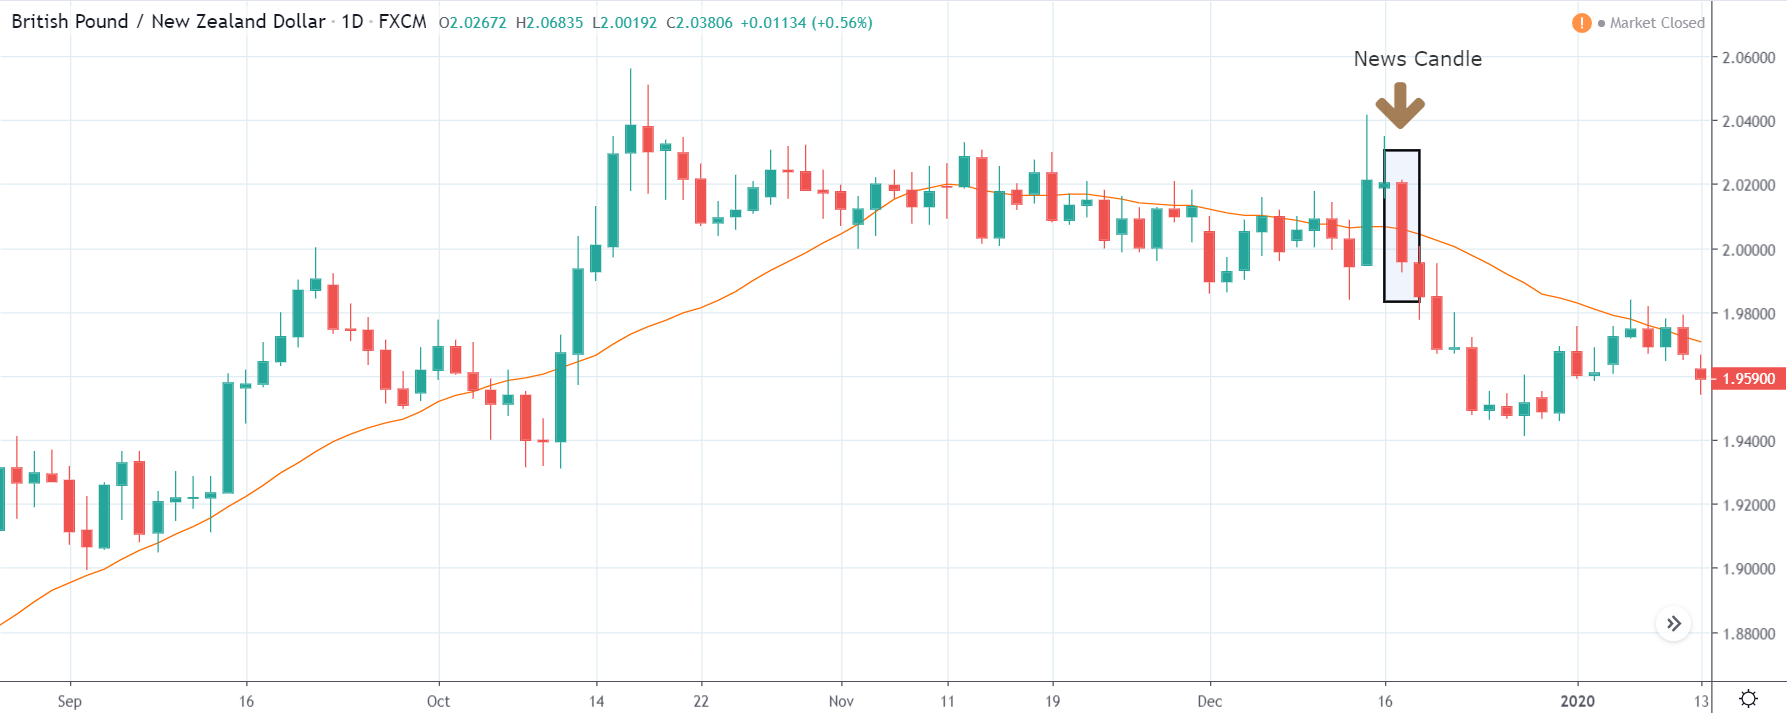
In forex trading, Credit Rating is used by sovereign wealth funds, pension funds, and other investors to gauge the creditworthiness of a county, thus having a big impact on the country’s borrowing costs. As we can see in the above image that Fitch’s Credit Rating for the United Kingdom was last reported at AA with a negative outlook. Since the rating was unhealthy for the economy, let us see how the market reacted to this.

GBP/CAD | Before The Announcement

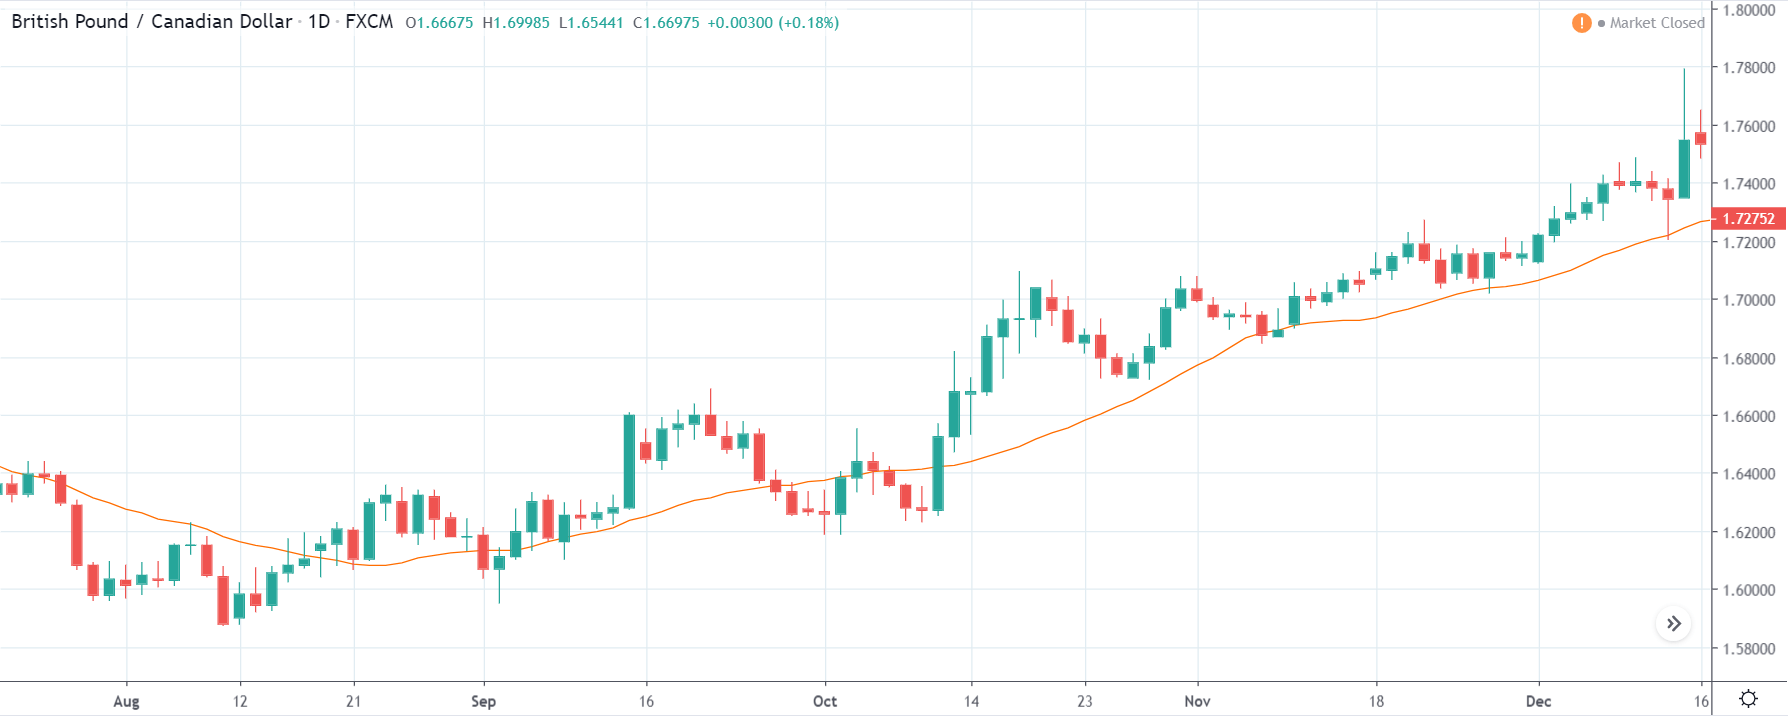
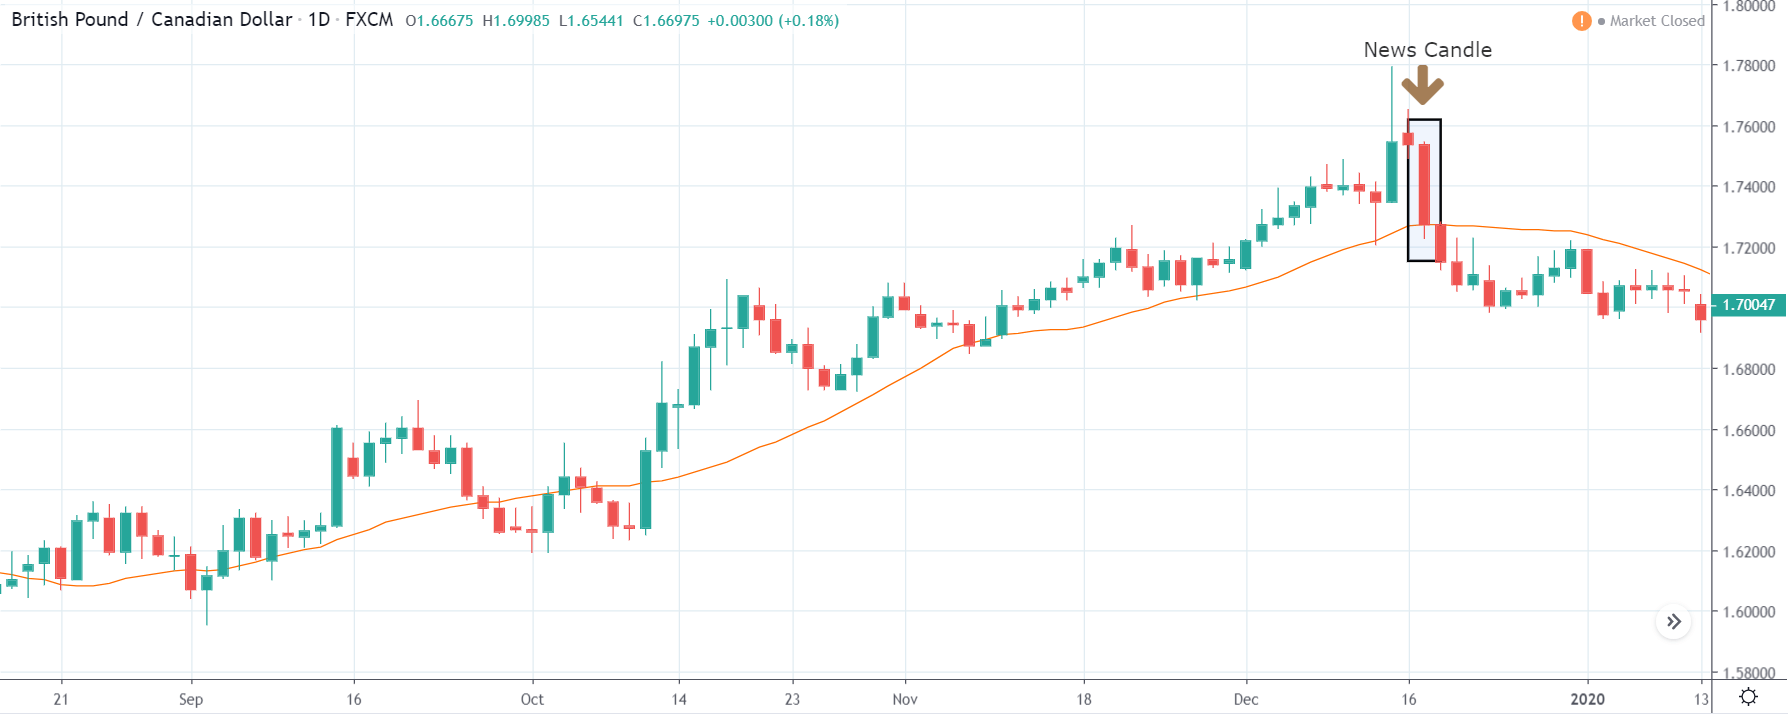
As the Credit Rating announcement is one of the biggest data releases of a country, volatility caused by the news release can be witnessed more clearly on a daily time-frame chart. Likewise, we have considered the ‘daily’ chart of GBP/CAD that shows an uptrend market. As we do not have any forecasted data available for the same, we cannot take any position in the market based on predicted ratings. The only way we position ourselves in the market before the news announcement is through the ‘options’ segment, where we can essentially take advantage of the increase in volatility on either side.

GBP/CAD | After The Announcement

On the day of the Credit Rating announcement, we see that the market falls by more than 500 pips resulting in a complete reversal of the trend. This shows the extent of the impact of Credit Rating on a currency pair. The reason behind the collapse of the British Pound is negative Credit Rating given by the two most renowned agencies.

This rating is used by institutional investors and fund managers to decide if they want to park their cash in the economy. Therefore, when the rating is downgraded, investors withdraw their money from the market and sell British Pound. From a trading point of view, one can take a ‘short’ position in the market with a high much higher ‘take profit’ since the market has the potential to go much lower.

GBP/JPY | Before The Announcement

GBP/JPY | After The Announcement

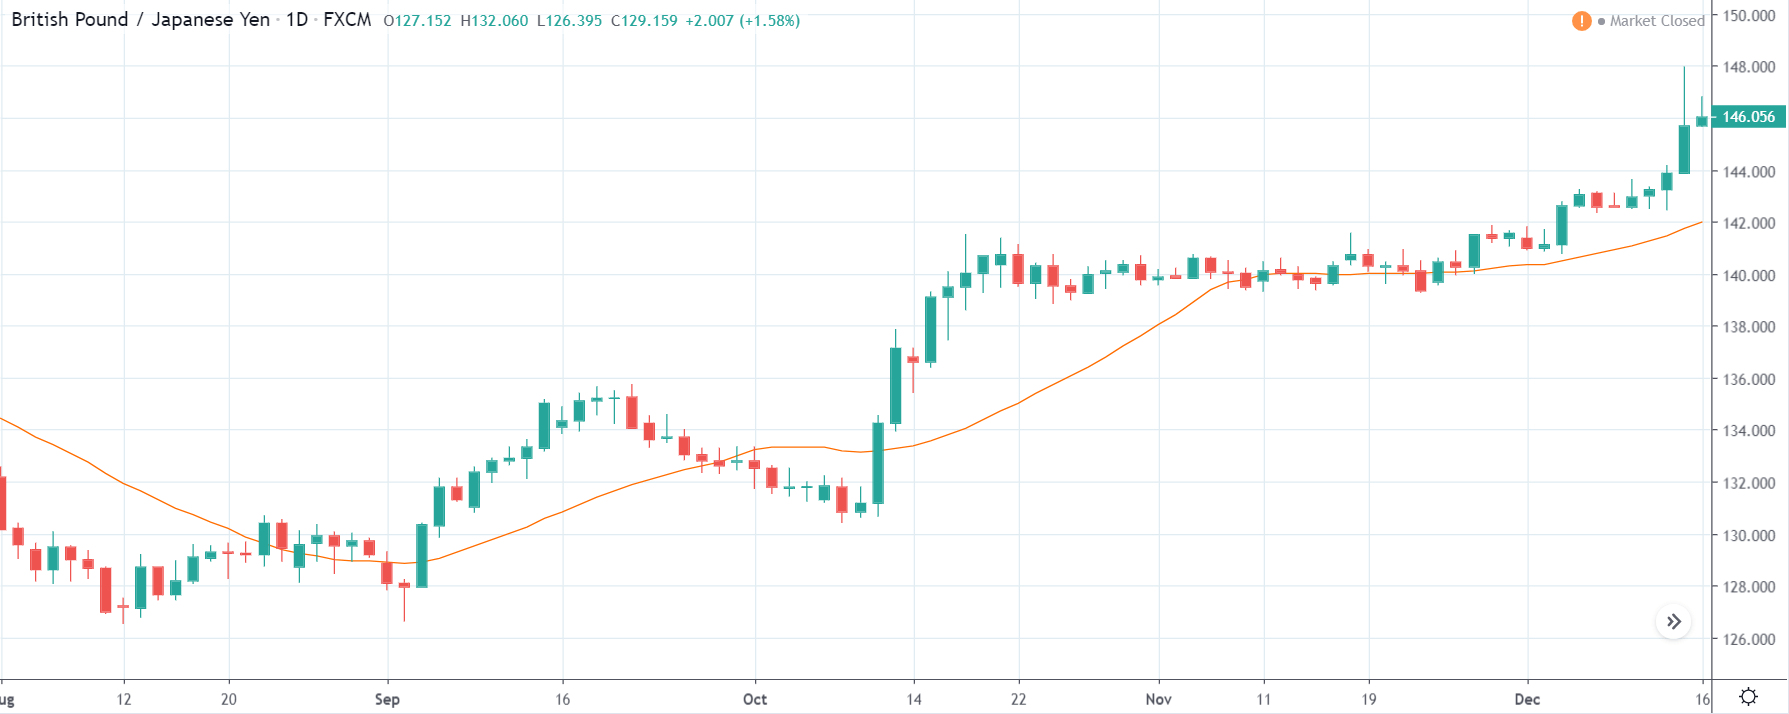
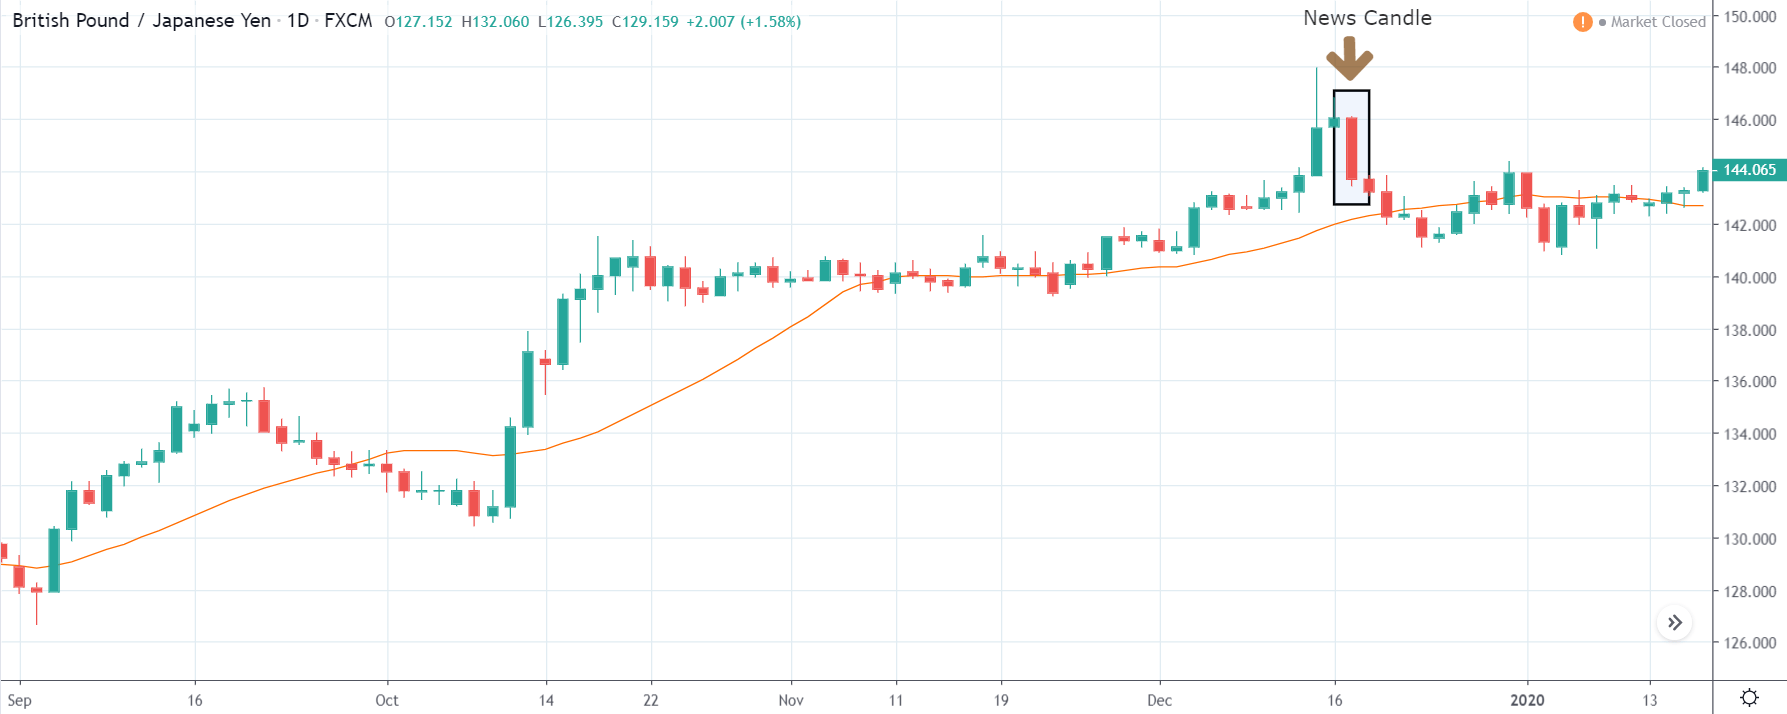
The above images represent the GBP/JPY currency pair where the chart characteristics are almost the same as that of the GBP/CAD, but with a difference that, the uptrend is more extended in this pair. When the market is trending strongly in one direction, we need to cautious while making trades in the opposite direction of the market. Here too, since we are not sure of the Credit Rating data, we cannot position ourselves on any side of the market.

After the news announcement, the British Pound falls but as much as in the above case. There is an increase in volatility on the downside but not sufficient enough to take a ‘short’ trade. Another reason behind a lesser fall in price could be the weakness of the Japanese Yen. Also, the price, even after bad news, is still above the moving average.

GBP/NZD | Before The Announcement

GBP/NZD | After The Announcement

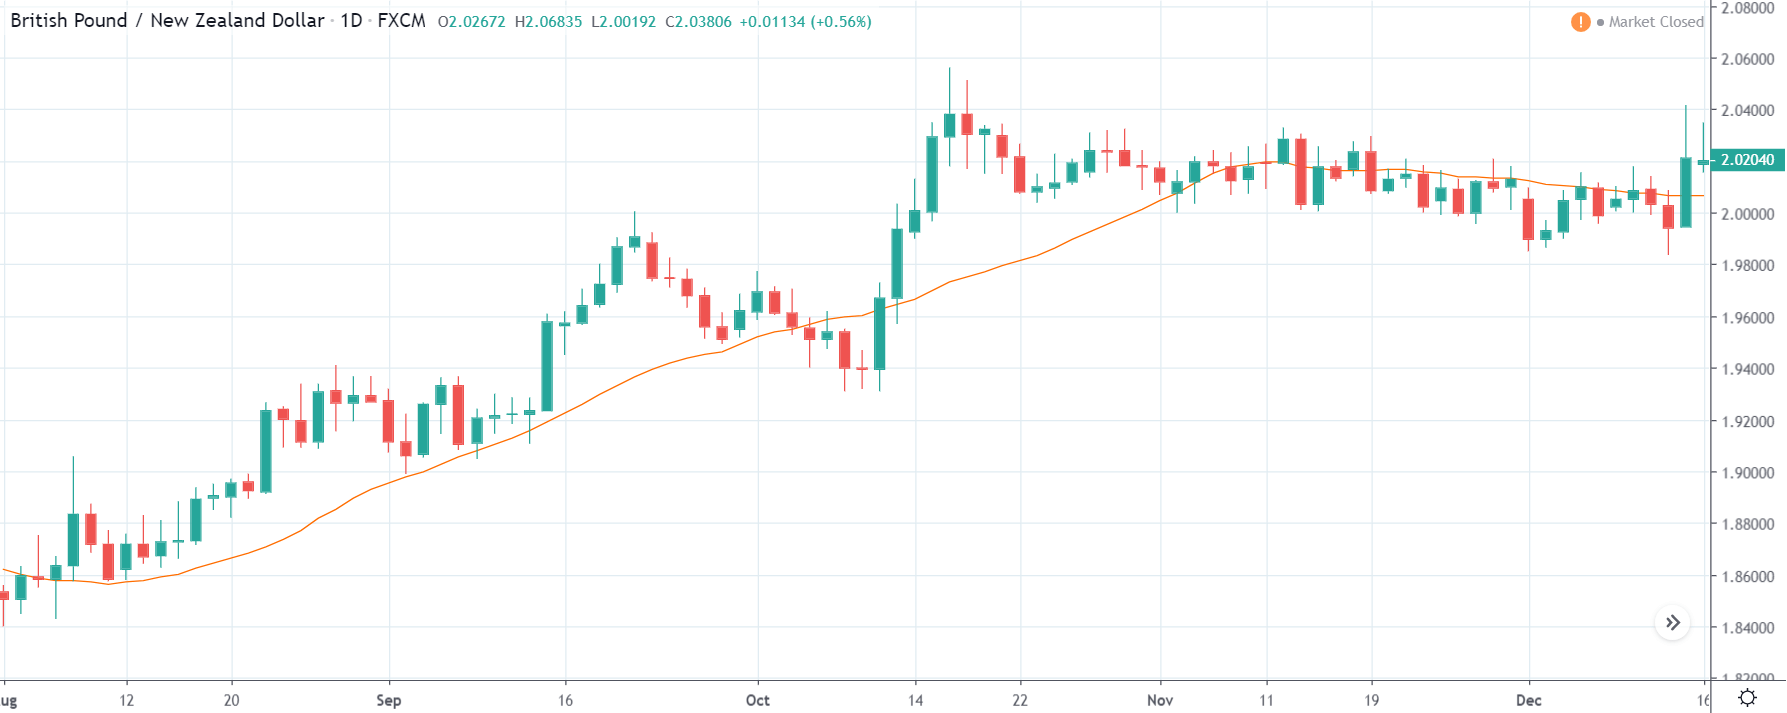
In GBP/NZD currency pair, before the Credit Ratings are declared, we can see that the market is showing signs of weakness. Since the overall trend is up, we need to wait for the news release and get a confirmation from the market. We can still trade in the ‘options’ segment of the market and profit from the increased volatility on either side after the news announcement.

After the Credit Rating data is announced by different agencies, the market falls, and volatility increases on the downside. This is a result of the negative Credit Rating given to the United Kingdom, which disappointed the market participants. Since the market was already showing weakness, this could prove to be the best pair to go ‘short’ with a much higher risk-to-reward ratio.

That’s about ‘Credit Rating’ and its relative impact on the Forex market after its news release. If you have any queries, let us know in the comments below. Cheers!

Categories
Forex Fundamental Analysis

Everything About ‘Gold Reserves’ & It’s Impact On The Forex Market

Introduction

Gold is one of the most precious metals on the planet. In the field of monetary assets and currencies, Gold is like a nuclear warhead among all weapons. Throughout history, this yellow metal has always held its place as a secure financial investment. For a certain period in the international markets, it backed the major currencies like the United States Dollar.

Even though today’s currencies are no longer backed by any metal and are free-floating fiat currencies, countries still own and purchase gold year after year in tons. This shows that it is still one of the important financial assets of many countries. Change in Gold Reserves will have an impact on the nation’s currencies. Hence the study of the same is important for fundamental analysis for traders and investors.

What are Gold Reserves?

Most of the major nations which participate in international trades through export or import maintain a certain proportion of foreign currencies to hedge their currency at times of hyperinflation or deflation to manage their exchange rate at a fixed level, thereby not incurring losses on exports or imports.

Similarly, Many countries’ Central Banks maintain specific metric tons of Gold as reserves in their nation’s vaults along with other assets. Gold deposits saved in the nation’s vaults or other nation’s vaults as their holdings are called Gold Reserves.

Why Gold Reserves?

Up until a few decades ago, the Gold was used to back up the legal tenders of many countries. Today’s world is run by Fiat currencies, which can be printed as much as required by a government as the United States did before the Vietnam war, which led to the crashing of Bretton wood’s agreement. If, in a hypothetical case, let us say the United States dollar is no longer accepted as a legal tender in the global market, then the United States cannot buy or sell goods and services using their currency. Still, they can sell their Gold in exchange for the same.

The exposure of a currency to the market trends volatility, economic crisis makes it an unsafe form of wealth, which can depreciate over time. In this regard, Gold has always proven that it can hold its ground even during a major economic crisis and continue to appreciate to match with the inflationary trends. At times of economic crisis, extreme inflation, or deflation, which results in currency depreciation of a nation, investors, and people, in general, tend to run towards Gold as a safe financial bet.

Economic Reports

The International Monetary Fund (IMF) tracks and keeps the statistics of all assets of a nation as reported by various countries, which are then used by the World Gold Council (WGC), who are responsible for keeping up the demand and supply for Gold in the global market.

The data is obtained from the Central Bank’s Balance Sheets and compiled by WGC and releases monthly. They also provide historical data about the same for various countries to compare and analyze side by side.

How can the Gold Reserves numbers used for analysis?

Gold is not an abundant metal on the planet, and its rarity, along with unique lustrous yellow radiant color and other physical properties, has always kept it in demand in the market of jewelry, trades, and particular instrument designing sectors.

Gold is seen as one of the standard forms of wealth to be passed on from one generation to another, meaning its value keeps rising with global economic growth. As economies become wealthier, the Gold price also tends to be costlier. The worth of Gold in that sense has always remained constant, i.e., a precious and expensive metal.

The Gold demand increases during times of high inflation, and because of the limited supply, the price of Gold increases against the currencies. In this sense, the countries which are a net exporter of Gold see their domestic currency worth appreciating. Countries that are importers of Gold see their currency worth falling against Gold. In this aspect, Gold is indeed still a form of currency, or we can say it is an alternate form of currency.

Nations purchase Gold from the Bullions market and store up just like an ordinary employee saves up money for future needs or as an emergency fund for a rainy day.  Major Nations increase their Gold Reserves in hundreds of tons per year as it preserves wealth better than most currencies, and also for their concern on long term economic health and growth of their nation.

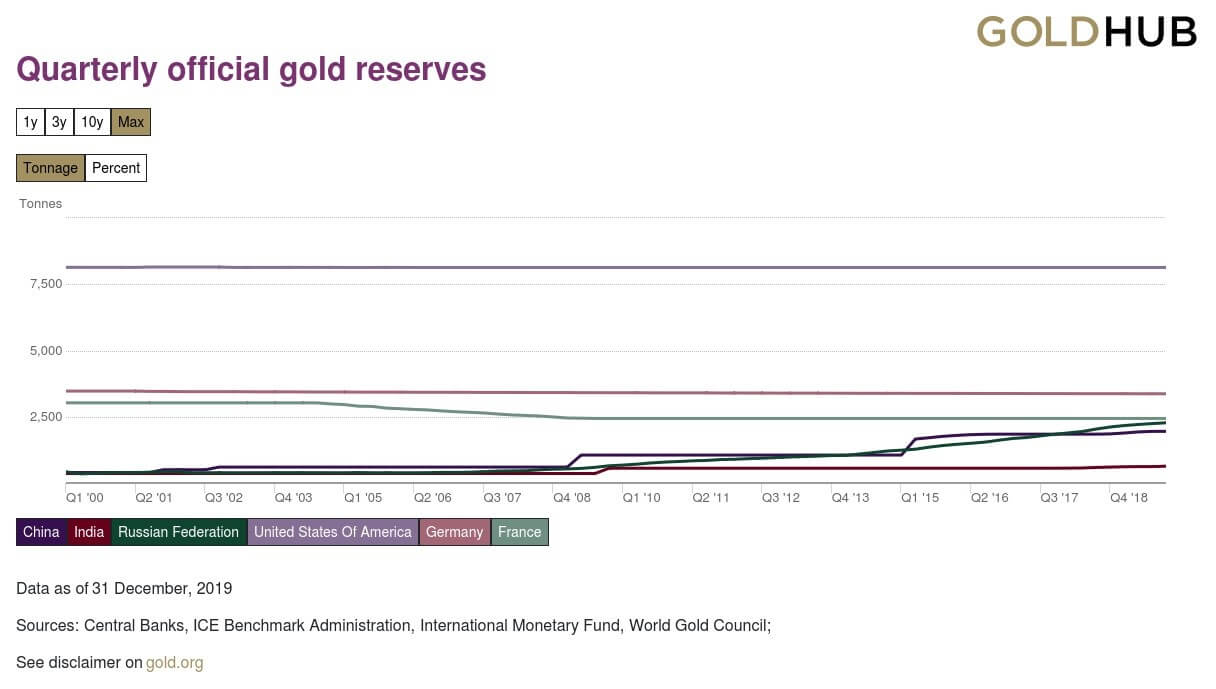
Below is Gold Reserves numbers for prominent countries having high holdings.

Above image is taken from the World Gold Council Official Website

Impact on Currency

A country with no Gold Reserves is exposed to all the risks associated with Fiat Currencies. Throughout history, there have been many currency crises where the dips have been so low that markets crashed, and governments collapsed, for instance, the Black Wednesday, which pushed the Sterling pound out of European Exchange Rate Mechanism.

Countries having substantial Gold Reserves numbers can face economic crises without market crashes, and the system collapses. As at any time, they can sell their Gold Reserves to increase their Currency worth, and let it float back again in the market against other fiat currencies.

Investors who have invested in foreign companies in that nation’s domestic currency can eliminate the fear of his returns depreciating over time or during economic crises there if the nation has sufficient Gold Reserves. Traders who Carry Trade can also be sure of their deposits not being subjected to major shocks that lead to unexpected volatility in the short run as the country will be able to recover from this through their reserves.

Gold Reserves inherently indicate a nation’s capacity to bounce back from a crisis or to never go into one in the first place. This is the reason why the United States Dollar and Euros are one of the major pairs as their Gold Reserves are in the top five amongst the world due to which the volatility in the currency is so low, making it a safe bet to trade on.

Low Gold Reserves can lose the confidence of investors, which would further depreciate the value of an already weakening currency, thereby pushing the economy further down the drain of a crisis. In Conclusion, the higher the Gold Reserves, the lesser the volatility and vice versa.

Sources of Gold Reserves Index

We can monitor the Gold Reserves changes of various nations across the globe from the WGC monthly reports, and they can be found here. Global Reserves data of different countries can also be found here. You can also go through Gold Reserves of the Federal Reserve Banks of the United States history here. We can derive the same numbers from the Central Bank’s balance sheets or the National Bureau of Economic Research.

Impact of the ‘Gold Reserves’ news release on the price chart 

Gold reserves play a major role in maintaining the economic stability of a country, and thus the government tries to own a lot of Gold. Some of the main uses of Gold include hedging against inflation and determining the value of import and export. The Gold Reserve of the country is released on a quarterly and monthly basis that shows the transactions carried out by different nations. Since the Gold Reserves held by a country is an important economic indicator, it said to have a moderate to high impact on the value of a currency.

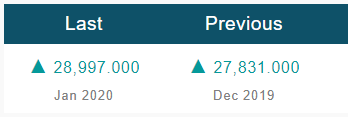
The above image shows the previous and latest Gold Reserve data of India, which is published on the 1st of every month. A higher reading than before is considered to be bullish for the currency while a lower reading is taken to be bearish. India’s Gold Reserves was reported at 28.997 USD bn in Jan 2020. This shows an increase from the previous number of 27.831 USD bn for Dec 2019. The Reserve Bank of India is the official organization that provides Gold Reserves in USD.

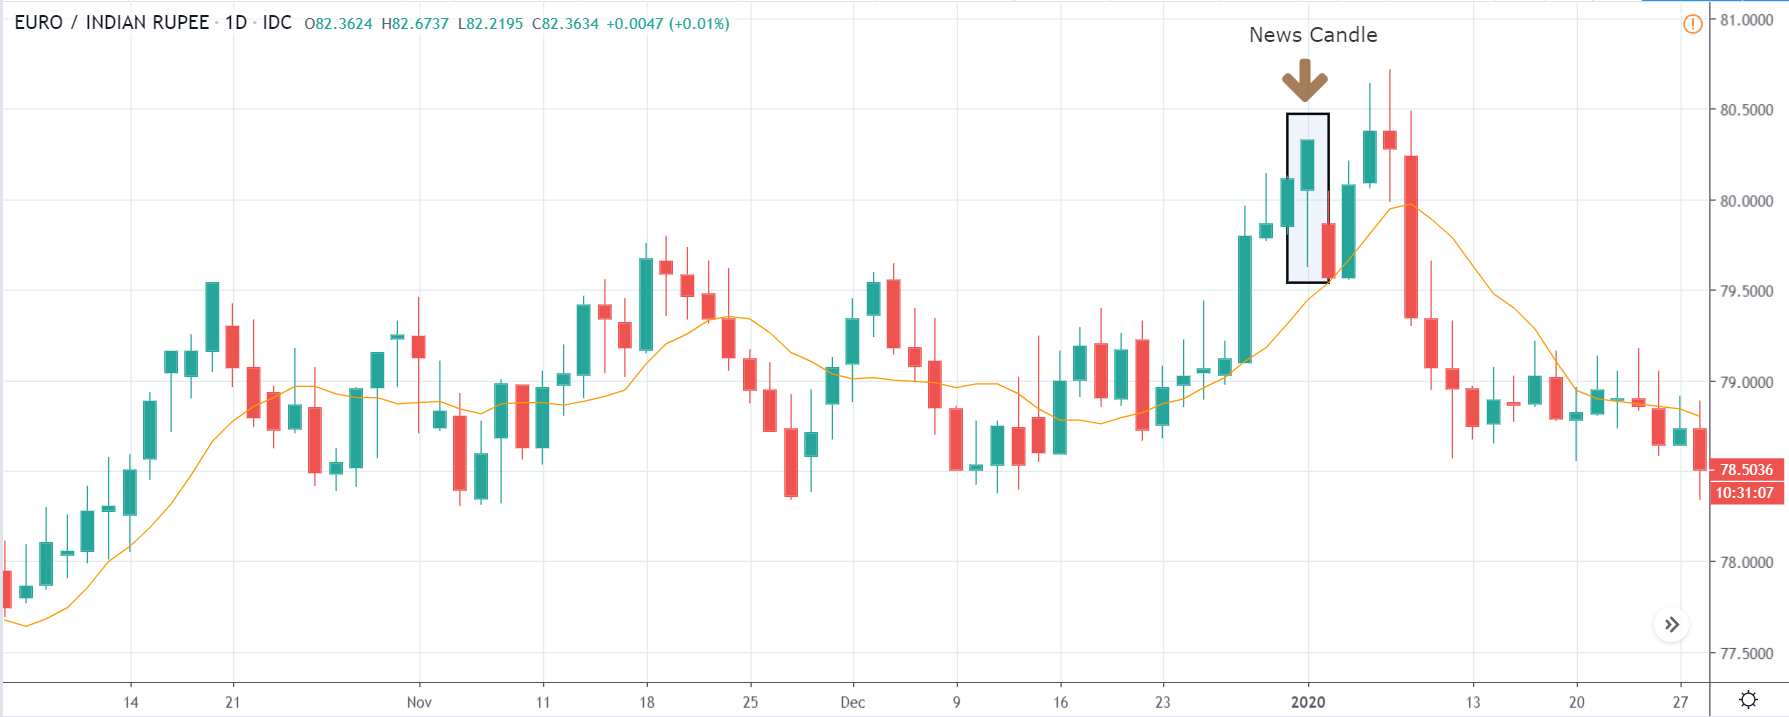
EUR/INR | Before The Announcement

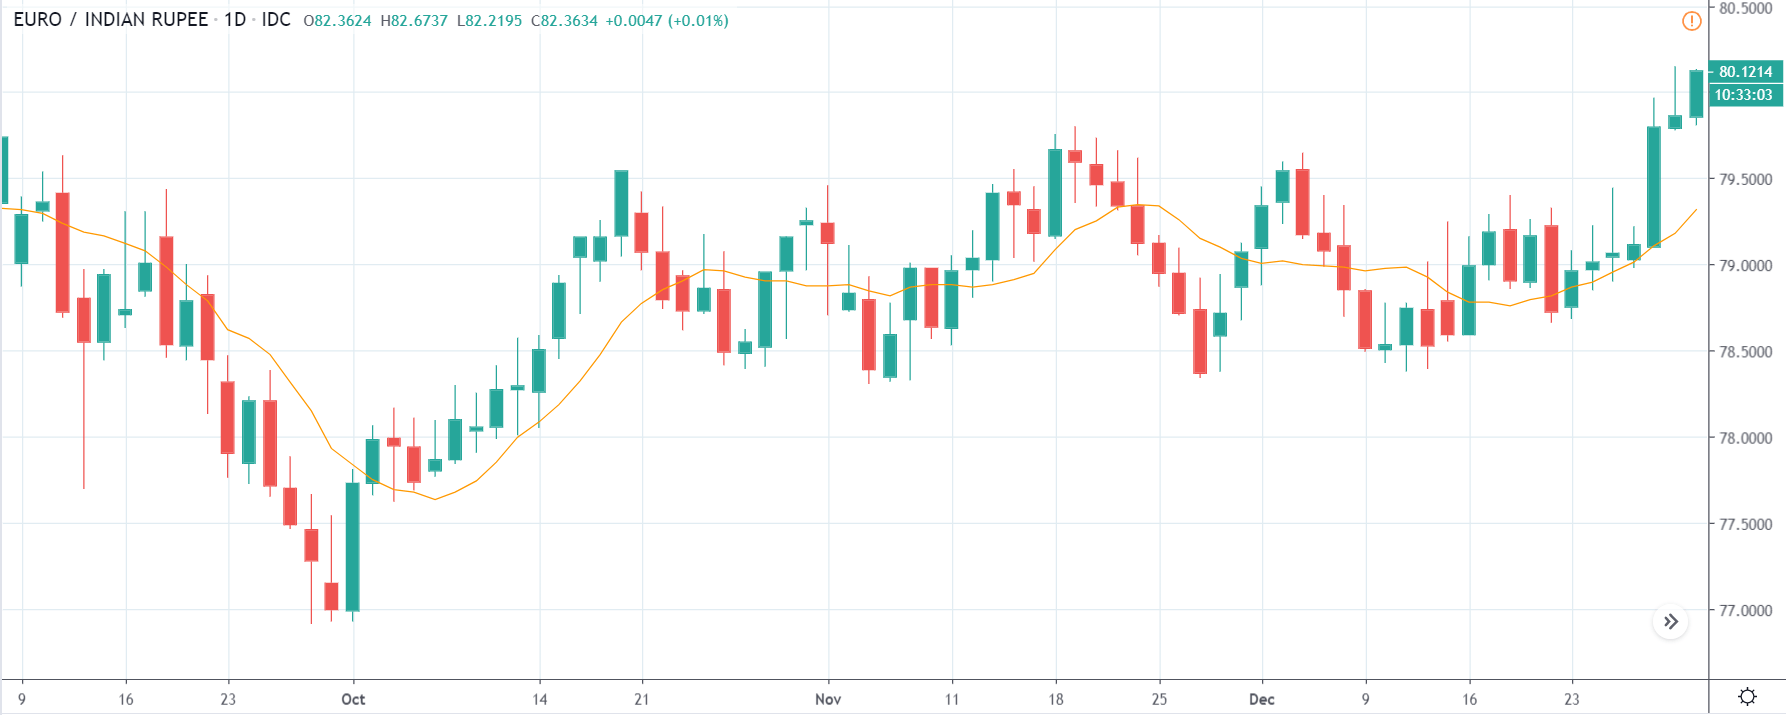
The first pair with which we will start our discussion is EUR/INR, where the above image shows a ‘daily’ time frame chart of the same. We see that the market is in a range from more than three months and currently seems like it has broken out of the range. Since we don’t have any clue of the Gold Reserves data, we cannot take a position on any side of the market. Technically, we have broken above the range, and we need a suitable retracement to join the trend.

EUR/INR | After The Announcement

As the data is released and the market gets to know that the Gold Reserves were increased than before, we see a sudden drop in prices as a result of strength in Indian Rupee. But later, the price reverses sharply, making the candle to close in green. One of the reasons could be that since the market was in a strong uptrend, it tried to make its last move up and finally collapsed later.

The volatility is seen to increase on both sides. From a ‘trade’ perspective, here’s where the technical analysis should be combined with fundamental analysis. We cannot take a short trade until the price crosses below the moving average, which is a sign of reversal.

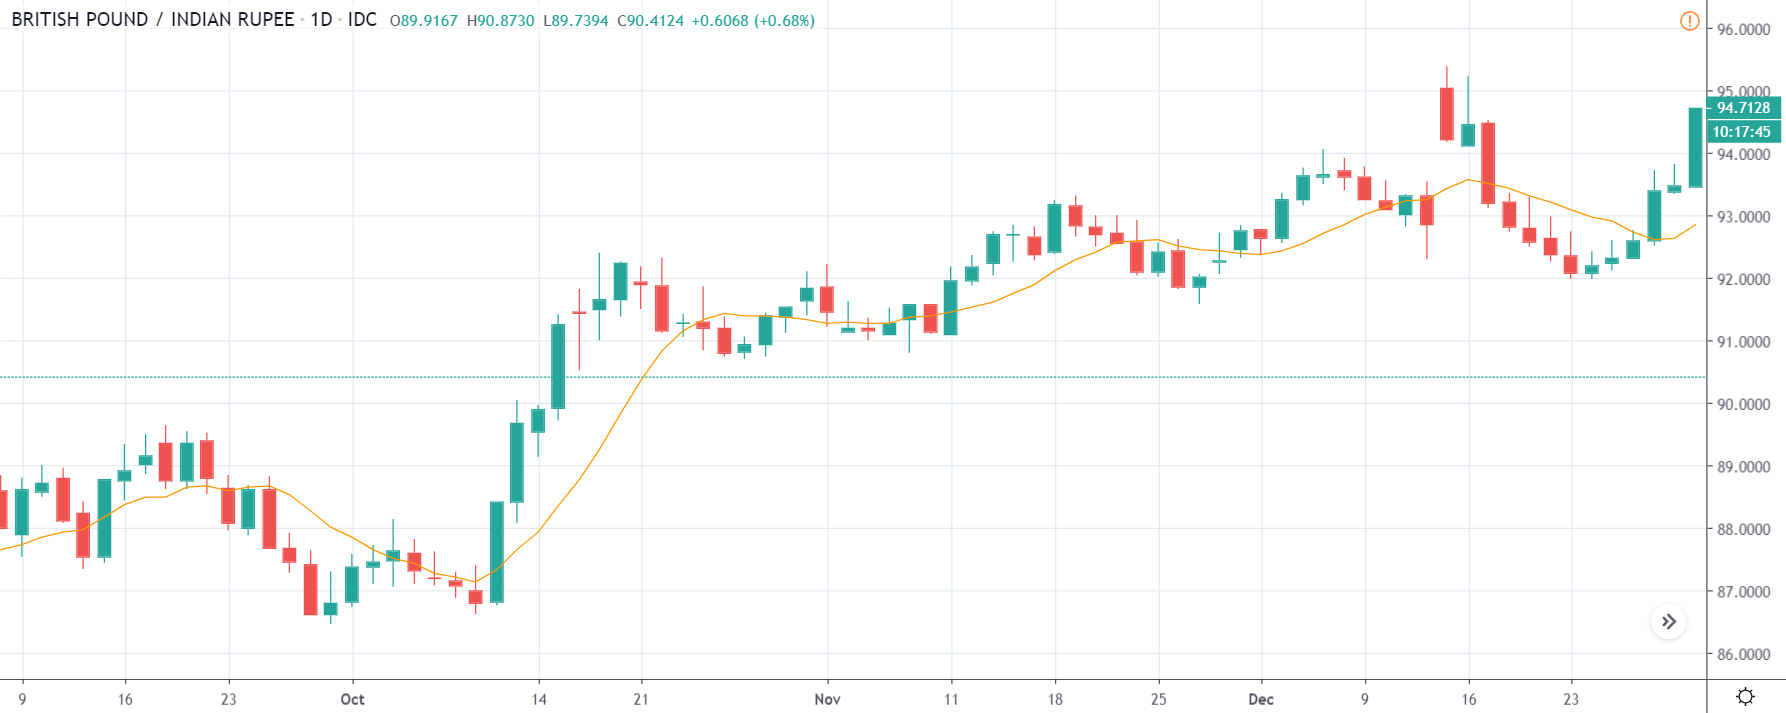
GBP/INR | Before The Announcement


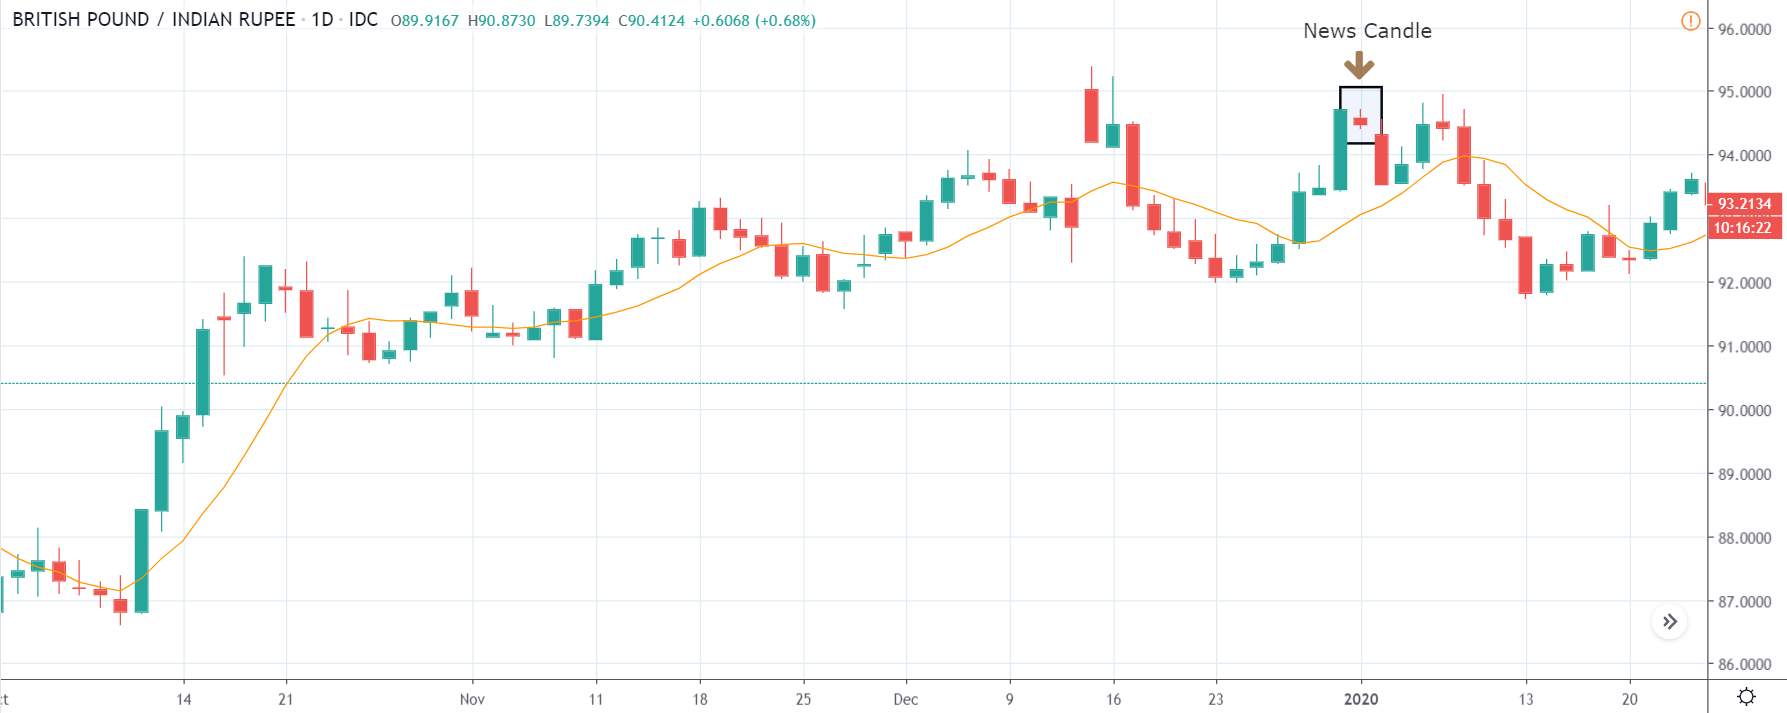
GBP/INR | After The Announcement

The above images represent the GBP/INR currency pair where we witness an extremely weak Indian Rupee, and just before the announcement, price is at the recent ‘higher high,’ which means this is the point from where the market fell. Without guessing what the Gold Reserve data might be, it is wise to wait for the news announcement and then take suitable action. However, one can still trade in ‘options’ to take advantage of high volatility when the announcement is being made.

After the news release, we see that the market drops, and the candle closes in red, which means there are high chances that traders may see the data as positive for the Indian economy and hence buy INR. Thus, as soon as the price falls below the moving average, we can go ‘short’ in the pair with a conservative target. Also, the price is in an area that could be a possible resistance.

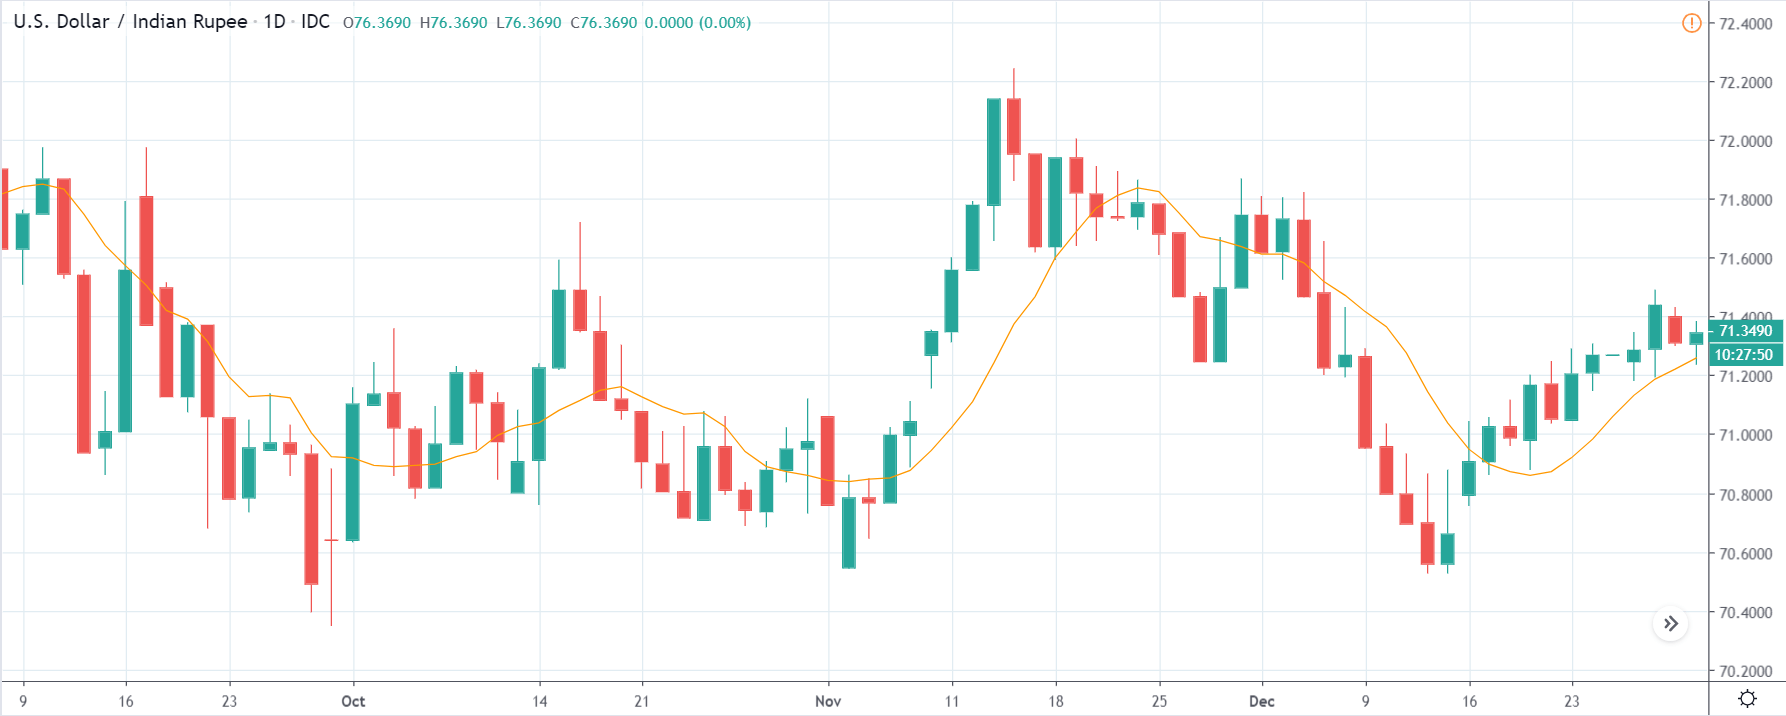
USD/INR | Before The Announcement

USD/INR | After The Announcement

In the USD/INR currency pair, before the news announcement, the market moves up after reacting from the ‘support’ area and currently is in the middle of the range. Again, we don’t find any way to trade this pair as a news announcement can cause sudden volatility on any side. The overall volatility also appears to be low in this currency pair.

After the announcement is made, we see that the price drops below as a result of an increase in Gold Reserves from the previous month. The sudden increase in volatility on the downside, making the price go below the moving average, may attract one to go ‘short’ in the pair. We can sell the currency pair, but the stop loss needs to be placed above the resistance. The risk to reward ratio of this type of trade would be around 1:1.

That’s everything about Gold Reserves and the impact of its new release on the Forex price charts. If you have any queries, please let us know in the comments below. Cheers.

Categories
Forex Fundamental Analysis

Understanding ‘Core Inflation’ & It’s Impact On The Forex Price Charts

Introduction

Core inflation is the change in the price of the goods and services that do take food and energy into account. It is referred to as ‘core’ because it represents the most accurate illustration of the underlying inflation trends. The reason for the exclusion of food and energy is due to its high volatility. They change so often that they may depict an inaccurate reading of the inflation rate. And the commodity market is the sole cause behind the volatility, as it extensively traded all day.

Why Exactly Food and Energy are Excluded

As already mentioned, Food and Energy are exempted from the calculation of core inflation because the volatility in these markets is too high. This reduces the accuracy of the core inflation rates. Food and energy are considered as the most necessary staples; that is, their demand does not change even if there is a price hike. For instance, let’s say the gas prices rise due to the rise in oil prices. But this rise will hardly affect you as you’ll still need to fill up your tank in order to drive your vehicle. Similarly, you will not become hesitant to go to the grocery store because the prices have risen.

Oil and gas are commodities that are traded on the exchange market where people can buy and sell them. The commodity traded bid on the oil prices when they suspect a fall in supply or a rise in demand. Also, the thick that war will bring down the supply of oil. With this assumption and analysis, they buy at the present price and anticipate a higher price in the future. And this is enough to pump up the oil prices in the market. And if things don’t go as per the plan, the prices fall when they sell. Hence, this creates high volatility in the market.

The food prices are dependent on the prices of gas. The food prices tend to rise along with the gas prices because transportation of the food is dependent on trucking. When the oil prices rise, the effect can be seen in the gas price a week later. And if the gas prices maintain its uptrend, the effect of it can be observed on the food prices a few weeks later.

Measuring Core Inflation

The core inflation is measured by both the Consumer Price Index (CPI) and the core Personal Consumption Expenditure Index (PCE). The PCE is the depiction of the prices of goods and services purchased by consumers in the United States. Also, since inflation determines the trend in trend in the rising prices, the PCE is a vital metric in assessing inflation. However, both PCE and CPI are considered to be very similar as both help in determining the inflation in the economy.

CPI and PCE – Which is the Preferred Measure?

It is observed that PCE tends to provide inflation rates that are less affected by the short-term price changes, which is why the Federal Reserve prefers the PCE index over the CPI. The Bureau of Economic Analysis (BEA), a division of the Department of Commerce, measures the rates by using the existing gross domestic product (GDP) data, which helps in determining the overall trend in the prices. The GDP gives the measure of the total production of goods and services. In addition, BEA takes in the monthly Retail Survey data and compares it with the consumer prices generated by the CPI. In doing so, the data irregularities are removed, which helps in providing long-term trends.

Why is Core Inflation Important?

It is important to asses core inflation because it determines the relationship between the price of the goods and services and the level of the consumer income. If there is an increase in the price of the goods and services and no proportional increase in consumer income, consumer buying power will decrease. So, we can conclude that inflation causes the value of money to depreciate compared to the prices of goods and services.

However, if the consumer income increases, but the price of the goods and services remains unchanged, consumers will theoretically have money buying power. Moreover, there will be an increase in the investment portfolio, which leads to asset inflation. And this can generate additional money for consumers to spend.

Core Inflation and its Impact on the Economy and Currency

Core inflation has both a subtle and destructive effect on economic growth. It is said to be subtle because an increase of one or two percent takes quite a while. However, this can have a positive effect at this rate as well. People purchase goods and services beforehand, knowing that price will rise in the near future. Hence, this increase in demand stimulates economic growth. And since currency depends directly on the economy, the price of the currency rises as well.

Inflation can have a negative effect on the economy, as well. That’s because people will have to spend how much ever high price on food and gas, as they are the essentials. This brings down other consumer sectors in the market because people tend to spend less here. Their businesses are less profitable now. This imbalance in the market lowers the economic output.

Reliable sources of data for Core Inflation

The core inflation rate is released by the countries’ statistics board. For most countries, it is released on a monthly basis. And the reports are in terms of percentages. Below is a list of sources of core inflation data for different countries.

EURUSDAUDGBP  For other world countries, you may access those reports here.

How does Core Inflation Affect the Price Charts?

Until now, we understood the definition of Core inflation and its impact on the economy and the currency. Here we shall see the immediate effect of the currency pair when the reports are released. For our example, we will be taking the U.S. dollar for our reference. The core inflation rate in the U.S. is released by the U.S. Bureau of labor statistics. The frequency of the announcement of data is monthly.

Below is the core inflation data released by the U.S. Bureau of labor statistics for the month of February. But, the data for it is announced in the first week of March. We can see that the core inflation has turned to be 2.4 percent, which is 0.1 percent higher than the previous month and the forecasted value. Now, let’s see how this value has affected the U.S. Dollar.

EUR/USD | Before the Announcement – (March 11, 2020 | Before 12:30 GMT)

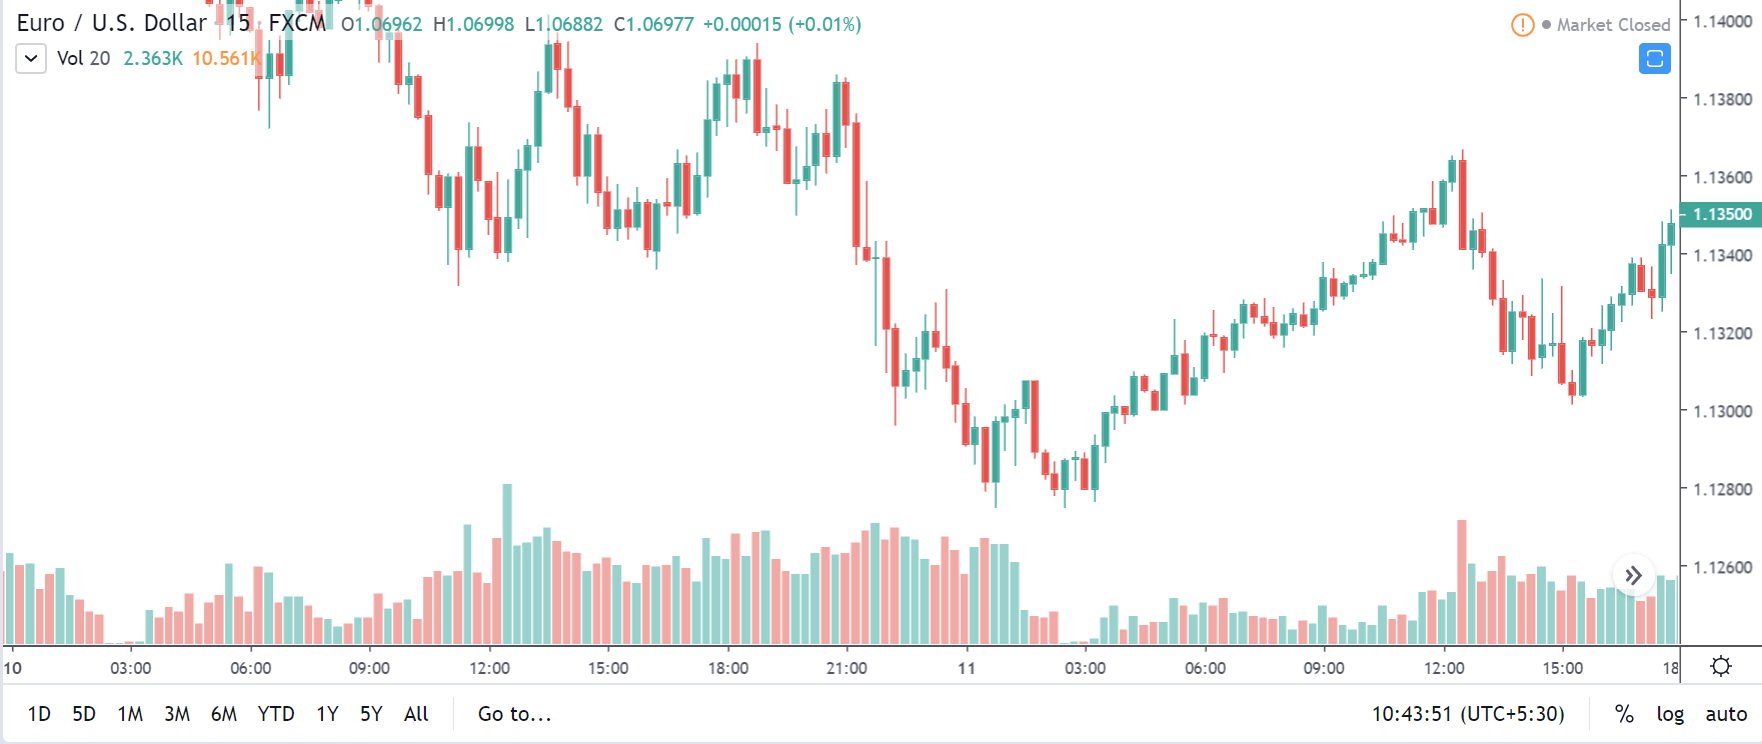
Below is the chart of the EUR/USD on the 15min timeframe just before the release of the news.

EUR/USD | After the Announcement – (March 11, 2020 | After 12:30 GMT)

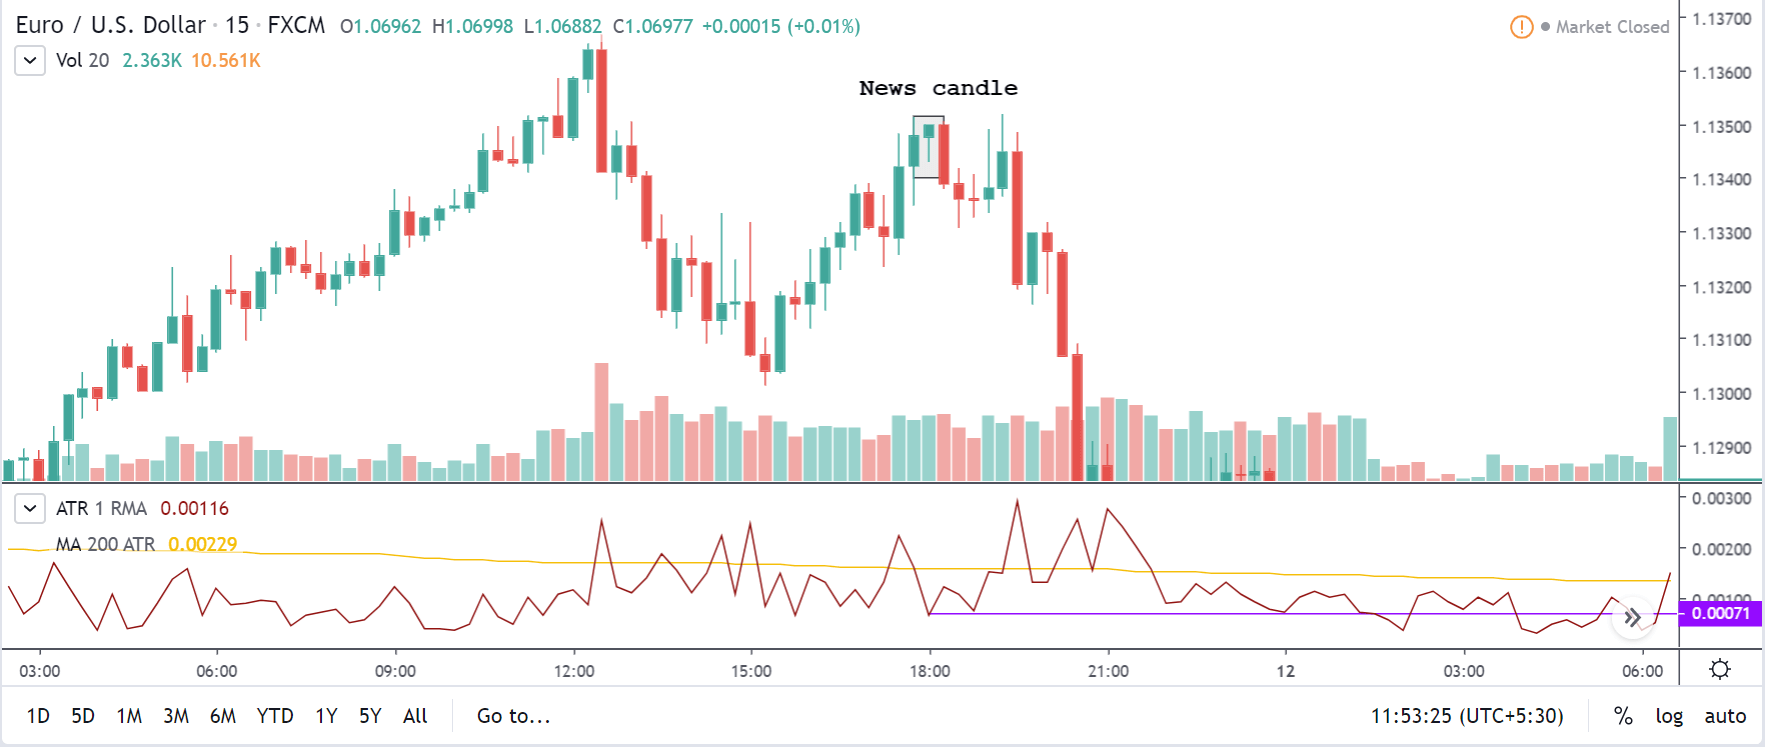
Below is the same chart of EUR/USD on the 15min timeframe after the release of the news. The news candle has been represented in the chart as well. It is evident from the chart that the news did not have any effect on the currency pair. Though the reports showed an increase in the core inflation, there was hardly any drastic pip movement in the pair. Also, the volatility was below the average, and the volume was low. With this, we can come to the conclusion that the core inflation rate did not impact the EUR/USD.

GBP/USD | Before the Announcement – (March 11, 2020 | Before 12:30 GMT)

GBP/USD | After the Announcement – (March 11, 2020 | After 12:30 GMT)

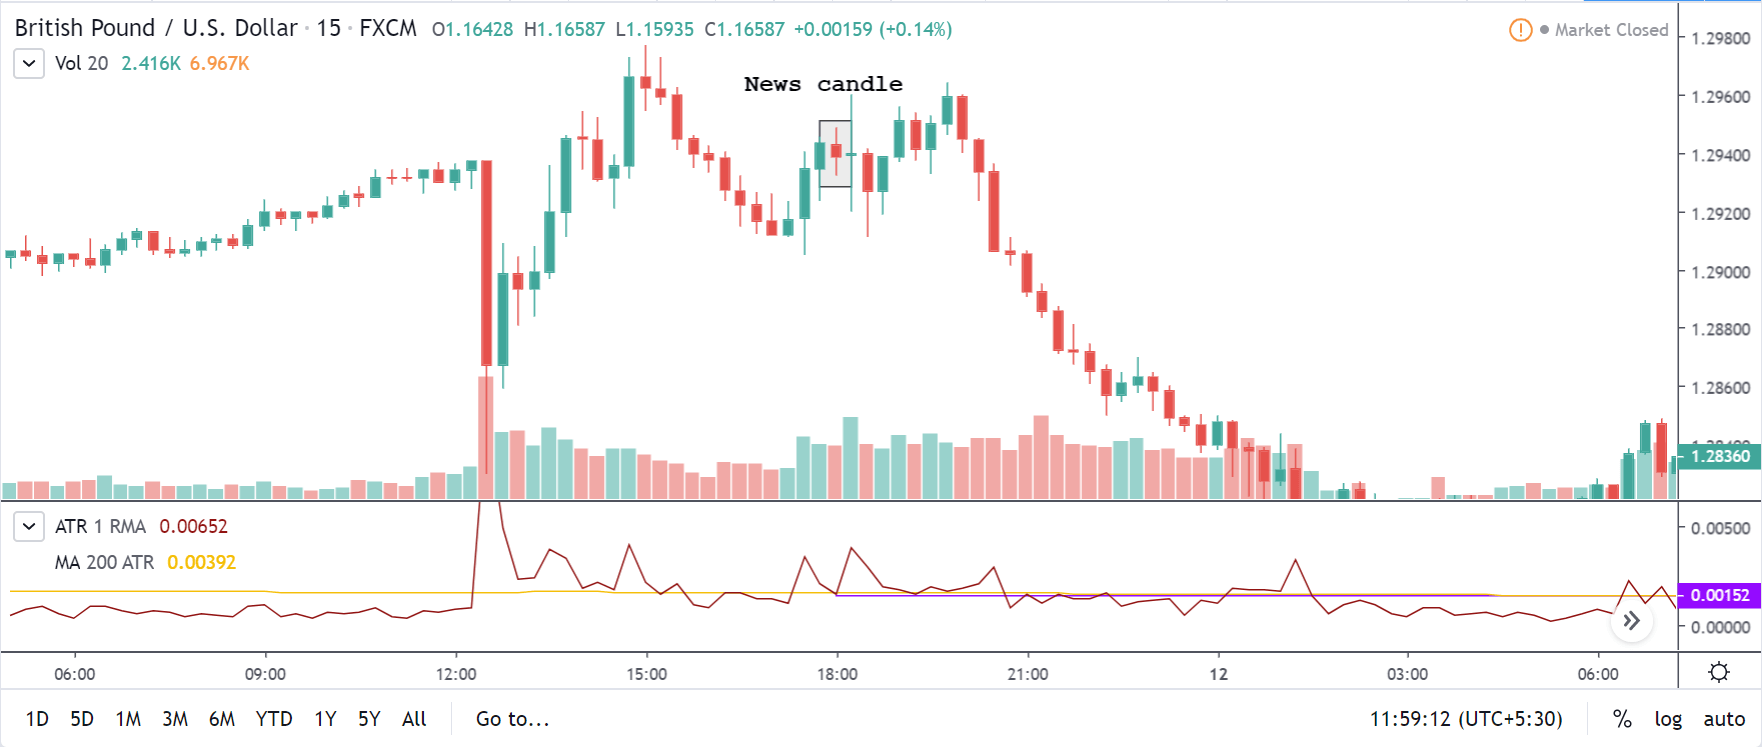
Consider the below chart of GBP/USD on the 15min timeframe. We can see that the news candle was a bearish candle. That is, the news was positive for the U.S. Dollar. However, if we were to check on the volatility of the market, the volatility when the news came out was at the average value. Seeing the volume bar corresponding to the candle, it wasn’t high as such. Hence, the core inflation did not impact the GBP/USD.

Traders who wish to trade this pair can freely go ahead with their analysis as the news has a very light impact on the USD.

USD/CAD | Before the Announcement – (March 11, 2020 | Before 12:30 GMT)

USD/CAD | After the Announcement – (March 11, 2020 | After 12:30 GMT)

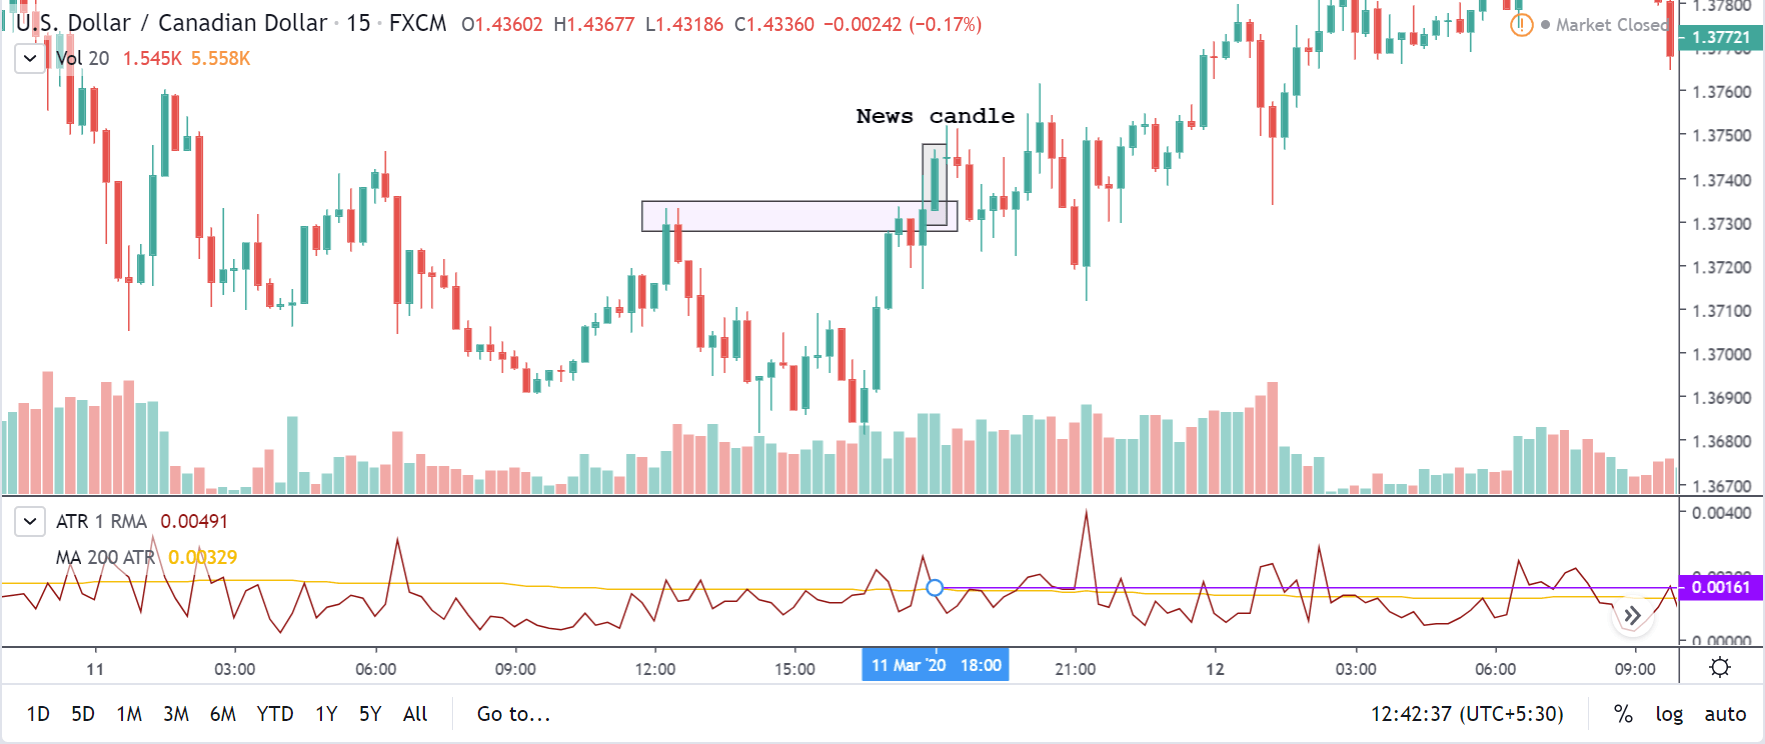
Below is the USD/CAD candlestick chart on the 15min timeframe after the release of the news. The news showed an increase in the core inflation rate by 0.1 percent. In the chart, we can see that the report turned out to be positive for the USD. In fact, the news candle actually broke the supply level and went above it. Compared to EUR/USD and GBP/USD, the core inflation had a decent impact on USD/CAD. However, the volatility was at the average mark, and the volume didn’t really spike up.

Conclusion

Core inflation is an economic indicator that measures the inflation of an economy without considering food and energy. This is because of the high volatility in the food and energy market. The core inflation rates are usually taken from the CPI or the PCE. This is an important indicator as it determines the relationship between the price of goods and services and consumer income.

It also gives an idea of the current economy of a nation. However, when it comes to its effect on the currency, there is not much impact on it. So, conservative traders can trade the markets without fearing the release of the news, as there is no drastic rise in the volatility of the markets.

Categories
Forex Daily Topic Forex Economic Indicators

What Moves the Forex Markets?

Analyzing the Forex Market

There are three ways to interpret the Forex markets: Fundamental Analysis, Technical Analysis, and Sentiment Analysis. But the markets move for just one reason: Supply and demand.
Supply and demand changes slowly or fast, depending on the current economic events, but that change is due to the Sentiment or beliefs of the major operators about what they think are imbalances of the market. That happens when institutional traders believe the current price is not a fair price, and it is due to change in the near or far future. The best strategies combine the tree methods to make the trading decisions, but a trader must always keep in mind the fundamental forces that move the Forex markets.

Fundamental Analysis

Fundamental Analysis deals with the economic and political events and situations that change supply and demand. Among the most important indicators are economic Growth Rates, Inflation, Interest Rates, Government Debt and Spending, Gross Domestic Product, and Unemployment. Fundamental Analysis combines all this information to determine the possible sentiment of the market participants and ultimately forecast the future performance of an asset.

Supply and Demand

Currencies’ prices change primarily driven by supply and demand. If the supply is larger than the demand, the price drops, and if the opposite happens, it goes up. We, as traders, cannot determine if the imbalance of the supply-demand forces is due to hedging, speculation, or monetary conversion. For example, the US dollar moved with strength from 1998 to 2001 when the Internet as the NASDAQ boom drove international investors to participate in the US financial markets in search of high returns. Investors had to buy dollars and sell their local currency, so the Dollar gained strength. At the end of 2001, the political climate changed after the 9/11 event, the stock market fell hard, and the FED started to cut interest rates. Therefore, stock investors moved their capital elsewhere, so they sold the Dollar, and its price dropped.

Capital Flows and Trade Flows

The flows of capital and trade are two major factors in the balance of payments. These two factors quantify the amount of demand for a currency. Common sense tells us that a balance of zero is needed for a currency to hold its value.
A negative number in the balance of payments will indicate that capital is leaving the domestic economy more rapidly than it is entering. Under these circumstances, the currency should move down. The opposite should happen if the balance of payments is positive.
An example of this is the Japanese Yen. Despite the fact of negative interest rates, the Japanese yen has managed to trade mostly moved by its high trade surplus; thus, this currency tends to increase in value. The Japanese government uses a negative interest rate policy and increases the money supply (by printing new money), counteract the inflows of currency coming from the export business to hold the currency’s value to a level not endangering its export business.

The capital flows show a measure of the net amount of currency bought and sold due to capital investments. A positive figure implies that the inflows originated from international investors entering the country exceded those bought by domestic investors abroad.

Physical Flows

Physical flows are originated by foreign investments, directly purchasing real estate, manufacturing facilities, and acquisitions of local firms. These operations require that foreign investors buy dollars and sell their local currency.
Physical flows data are essential, as they show the underlying changes in the physical investment activity. A change in the local laws encouraging foreign investments would boost Physical inflows. That happened in China when it relaxed the laws for foreign investment due to its entry into the World Trade organization in 2001.

Portfolio Inflows

Portfolio inflows measure the capital inflows in the equity and fixed-income markets.

Equity Markets

The Internet and computer technology enabled a greater easy to move fast and easily capitals from one market to another one in the search for profit maximization. A rally in the stock market can be an opportunity for any investor no matter where he lives. If the equity market rises, the money will flow in and drive the local currency up. If it moves down, investors would quit and move their money away.

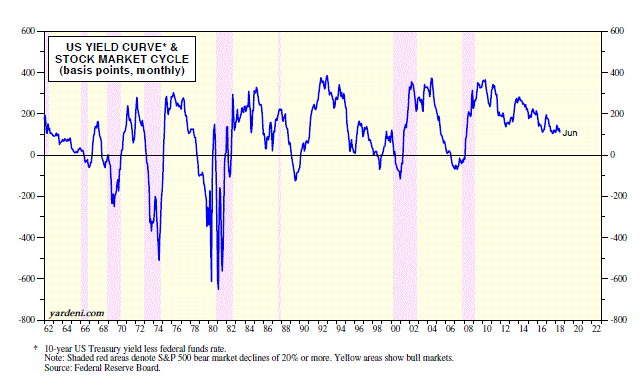
Fig 1 – US Yields versus Stock Market Cycles

(source: http://estrategiastendencias.blogspot.com/)

The attraction of the equity markets compared to fixed-income markets ( bonds and monetary investments) is growing since the early 90ies. For example, the foreign transactions of US government bods dropped from 10-1 to 2-1.
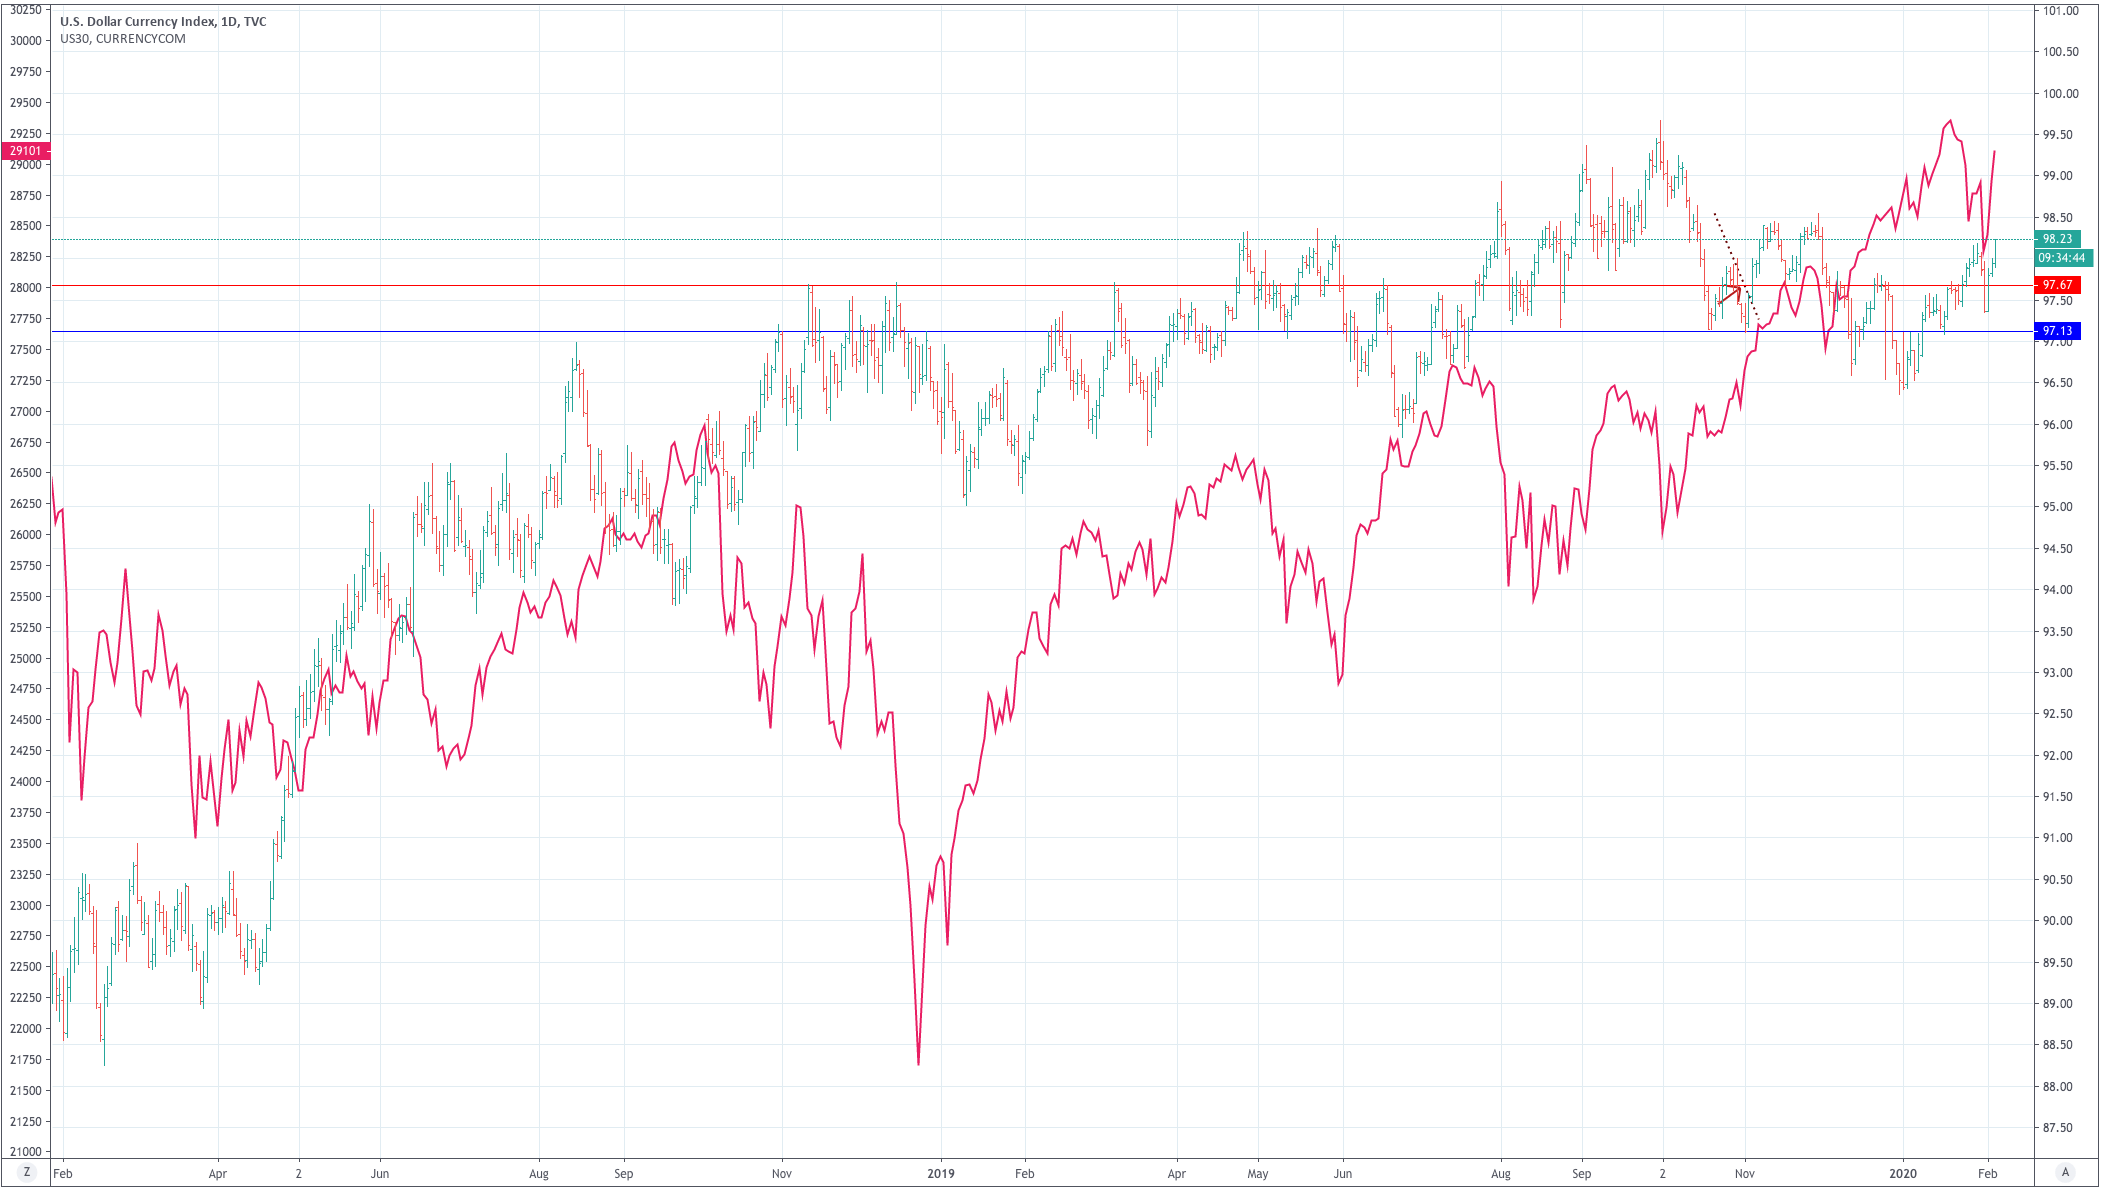
That can also be verified when we see that the Dow Jones has over 80 percent correlation with the US Dollar Index.

Fig 2 – US Dollar Index and the DOW-30 correlation  (Created using Tradingview)

Fixed Income Markets

Fixed income markets start being appealing in times of global uncertainty due to the perceived safe-haven nature of this type of investment. As a result, countries offering the best returns in fixed income products are more appealing and attract foreign money, which would need to be converted to the country’s money, boosting the demand for this particular currency.
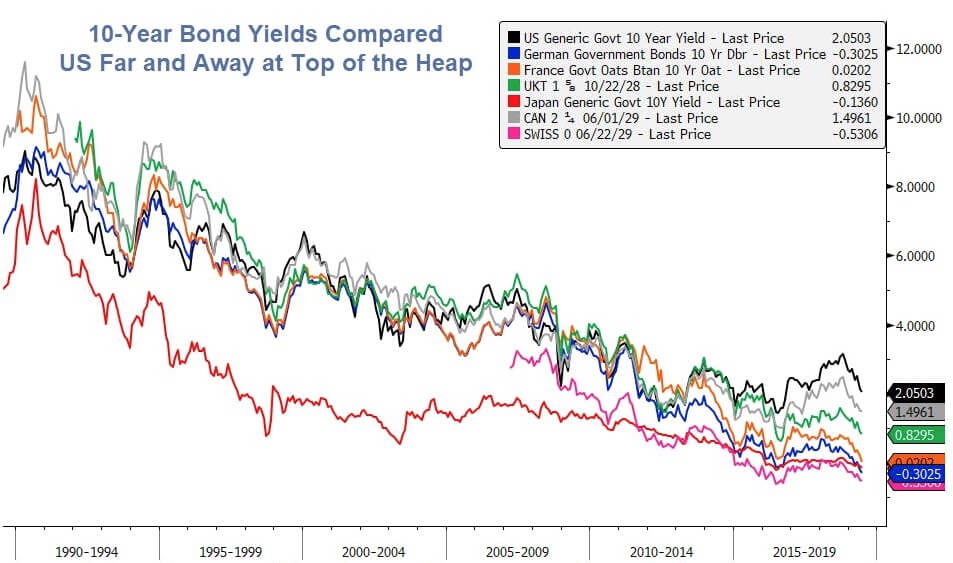
A useful metric to analyze fixed-income flows is the short and long-term yields of the different government bonds. For example, comparing the 10-year US Treasury note yield against the yields on foreign bonds. The reason is that investors tend to move their money to countries offering the highest-yields. Thus, for instance, a rise in yields would signify a boost in the inflow of fixed-income capital, which would push the currency up.
Aside from the US Treasury notes, the Euribor futures or the futures on the Interbank Rate is a good gauge for the expected interest rate in the Eurozone.

Fig 3 – 10-year note yield curves on Industrialized Countries

(from https://talkmarkets.com/)

Trade Flows

Trade flows are needed for import and export transactions. The Trade flows figure is a measure of the country’s trade balance. Countries that are net exporters will show a net surplus. Also, they will experience a rise in the value of their currencies as the result of the exchange transactions, when exporting companies trade the foreign currency for local money, as the local currency is bought more than sold.
Net importer countries will show a negative figure in its trad flow metric, and, since its currency is more often sold than bought will experience a push to the downside.

Economic Surprises

It seems logical that changes in any of the discussed flows would affect the involved currency pair. Traders, though, should focus on economic surprises. That is, data releases that are considerably different from the consensus forecasts. An unexpected figure would shatter the market and likely produce a long-term trend change. The trader should not trade the event itself, but use it to forecast future price trends and plan his short-term trading strategies with the long-term figure in mind.


Reference: Day Trading and Swing Trading the Currency Market, Kathy Lien


Categories
Forex Videos

Forex Fundamental & Economic Indicators Part 2 – How Institutional Traders Read Into News

Fundamental Analysis – Economic Indicators – Part 2

Professional traders plan ahead, and so should you too. Whether you are an institutional trader with a long-term view you or an intraday retail Forex trader looking to scalp a few pics here and there. It is absolutely necessary that you plan in advance by looking at your economic calendar in order that you do not inadvertently trade at times of potential increased volatility.

Example A


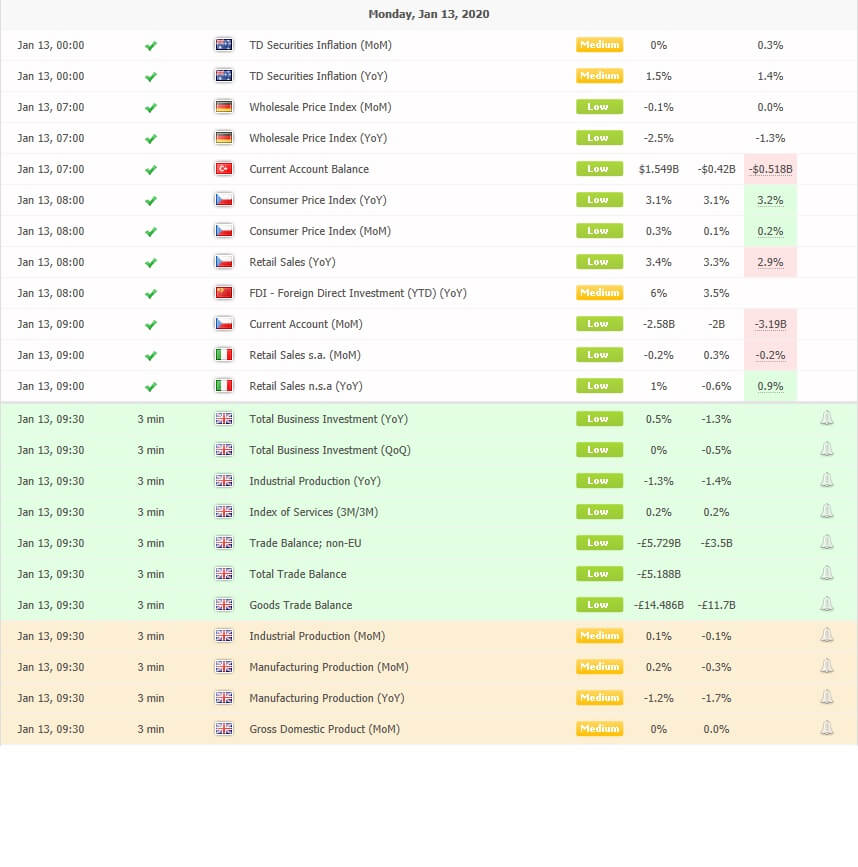
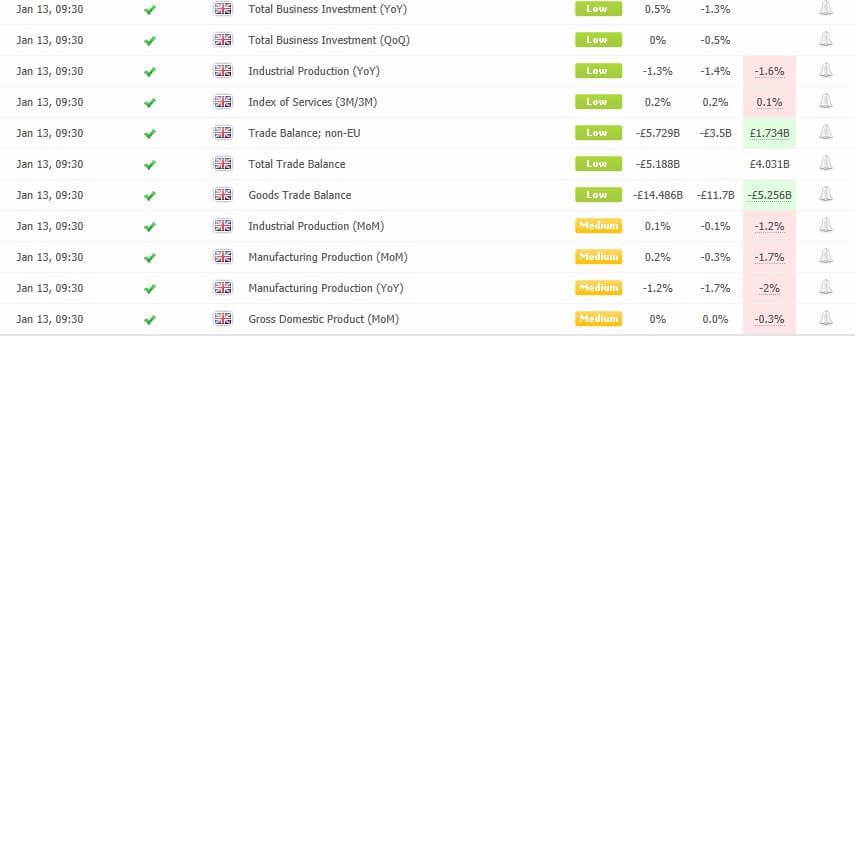
In example A, on Monday 13th January 2020, we can see from our economic calendar that there is a slew of data pertaining to the British economy, which due to be released into the market at 9:30 a.m. GMT. The data is considered to be low to medium in importance and covers things such as total business investment year on year, the trade balance and industrial production month on month, which is of medium important and gross domestic product, month on month, which is also of medium importance.

Example B


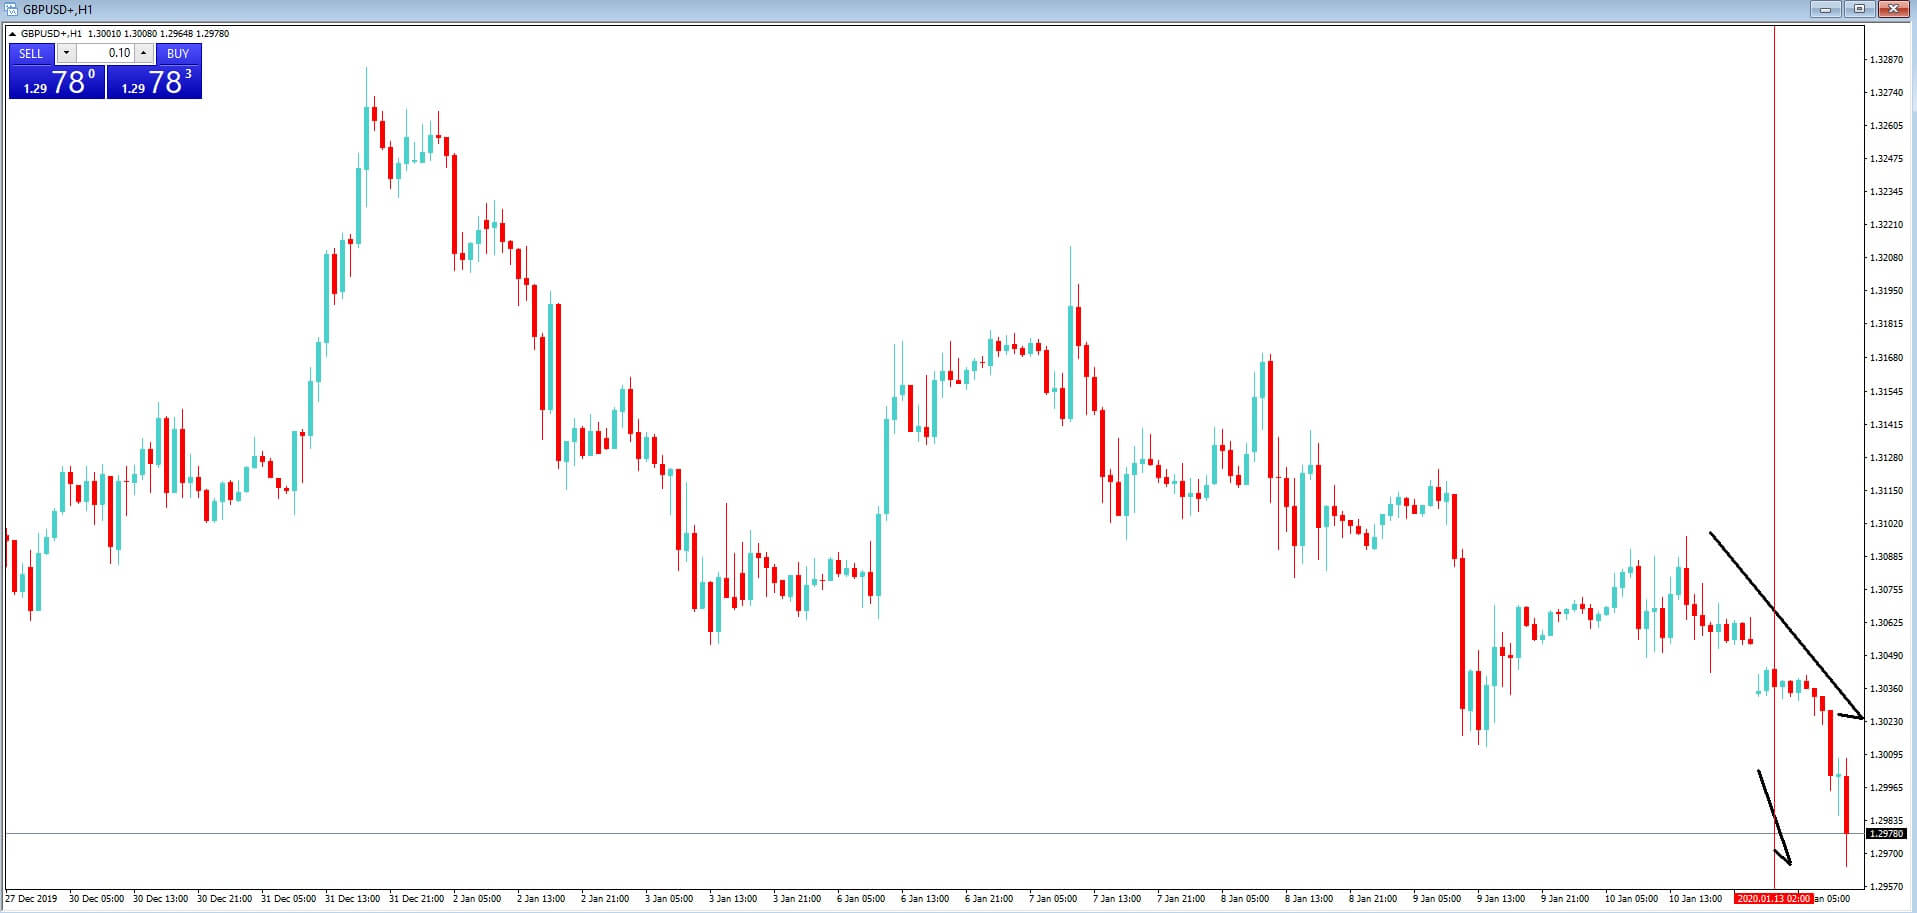
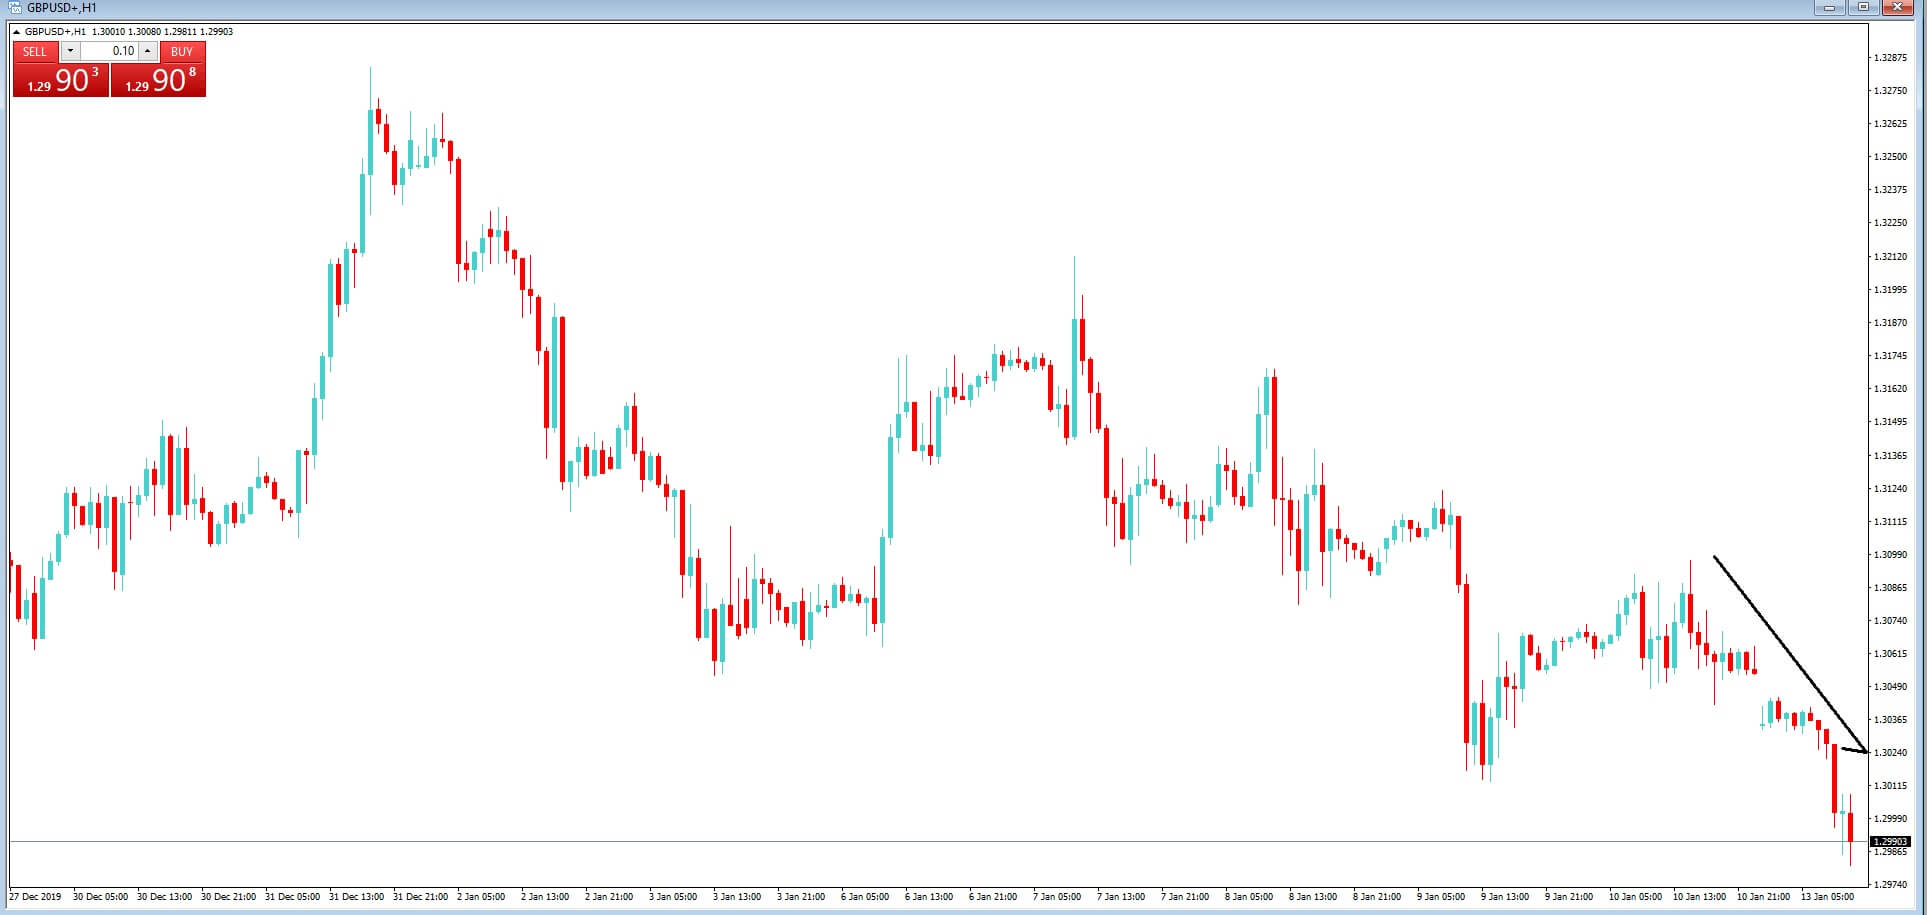
In example B, which is a 1-hour chart of the GBPUSD pair, we can see that there has been a sell-off in the pair in the run-up to these figures being released. This is somewhat due to the fact that in the last few days, the Bank of England has been quite dovish regarding future growth for the British economy this year, plus strong hints that they may reduce interest rates by a half a point by the end of the year. Therefore traders are on the back foot while expecting that the British economy will continue to slow down and they will be sensitive to any data releases that point too to a weakening in the economy, which will provide further ammunition for policymakers in the Bank of England to reduce interest rates in the United Kingdom.

Example C


In example C, of our economic calendar, just a moment after the data has been released, we can see that the figures across the board are largely worse than expected, with the most important figure; which is the gross domestic product – month-on-month – showing a worse than expected decline of – 0.3%.

Example D


In example D, we have returned to our 1-hour chart of the GBPUSD, and we can see that there was a further spike lower in the pair post announcement of the economic data release.
However, we often find in the forex market, that institutional traders will have anticipated that the market data may have been worse than expected. And in some circumstances, even though the economic data release is bad for the economy, it might be perceived by traders as not being as bad as expected.
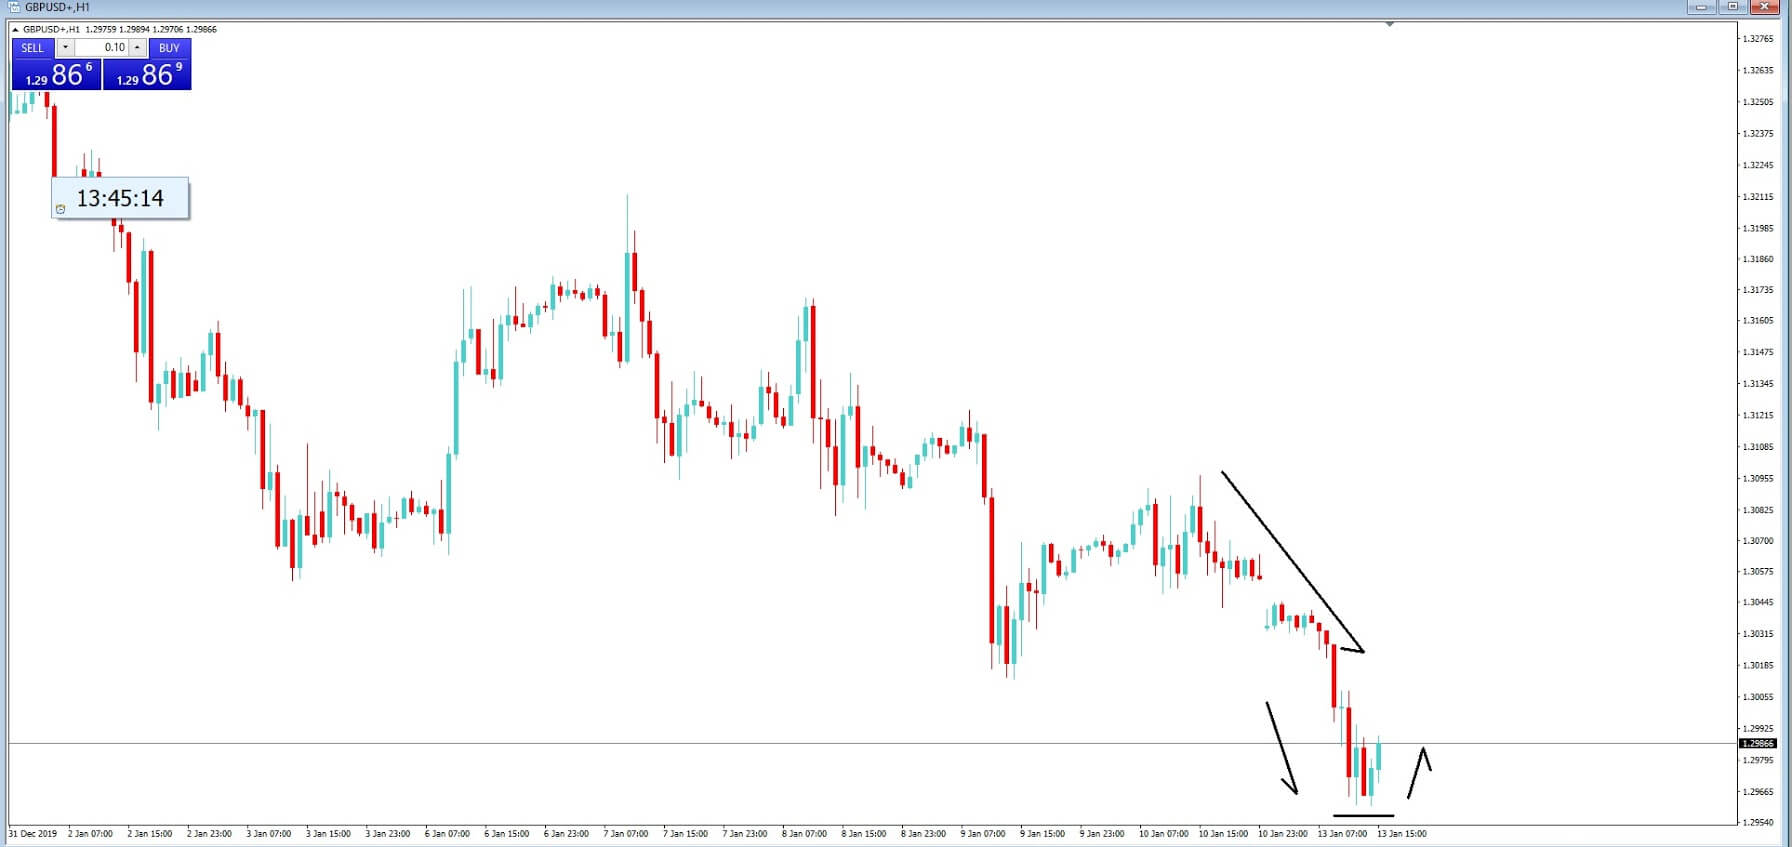
If we stick with this example for one moment, we can see that the overall trend has been to the downside with this pair. Therefore, new traders should be on their guard, because the pair may have bottomed out, even though there was bad data, and set for a reversal in price action. And this is one of the dangers when it comes to trading around economic data releases.

Example E


In example E, we return just 4 hours later to our hourly chart of the GBPUSD pair, and we can see that indeed price action had bottomed out because traders had anticipated that all the bad news was already in the price, and they decided to buy the pair.

In part 3, we will be looking at different types of economic indicators and their importance to the financial markets.

Categories
Forex Economic Indicators

Let’s Understand The ‘Current Account’ Economic Indicator

Current Account vs. Capital Account

The Current Account and Capital Account make up the two components of the Balance of Payments in international trade. The Capital Account represents the changes in asset value through investments, loans, banking balances, and real property value and is less immediate and more invisible than the current account.

The Current Account

The Current Account is a record of a country’s transactions with the rest of the world. It records the net trade in goods and services, the net earnings on cross-border investments, and the net transfer of payments over a defined period of time. The ratio of the current account balance to the Gross Domestic Product provides the trader with an indication of the country’s level of international competitiveness in world markets.

What makes up the Current Account?

Trade balance: which is the difference between the total value of exports of goods and services and the total value of imports of goods and services.

The net factor income: being the difference between the return on investment generated by citizens abroad and payments made to foreign investors domestically and,

Net cash transfers: where all these elements are measured in the local currency.

What affects the current account balance

The current account of a nation is influenced by numerous factors from its trade policies, exchange rates, international competitiveness, foreign exchange reserves, inflation rate, and other factors. The trade balance, which is the result of exports minus imports, is generally the most significant determining factor of the current account surplus or deficit.

When a country’s current account balance is positive, the country is considered a net lender to the rest of the world, and this is also known as incurring a surplus. When a country’s current account balance is in the negative, known as running a deficit, the country is a net borrower from the rest of the world.

A Current Account Deficit

A Current Account Deficit occurs when a country spends more on what it imports than what it receives on goods and services it exports. This term should not be confused with a trade deficit, which happens when a country’s imports exceed its exports.

When a country is experiencing a strong economic expansion, import volumes may surge as a result. However, if a country’s exports are unable to grow at the same rate, the current account deficit will widen. During a recession, the current account deficit will shrink if the imports decline and exports increase to countries with stronger economies.

Influence on the currency

The currency exchange rate has a huge impact on the trade balance, and as a result, on the current account. A currency that is overvalued leads to imports being cheaper and thus making exports less competitive and widening the current account deficit.  An undervalued currency can boost exports and make imports more expensive, thus increasing the current account surplus.  Countries with a chronic current account deficit will be subjected to investor scrutiny during these periods of heightened uncertainty.  This situation creates volatility in the markets as precious foreign exchange reserves are depleted to support the domestic currency. The forex reserve depletion, in combination with a deteriorating trade balance, puts further pressure on the currency in question. This leads countries to take stringent measures to support the currency, such as raising interest rates and curbing currency outflows.


The Data

The Organisation for Economic Co-operation and Development (OECD) was founded in 1961 “[…] to promote policies that will improve the economic and social well-being of people around the world” (Source: OECD) and is comprised of 34 countries. The OECD publishes quarterly reports comparing figures on the balance of payments and international trade of its 34 members.

Here you can get detailed information on the 34 listed countries Current Account Balance https://data.oecd.org/chart/5NMc