Categories
Forex Options

FX Options Market Combined Volume Expiries for 18 May 2020

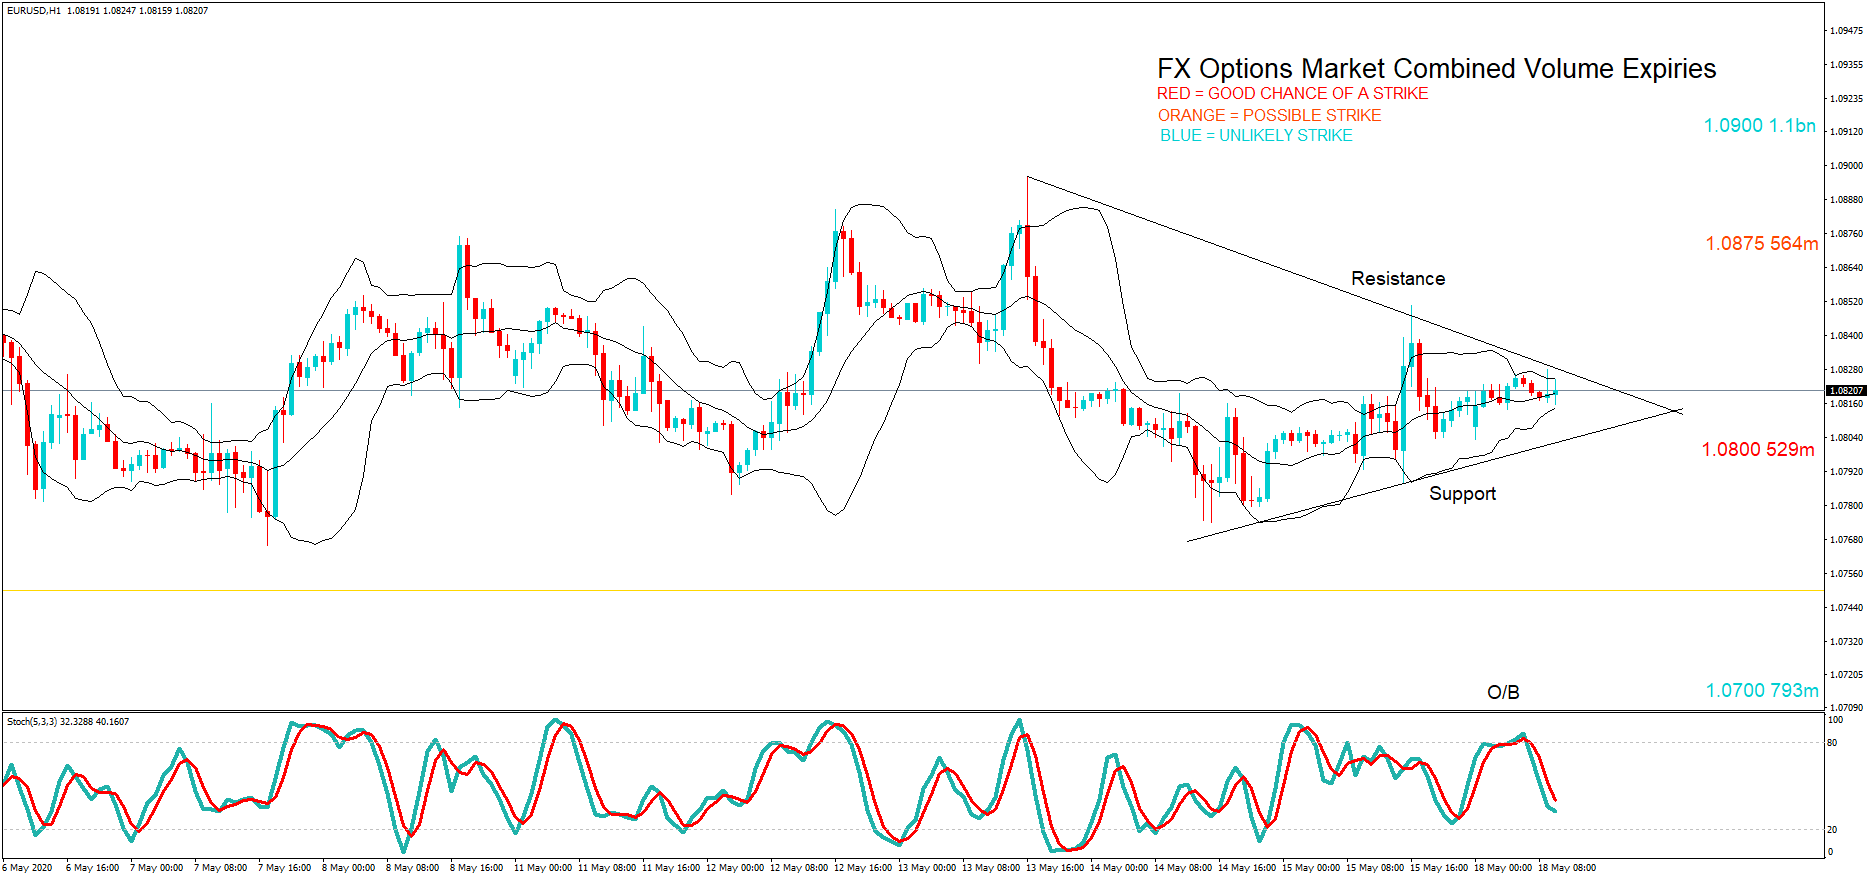
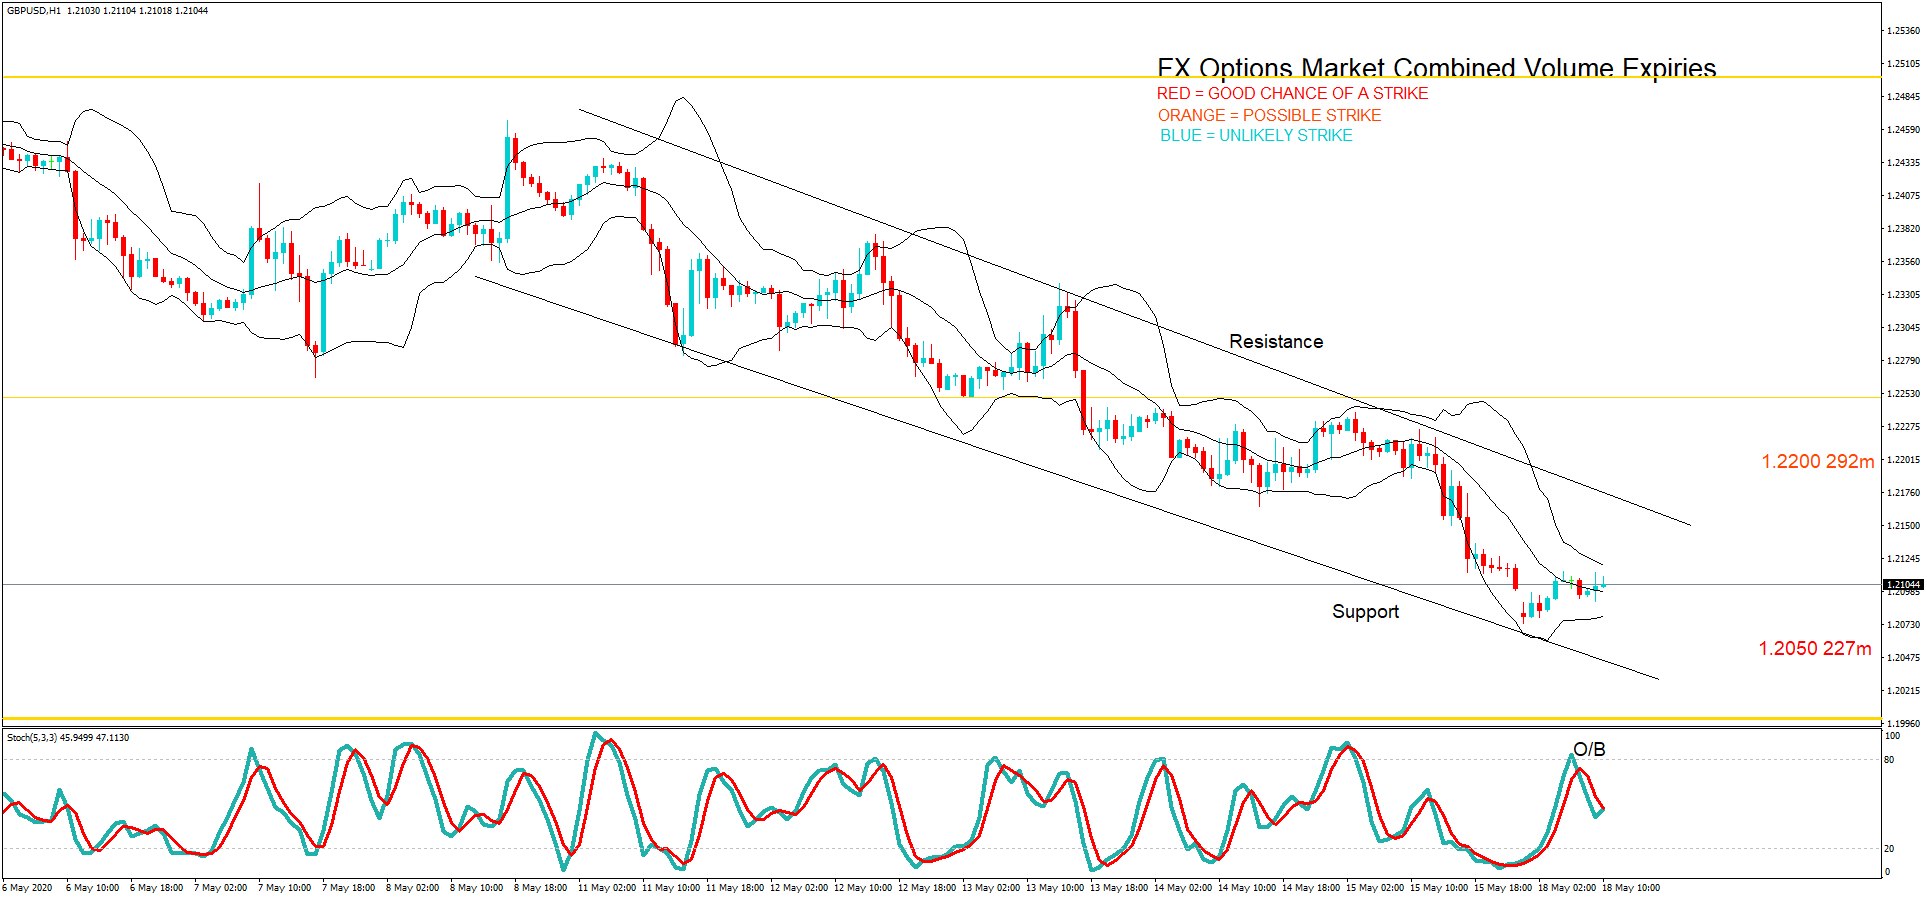
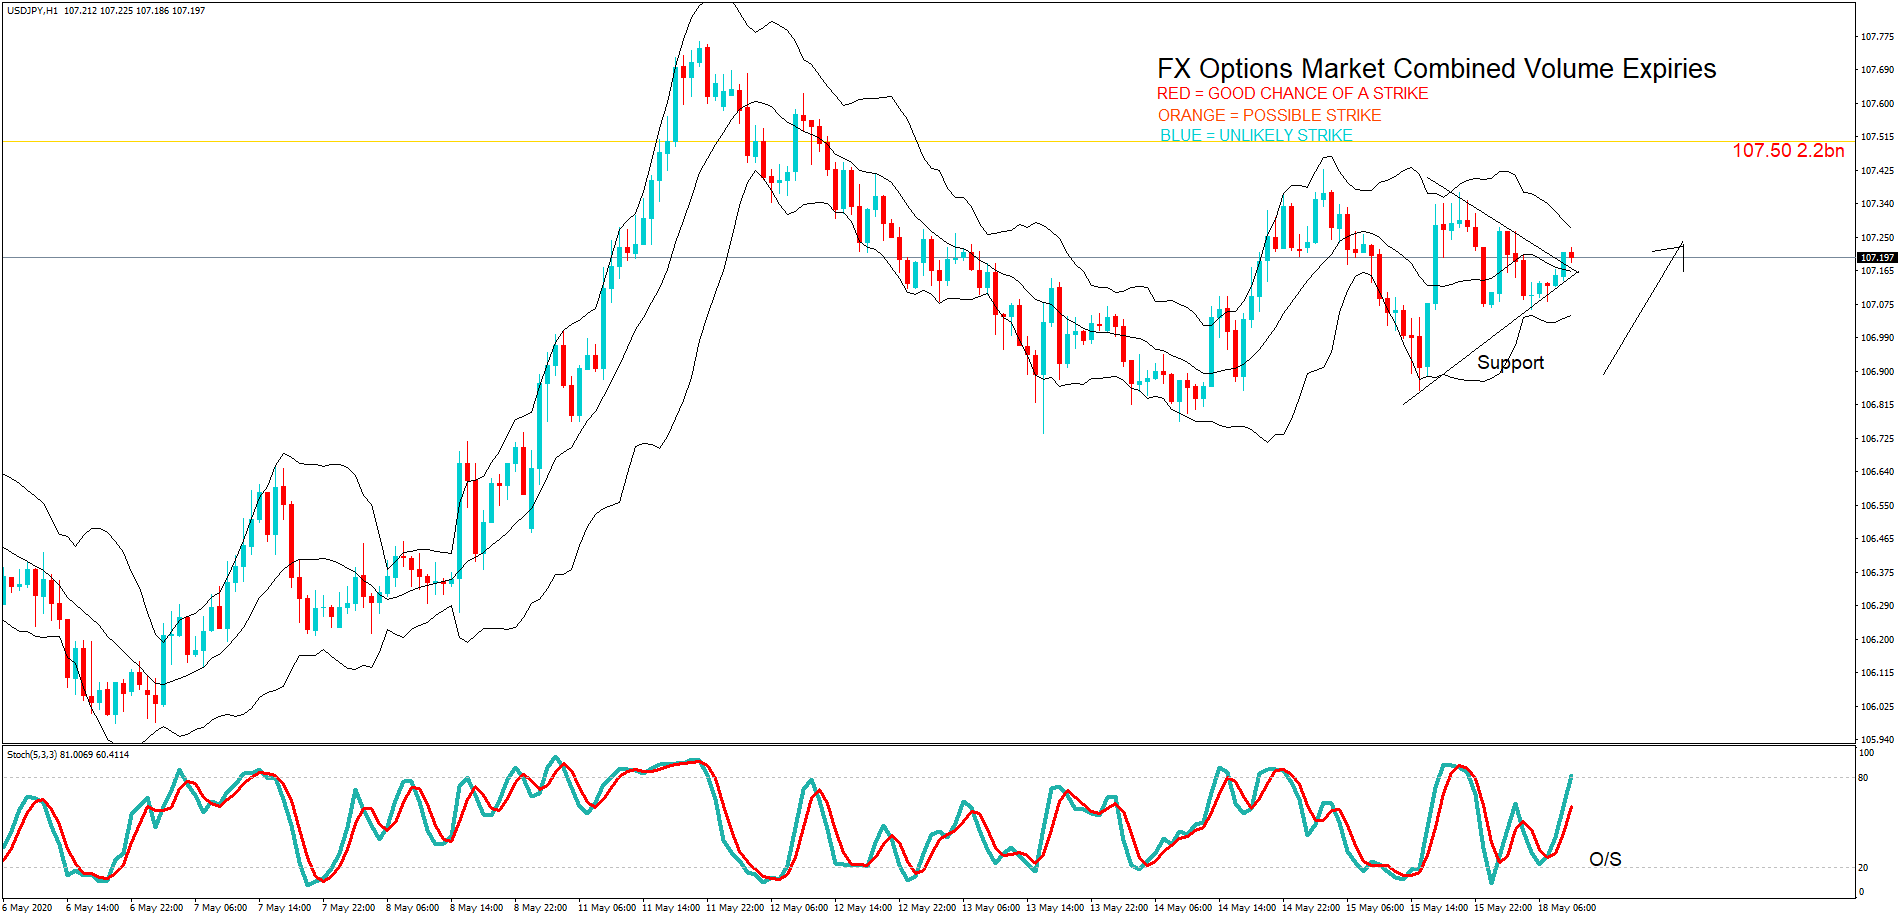
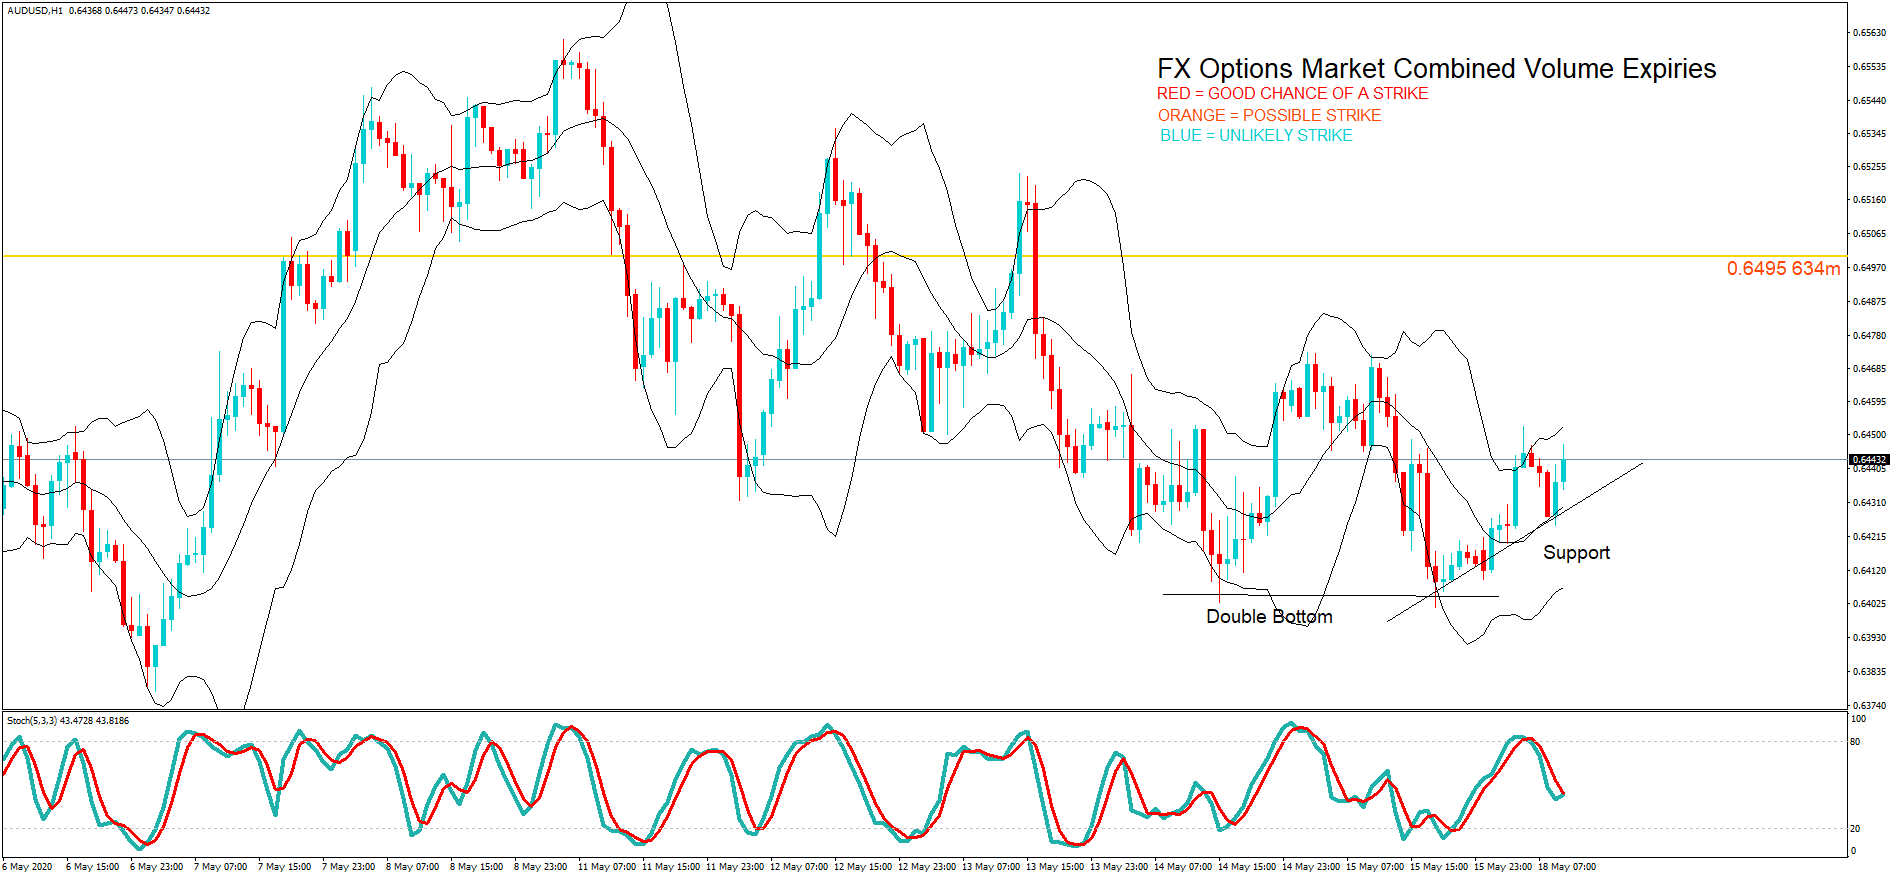
Thank you for visiting the Forex Academy FX Options market combined volume expiries section. Each day, where available, we will bring you notable maturities in FX Options of amounts of $100 million-plus, and where these large combined maturities at specified currency exchange rates often have a magnetic effect on price action, especially in the hours leading to their maturities, which happens daily at 10.00 AM Eastern time. This is because the big institutional players hedge their positions accordingly. Each option expiry should be considered ‘in-play’ with a good chance of a strike if labelled in red, still in play and a possible strike if labelled in orange and ‘out of play’ and an unlikely strike if labelled in blue, with regard to the likelihood of price action meeting the strike price at maturity.

…………………………………………………………………………………………………………………..

FX Options Market Combined Volume Expiries due at 10:00 Eastern Time, via DTCC, can be found below.

EUR/USD: EUR amounts

  • 1.0700 793m
  • 1.0800 529m
  • 1.0875 564m
  • 1.0900 1.1bn

– GBP/USD: GBP amounts

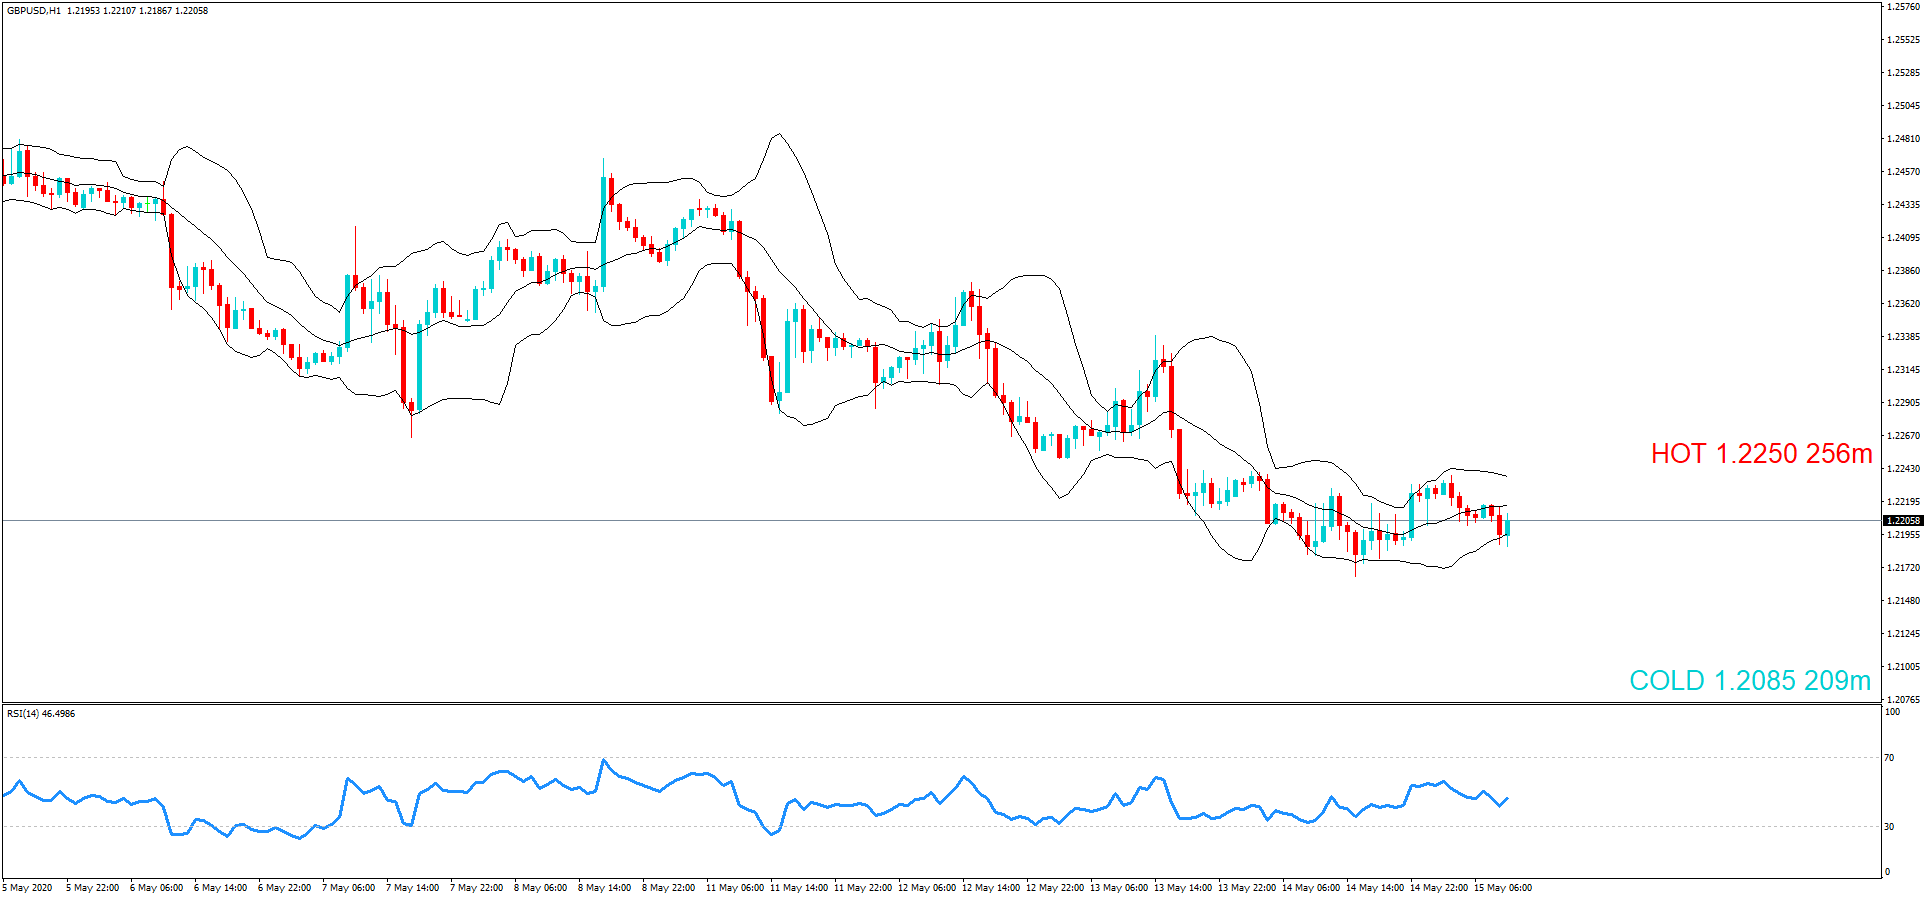
  • 1.2050 227m
  • 1.2200 292m

– USD/JPY: USD amounts

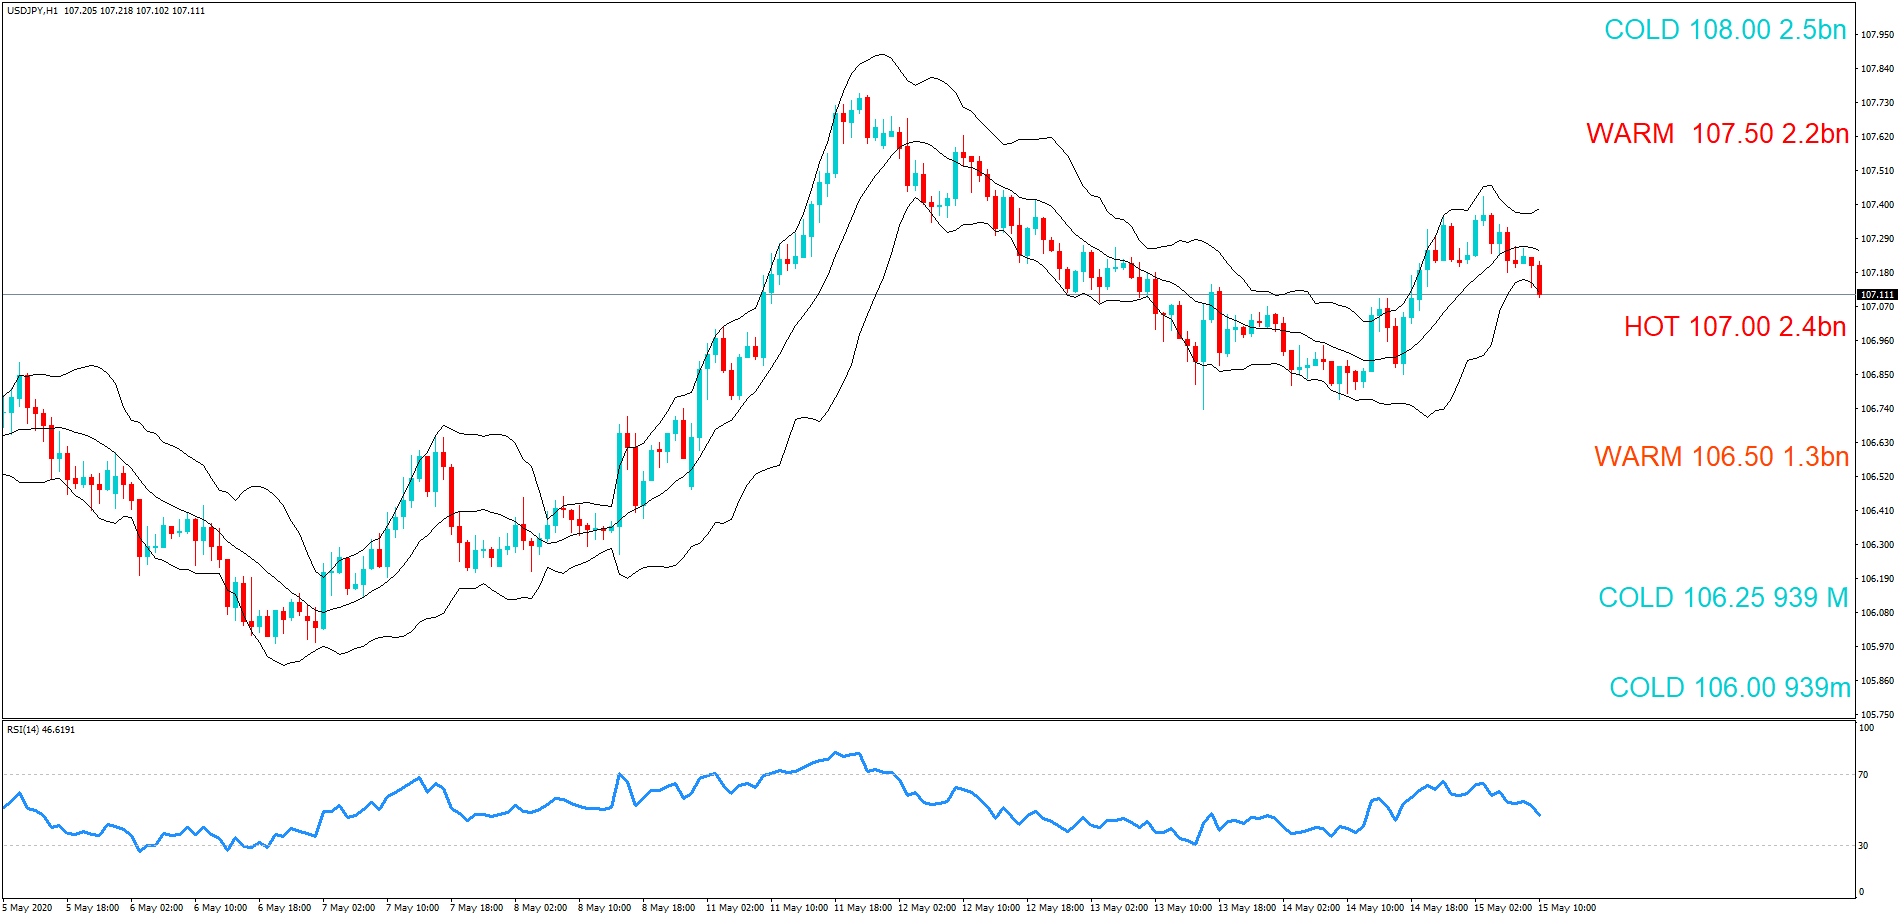
  •   107.50 2.2bn

– AUD/USD: AUD amounts

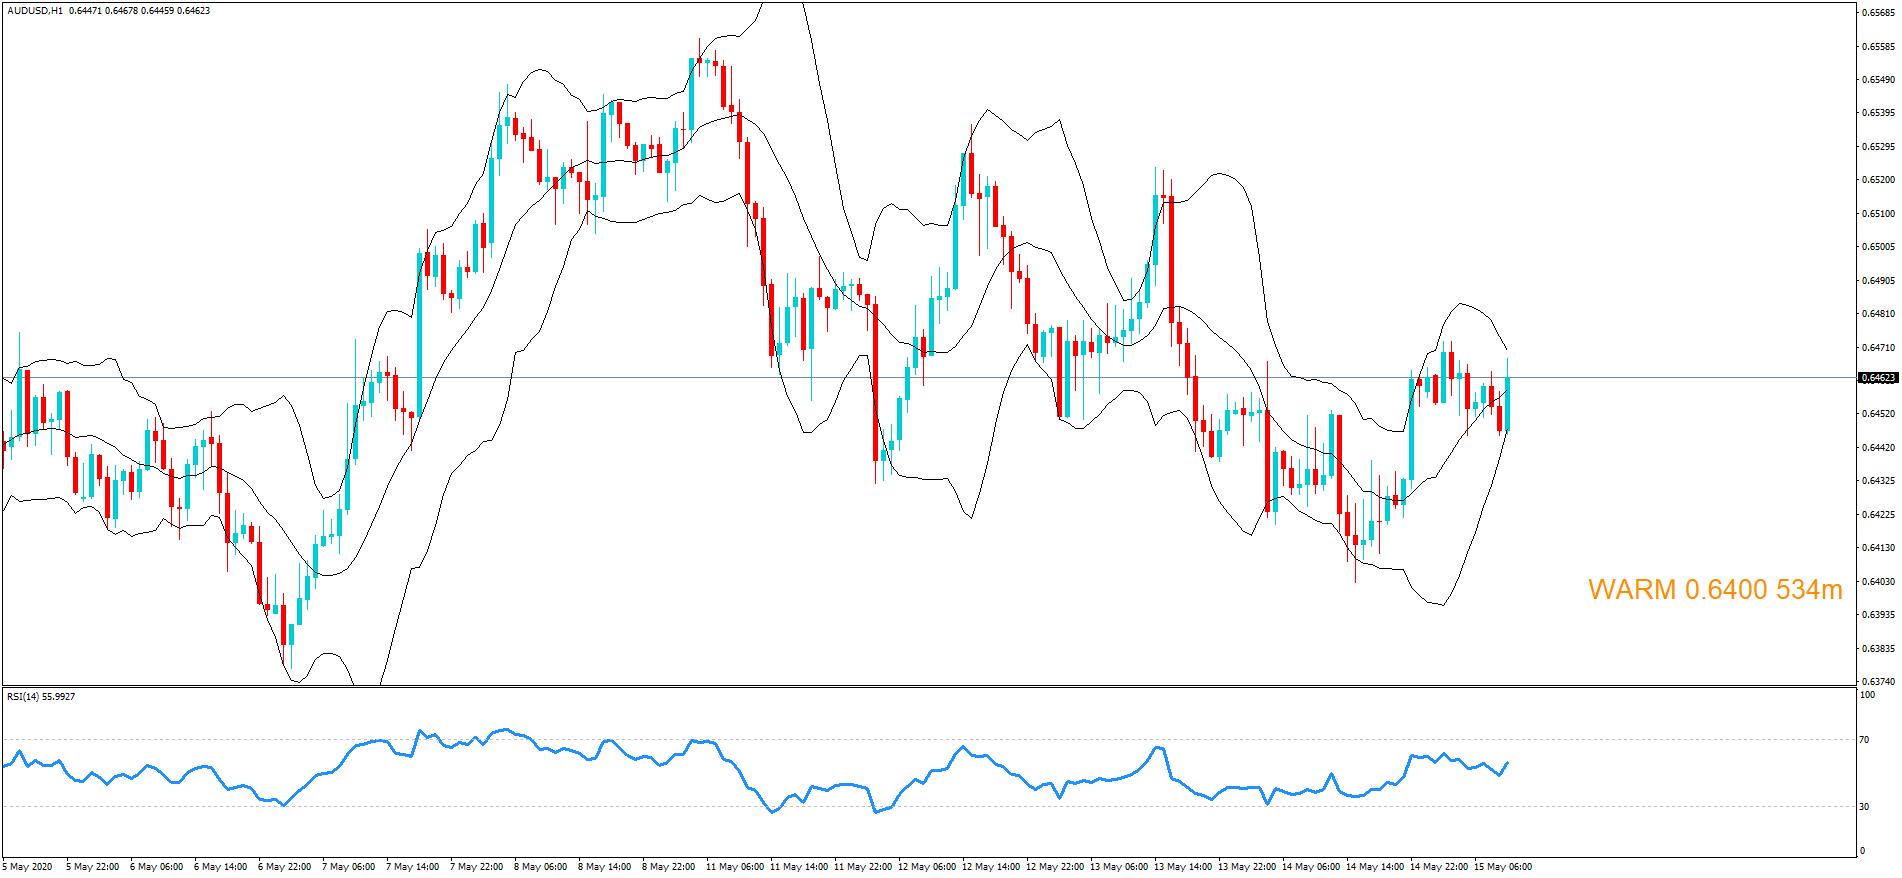
  • 0.6495 634m

– NZD/USD: NZD amounts

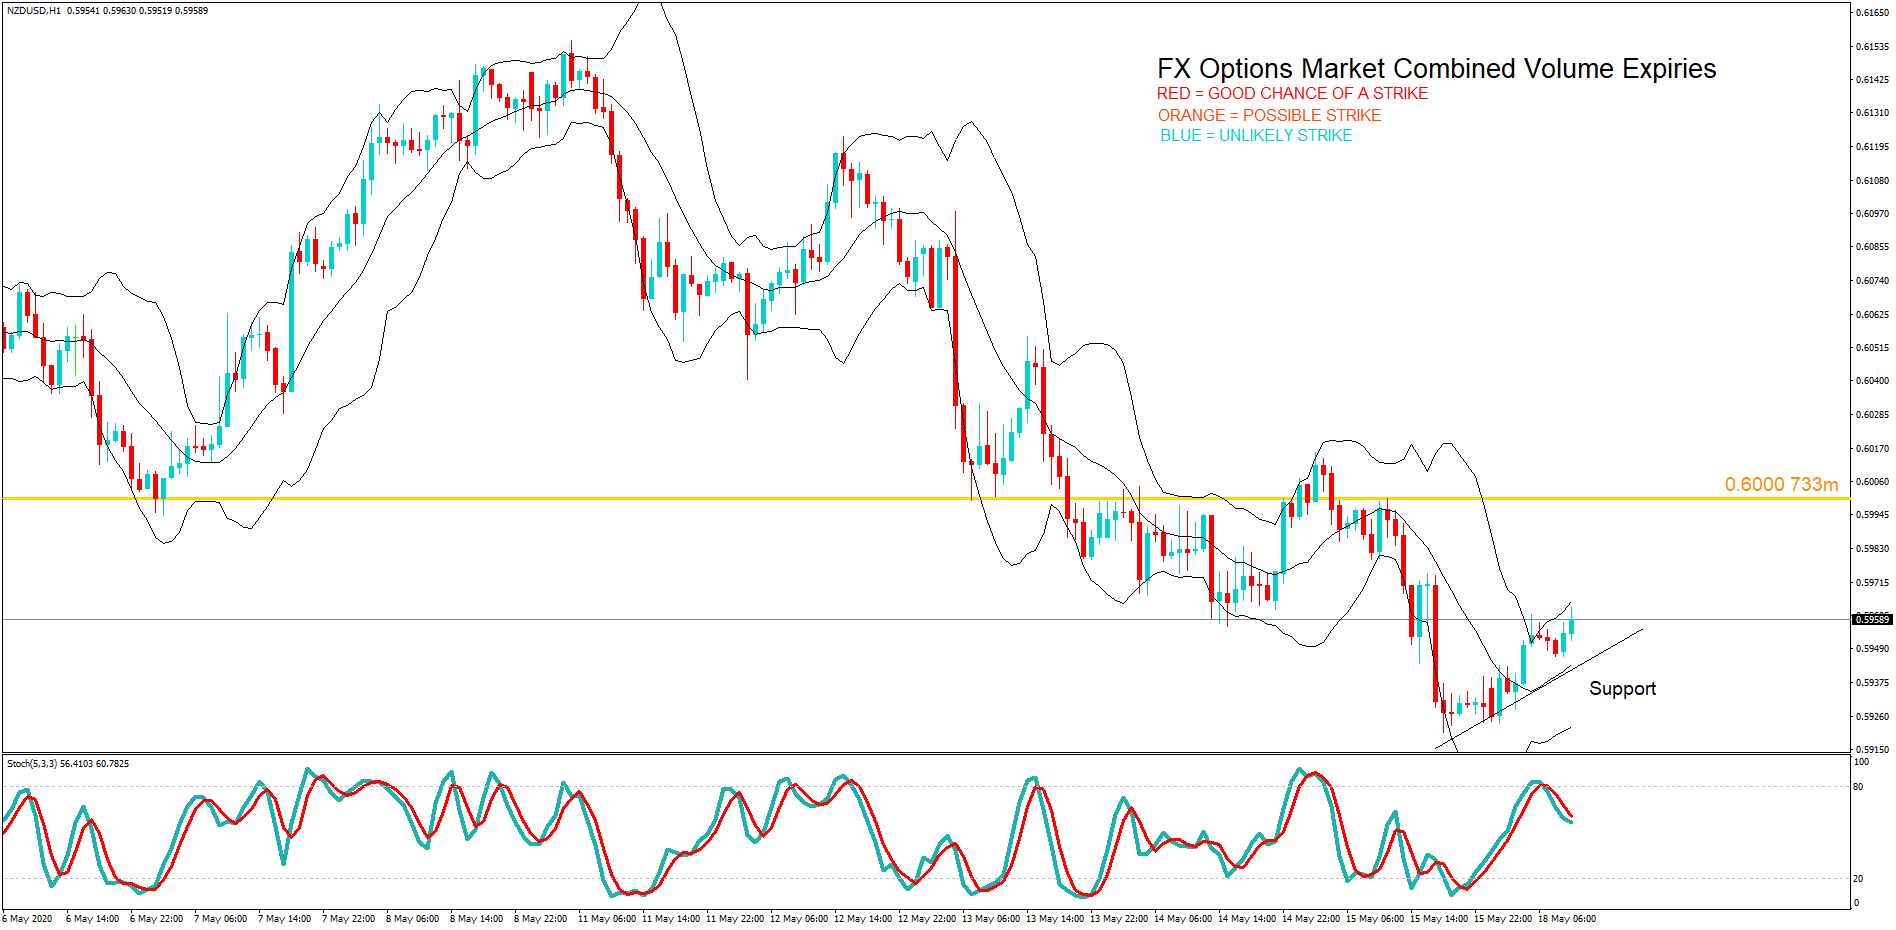
  • 0.6000 733m


………………………………………………………………………………………………………………

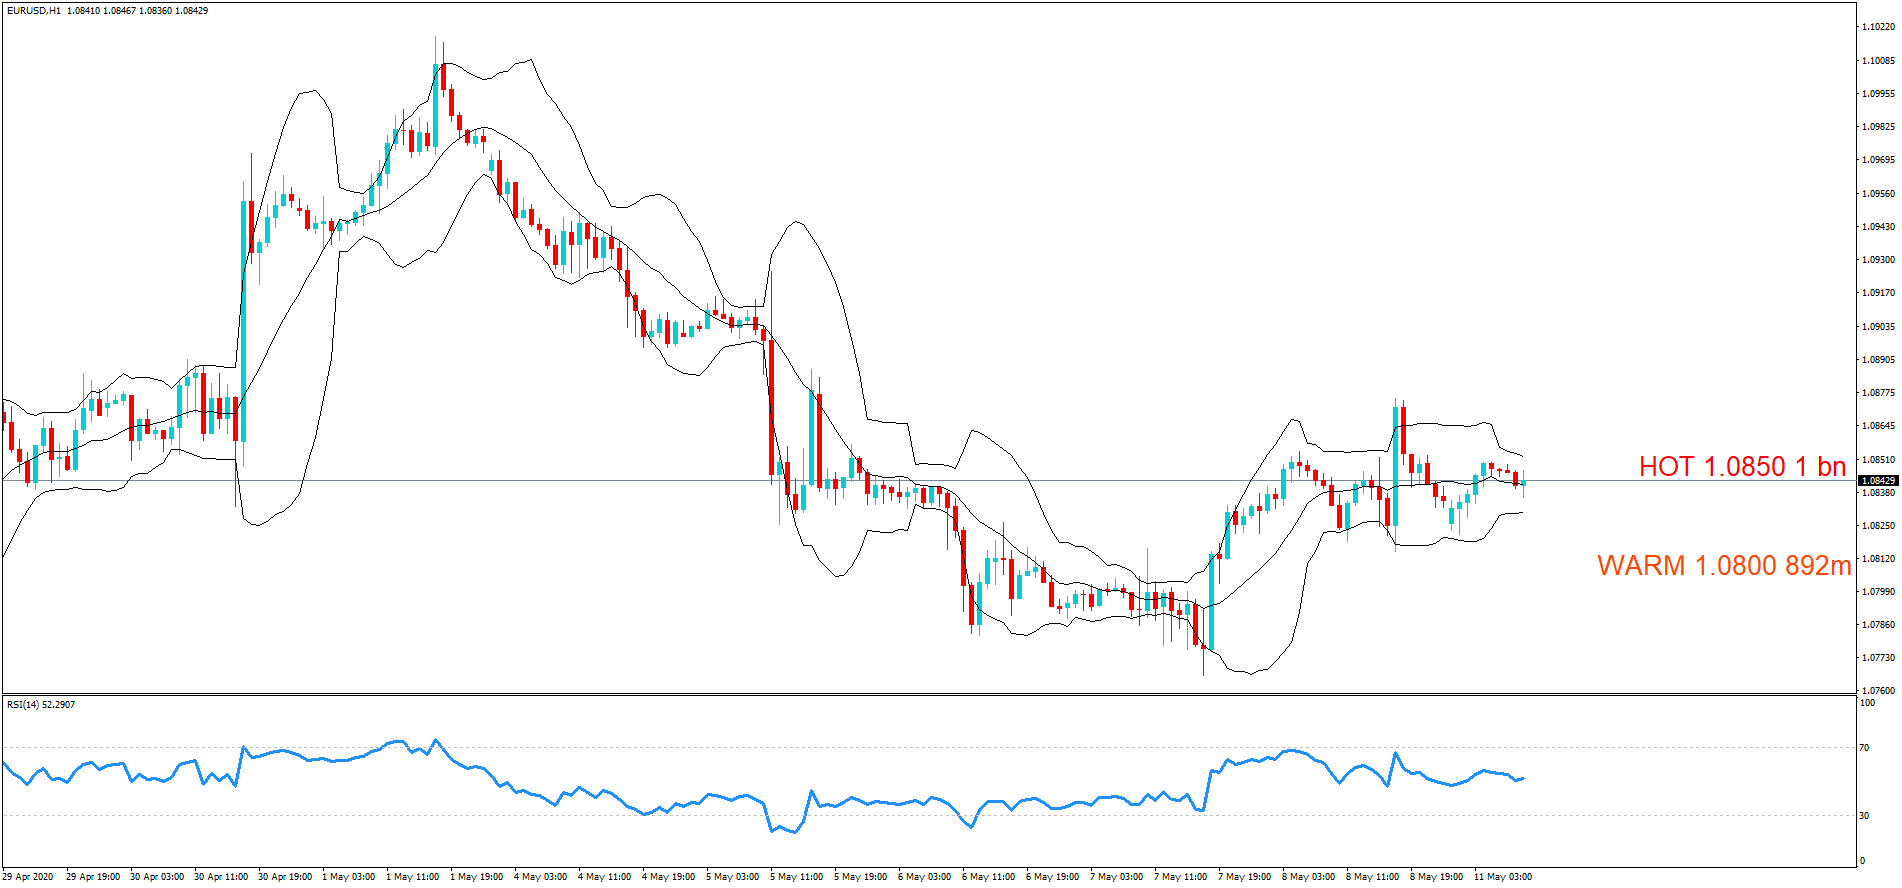
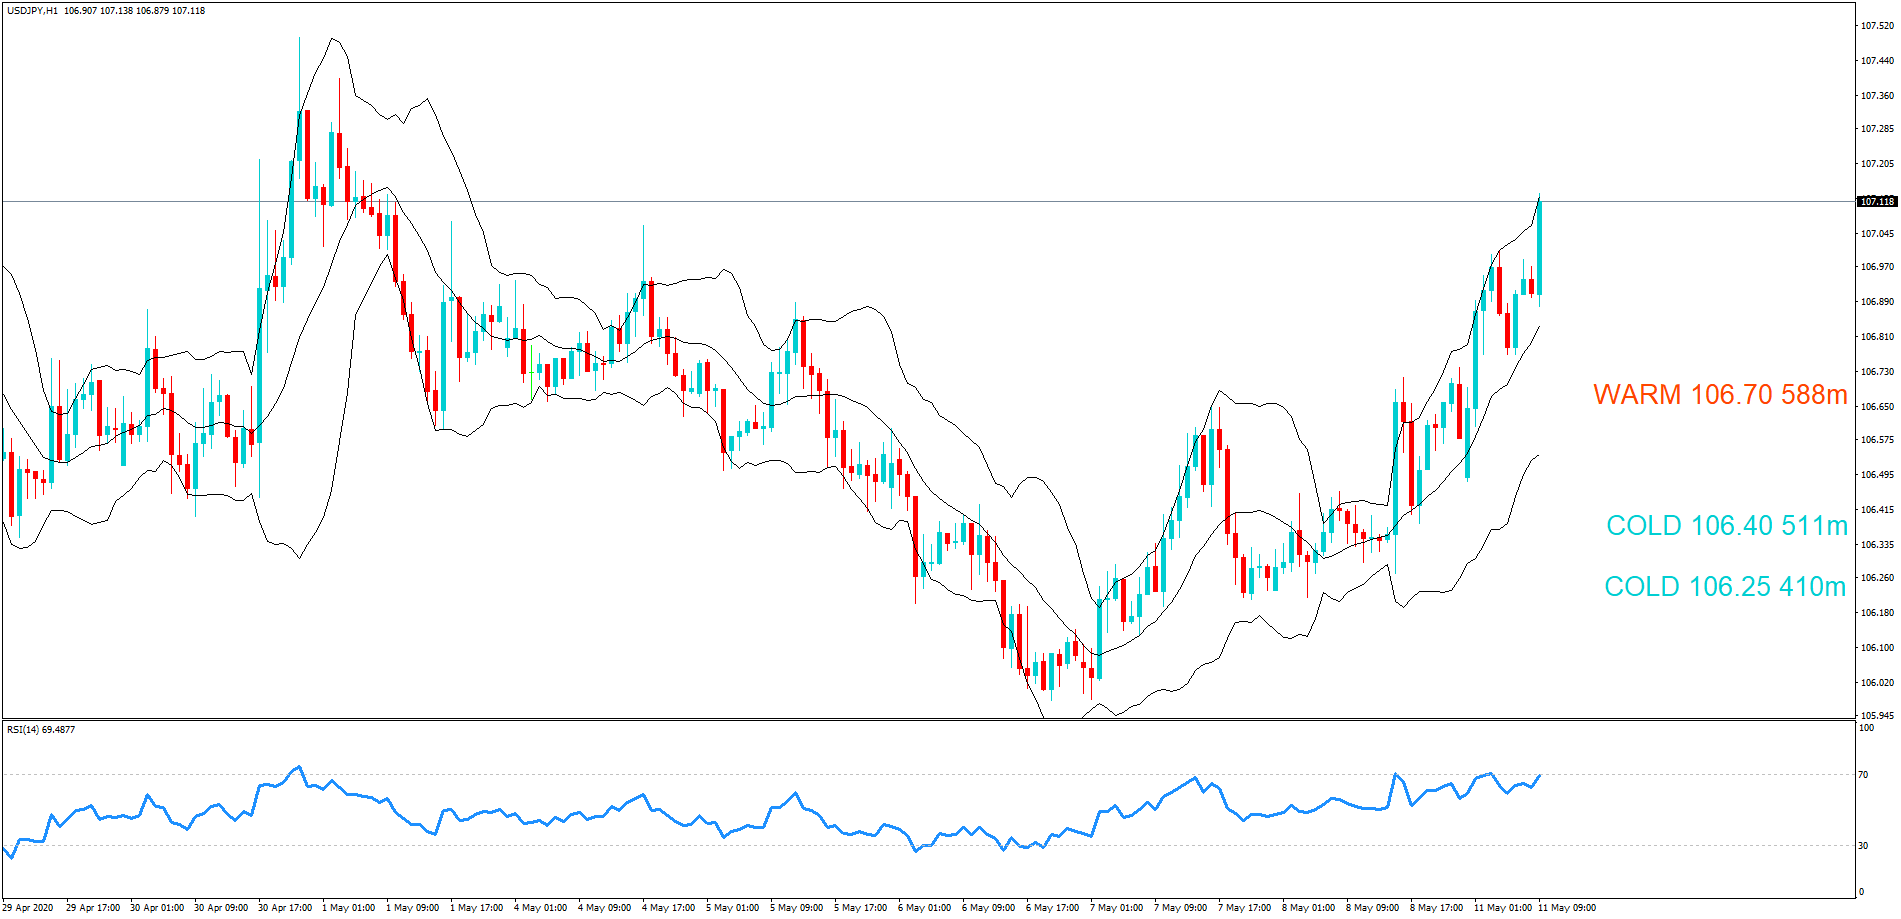
As you can see on the charts we have also plotted the expiration levels at the various exchange rate maturities and we have also labelled in red, orange and blue. Therefore, if you see option expiry exchange rates labelled in red these should be considered in-play, because we believe there is a greater chance of the expiry maturing at these levels based on technical analysis at the time of writing. There is still a lesser possibility of a strike if they are in orange and so these are ‘in-play’ too. However, if we have labelled them in blue, they should be considered ‘not in-play’ and therefore price action would be unlikely to reach these levels, which are often referred to as Strikes, at the time of the 10 AM New York cut.

Our technical analysis is based on exchange rates which may be several hours earlier in the day and may not reflect price action at the time of the maturities. Also, we have not factored in economic data releases or key not speeches by policymakers, or potential market volatility leading up to the cut.

We have added some technical analysis but we suggest you take the levels and plot them onto your own trading charts and incorporate the information into your own trading methodology in order to use the information to your advantage.

Remember the higher the amount, the larger the gravitational pull towards the exchange rate maturity at 10:00 AM Eastern time.

If you want to learn how forex option expiries affect price action in the spot FX market see our educational article by clicking here: https://bit.ly/2VR2Nji

DISCLAIMER: Please note that this information is for educational purposes. Also, the maturities will look more or less likely to become a strike at 10 AM NY time due to exchange rate fluctuations resulting in a different perspective with regard to technical analysis, and also due to upcoming economic data releases for the associated pairs.

Categories
Forex Options

FX option expiries for May 15 New York cut

Thank you for visiting the Forex.Academy FX Options Expiries Section. Each day, where available, we will bring you notable maturities in FX Options of amounts of $100 million-plus, and where these large commutative maturities at specified currency exchange rates often have a magnetic effect on price action, especially in the hours leading to their maturities, which happens daily at 10.00 AM Eastern time. This is because the big institutional players hedge their positions accordingly. Each option expiry should be considered ‘in-play’ if labelled as Hot or Warm, or ‘out of play’ if labelled Cold with regard to the likelihood of price action meeting the strike price at maturity.

…………………………………………………………………………………………………………………..

FX option expiries for May 15 NY cut

FX option expiries for May 15 NY cut at 10:00 Eastern Time, via DTCC, can be found below.

– EUR/USD: EUR amounts

  • 1.0700 859m
  • 1.0800 569m
  • 1.0900 711m

– GBP/USD: GBP amounts        

  • 1.2085 209m
  • 1.2250 256m 


– USD/JPY: USD amounts         

  • 106.00 939m
  • 106.25 1.4bn
  • 106.50 1.3bn
  • 107.00 2.4bn
  • 107.50 2.2bn
  • 108.00 2.5bn

– AUD/USD: AUD amounts

  • 0.6400 534m 

– USD/CAD: USD amounts

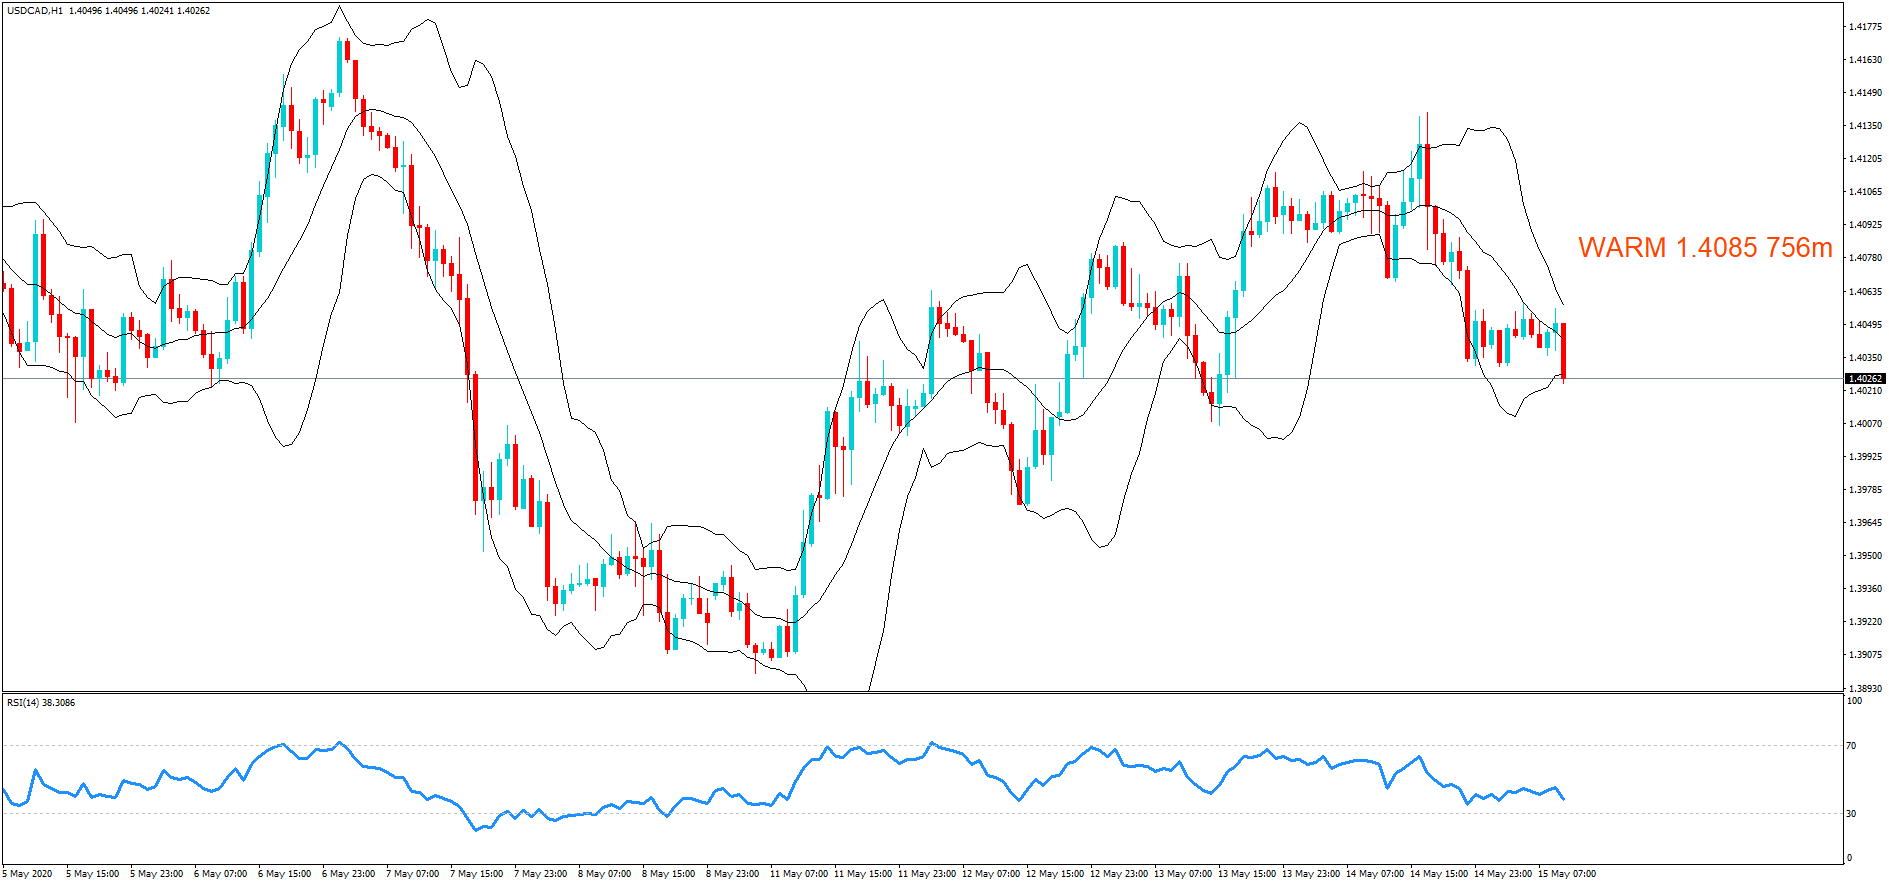
  • 1.4085 756m 

………………………………………………………………………………………………………………

As you can see on the charts we have also plotted the expiration levels at the various exchange rate maturities and we have also labelled them as cold, warm or hot.

If you want to learn how forex option expiries affect price action in the spot FX market see our educational article by clicking here: https://bit.ly/2VR2Nji

DISCLAIMER: Please note that this information is for educational purposes. Also, heat levels may change throughout the day in line with the exchange rate fluctuations due to technical analysis trading and upcoming economic data releases of the associated pairs.

Categories
Forex Options

FX option expiries for May 14 New York cut

Thank you for visiting the Forex.Academy FX Options Expiries Section. Each day, where available, we will bring you notable maturities in FX Options of amounts of $100 million-plus, and where these large commutative maturities at specified currency exchange rates often have a magnetic effect on price action, especially in the hours leading to their maturities, which happens daily at 10.00 AM Eastern time. This is because the big institutional players hedge their positions accordingly. Each option expiry should be considered ‘in-play’ if labelled as Hot or Warm, or ‘out of play’ if labelled Cold with regard to the likelihood of price action meeting the strike price at maturity.

…………………………………………………………………………………………………………………..

FX option expiries for May 14 NY cut

FX option expiries for May 14 NY cut at 10:00 Eastern Time, via DTCC, can be found below.

EUR/USD

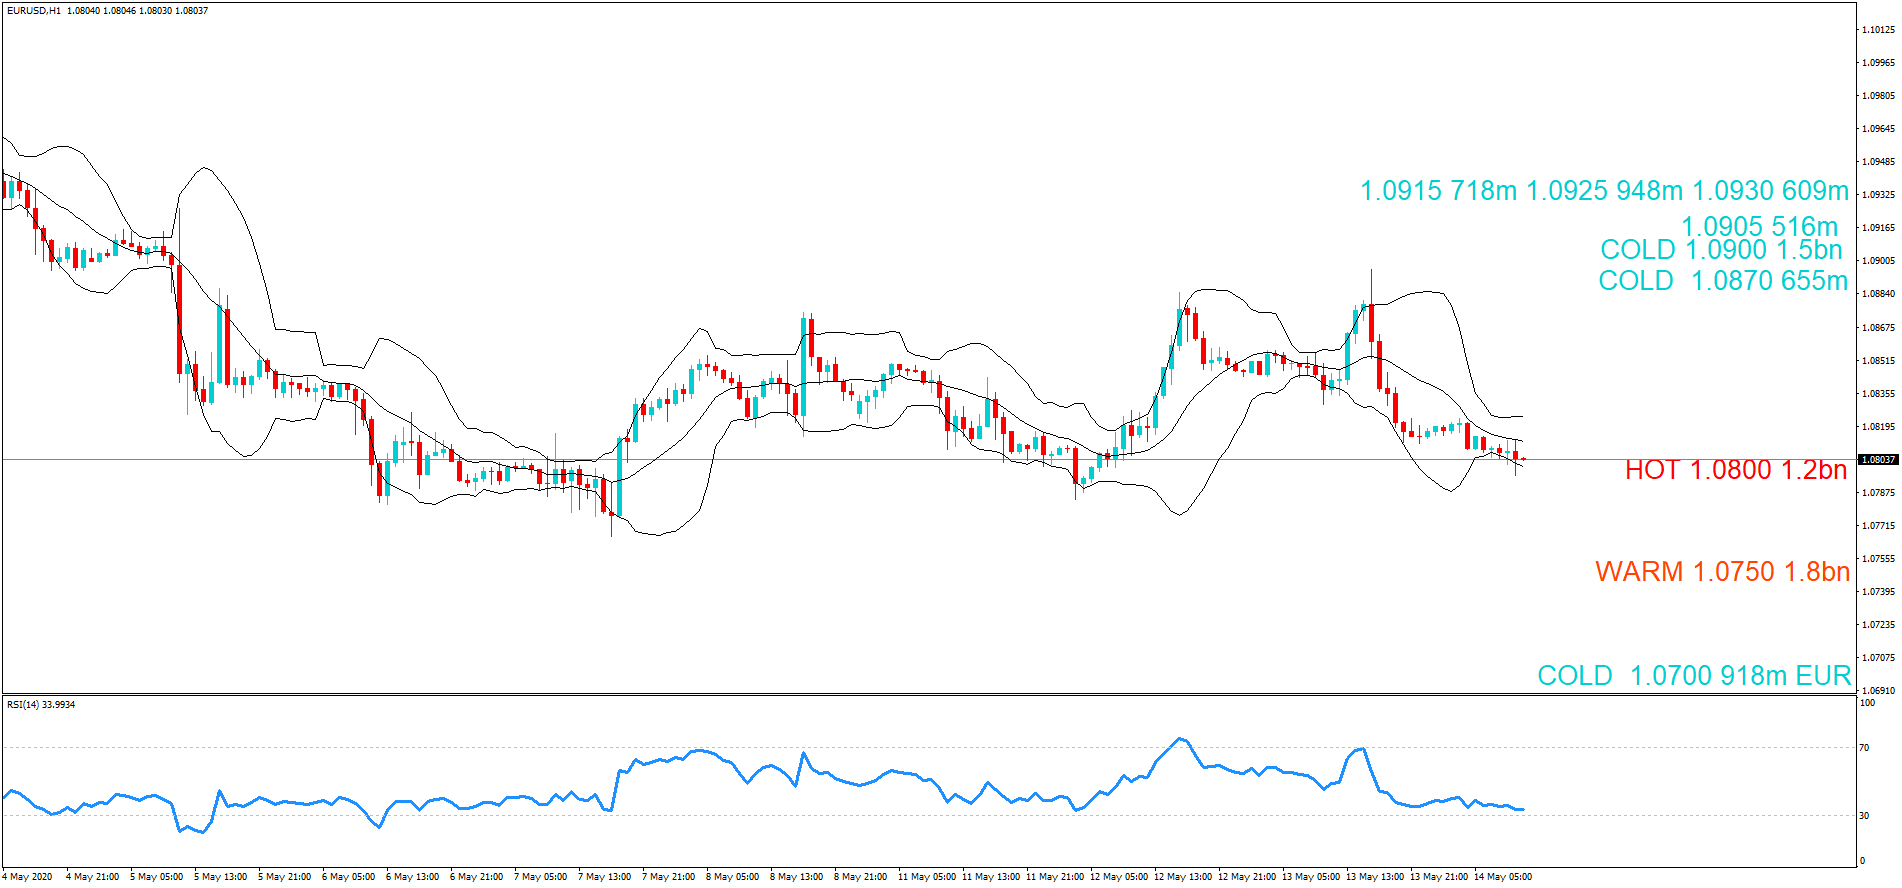
  •  1.0700 918m EUR
  •  1.0750 1.8bn
  •  1.0800 1.2bn
  •  1.0870 655m
  •  1.0900 1.5bn
  •  1.0905 516m
  •  1.0915 718m
  •  1.0925 948m
  •  1.0930 609m

USD/JPY

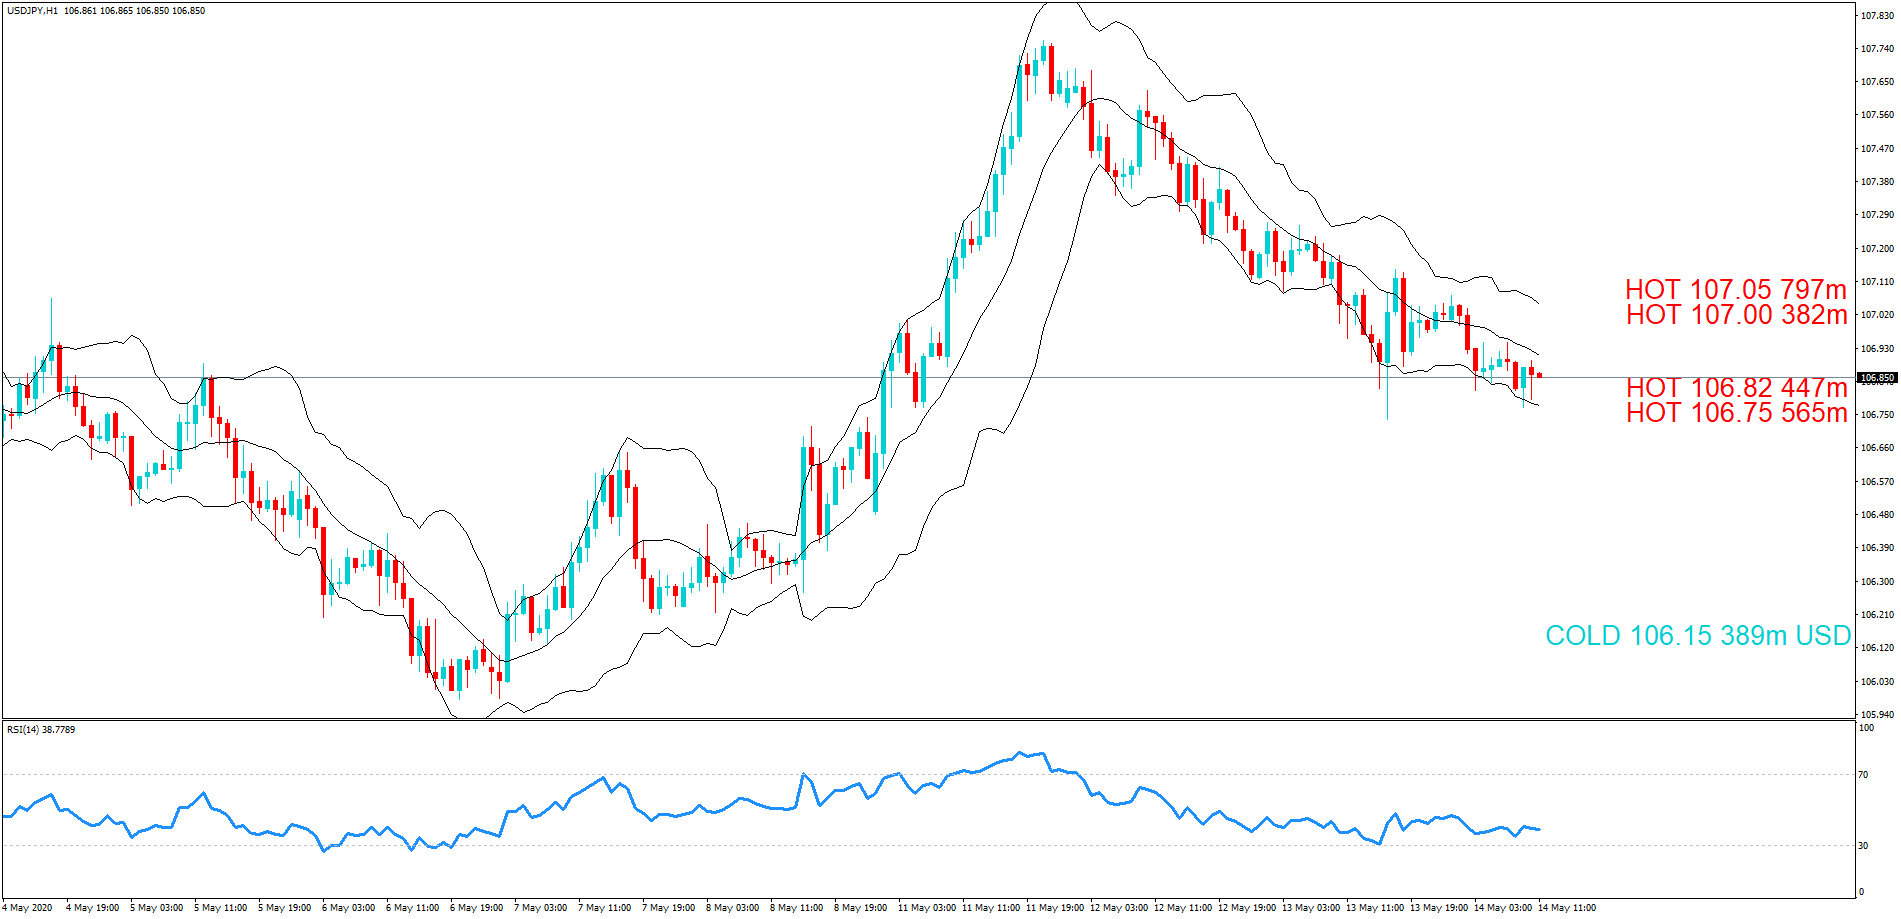
  • 106.15 389m USD
  • 106.75 565m
  • 106.82 447m
  • 107.00 382m
  • 107.05 797m

 GBP/USD

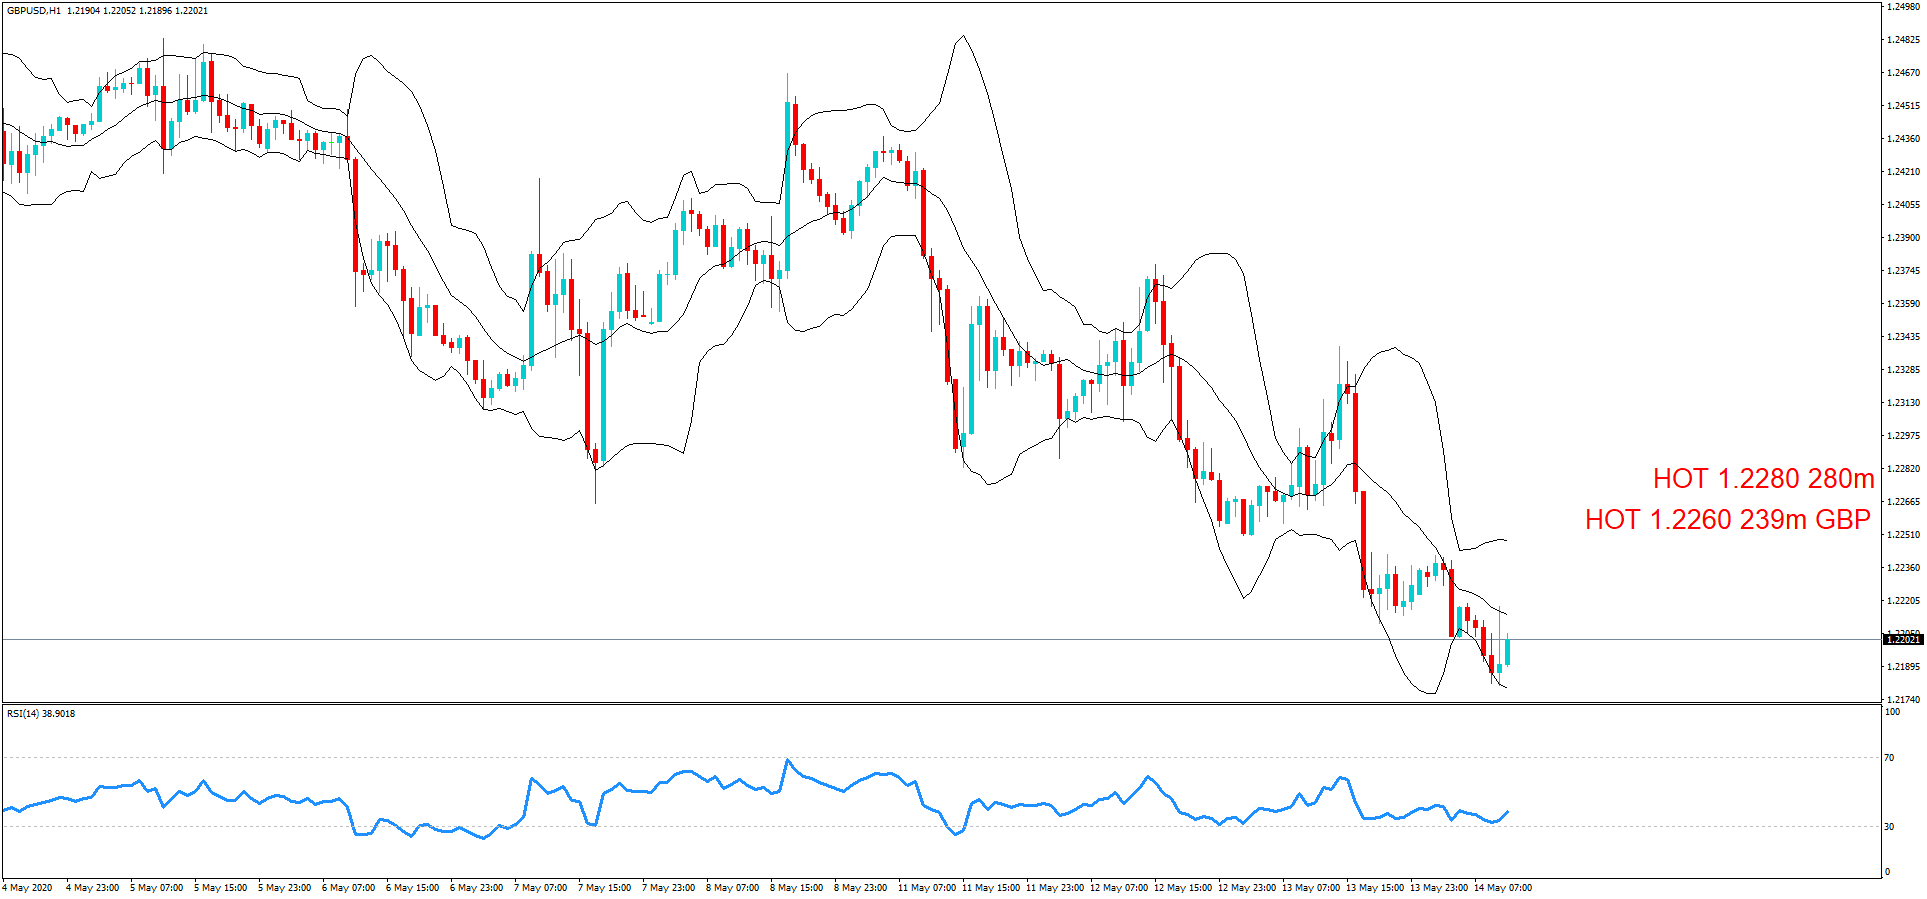
  • 1.2260 239m GBP
  • 1.2280 280m

 AUD/USD

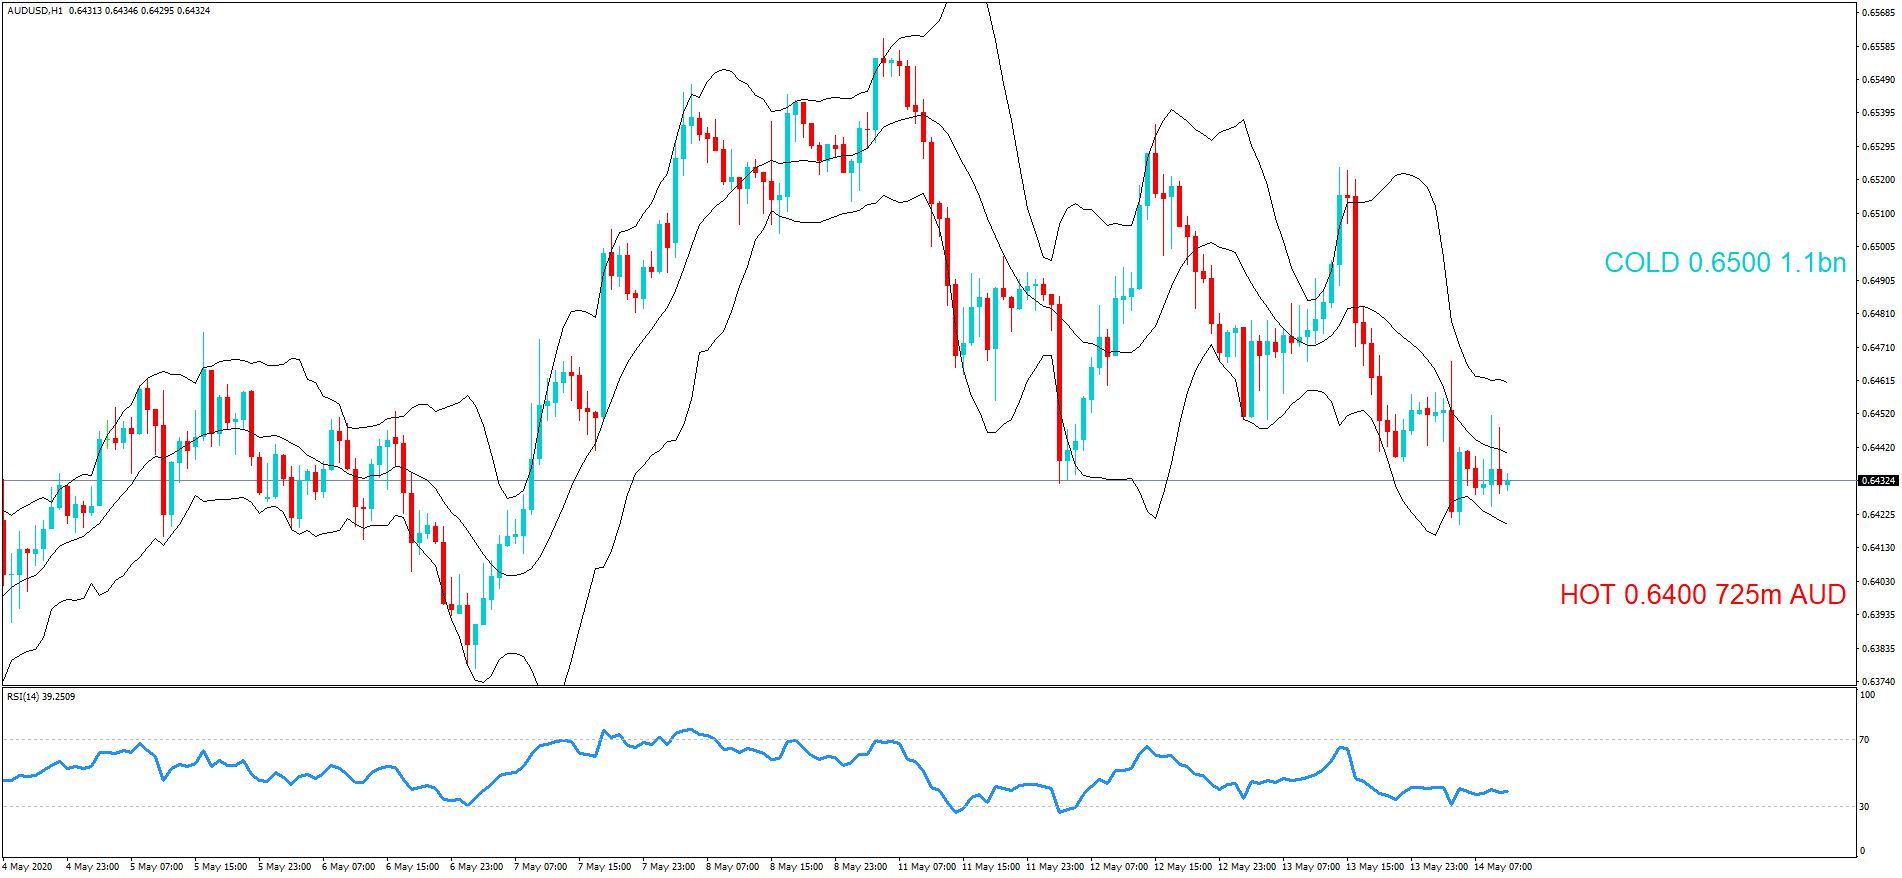
  • 0.6400 725m AUD
  • 0.6500 1.1bn

 EUR/GBP

  •  0.8750 542m EUR
  •  0.8800 851m  

………………………………………………………………………………………………………………

As you can see on the charts we have also plotted the expiration levels at the various exchange rate maturities and we have also labelled them as cold, warm or hot.

Therefore, if you see exchange rates labelled as warm or hot, these should be considered In-Play, because we believe there is a greater chance of the expiry maturing at these levels based on technical analysis at the time of writing. However, if we have labelled them as Cold, they should be considered Not In-Play and therefore price action would be unlikely to reach these levels, which are often referred to as Strikes, at the time of the New York cut. Please bear in mind that we have not factored in upcoming economic data releases, or policymaker speeches and that technical analysis may change in the hours leading up to the cut.

We suggest you take the levels and plot them onto your own trading charts and incorporate the information into your own trading methodology in order to use the information to your advantage.

Remember the higher the amount, the larger the gravitational pull towards the exchange rate maturity at 10:00 AM Eastern time.

If you want to learn how forex option expiries affect price action in the spot FX market see our educational article by clicking here: https://bit.ly/2VR2Nji

DISCLAIMER: Please note that this information is for educational purposes. Also, heat levels may change throughout the day in line with the exchange rate fluctuations due to technical analysis trading and upcoming economic data releases of the associated pairs.

Categories
Forex Options

FX option expiries for May 13 New York cut

Thank you for visiting Forex.Academy’s FX Options Expiries Section. Each day, where available, Forex Academy will bring you notable maturities in FX Options of volumes of $100 million-plus, as these large commutative maturities at the specified currency exchange rates often have a magnetic pull on price action, especially in the hours near their maturities. These happens daily at 10.00 AM Eastern time. This effect is due to the big institutional players hedging their positions using option derivatives. Each option expiry has to be considered ‘in-the-money’ if labelled as Hot and Warm, or ‘out of the money’ if labelled Cold with regard to the likelihood of price action meeting the strike price at maturity.

…………………………………………………………………………………………………………………..

FX option expiries for May 13 New York cut

FX option expiries for May 13, NY cut at 10:00 Eastern Time, via DTCC, can be found below.

– USD/JPY: USD amounts         

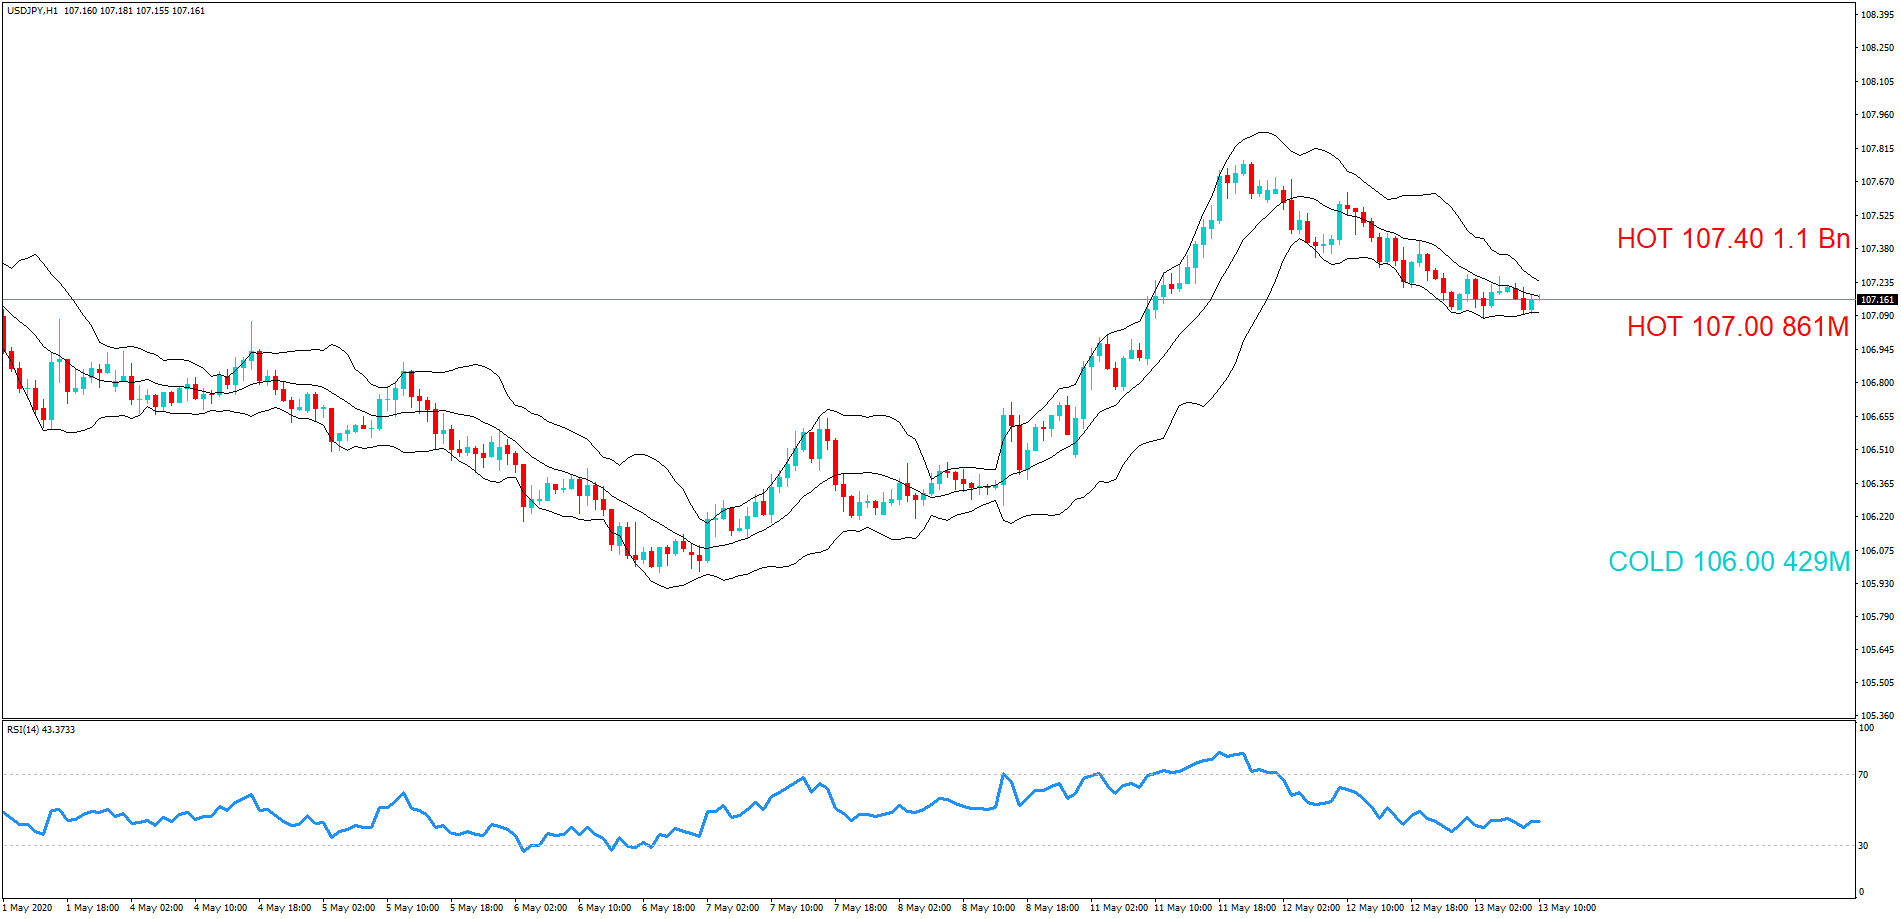
  • 106.00 429m
  • 107.00 861m
  • 107.40 1.1bn


– GBP/USD: GBP amounts        

  • 1.2440 350m


– AUD/USD: AUD amounts

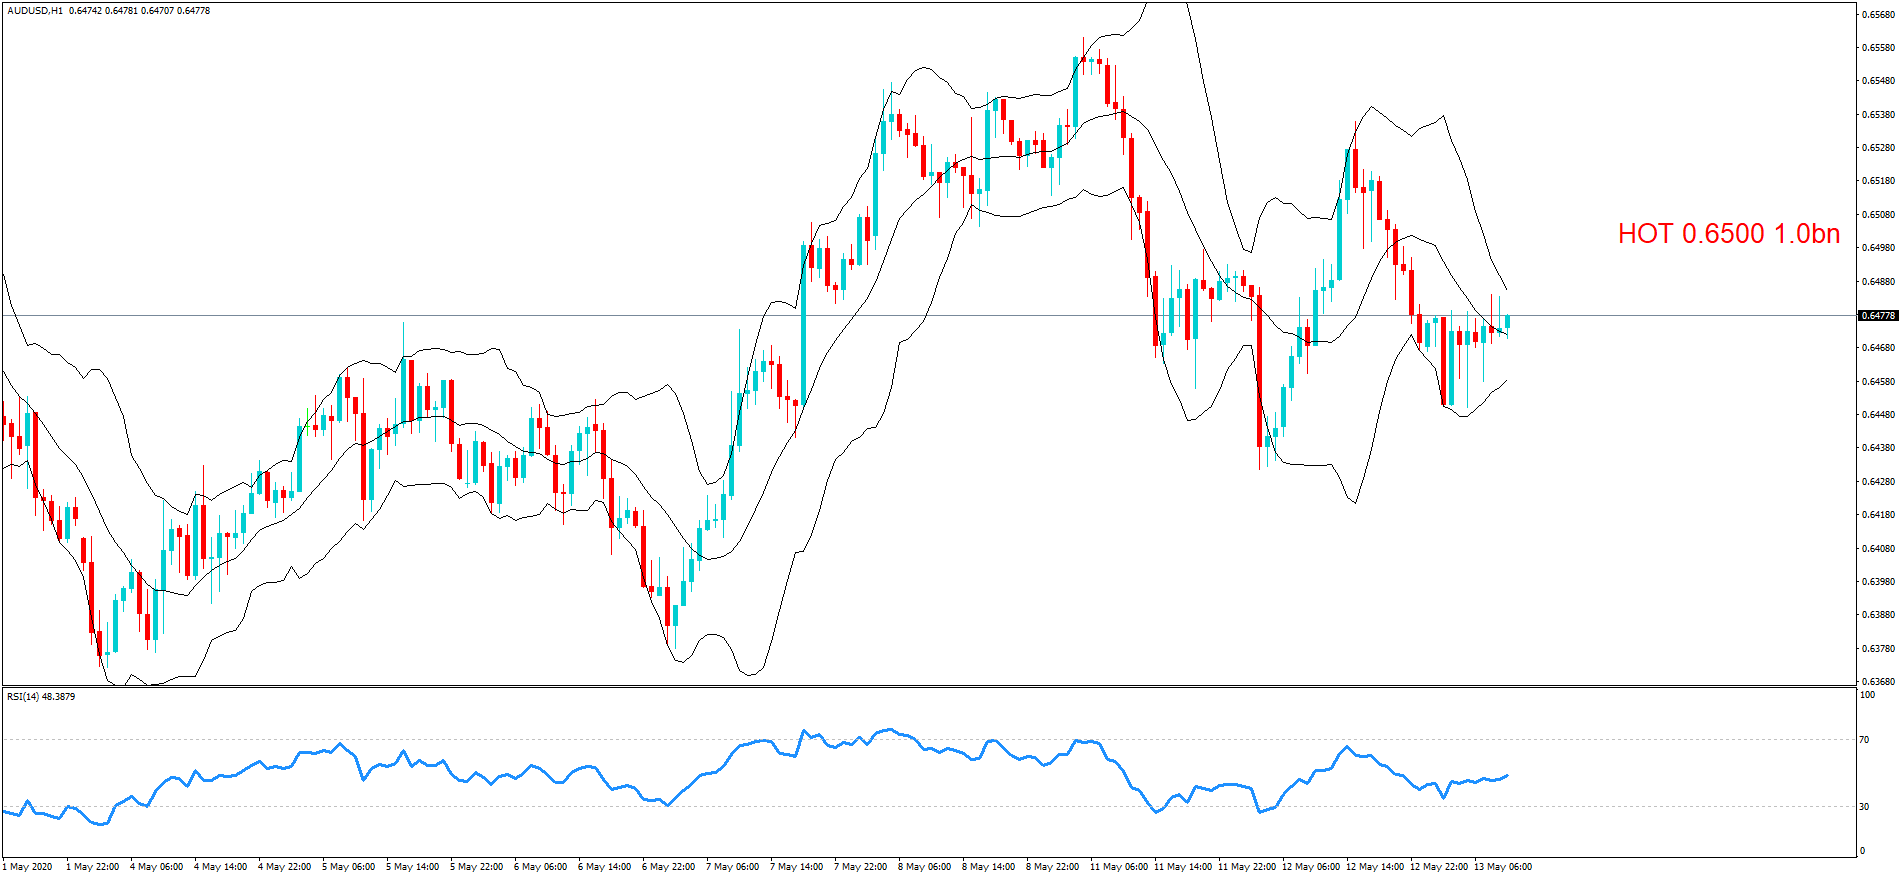
  • 0.6500 1.0bn 

– USD/CAD: USD amounts

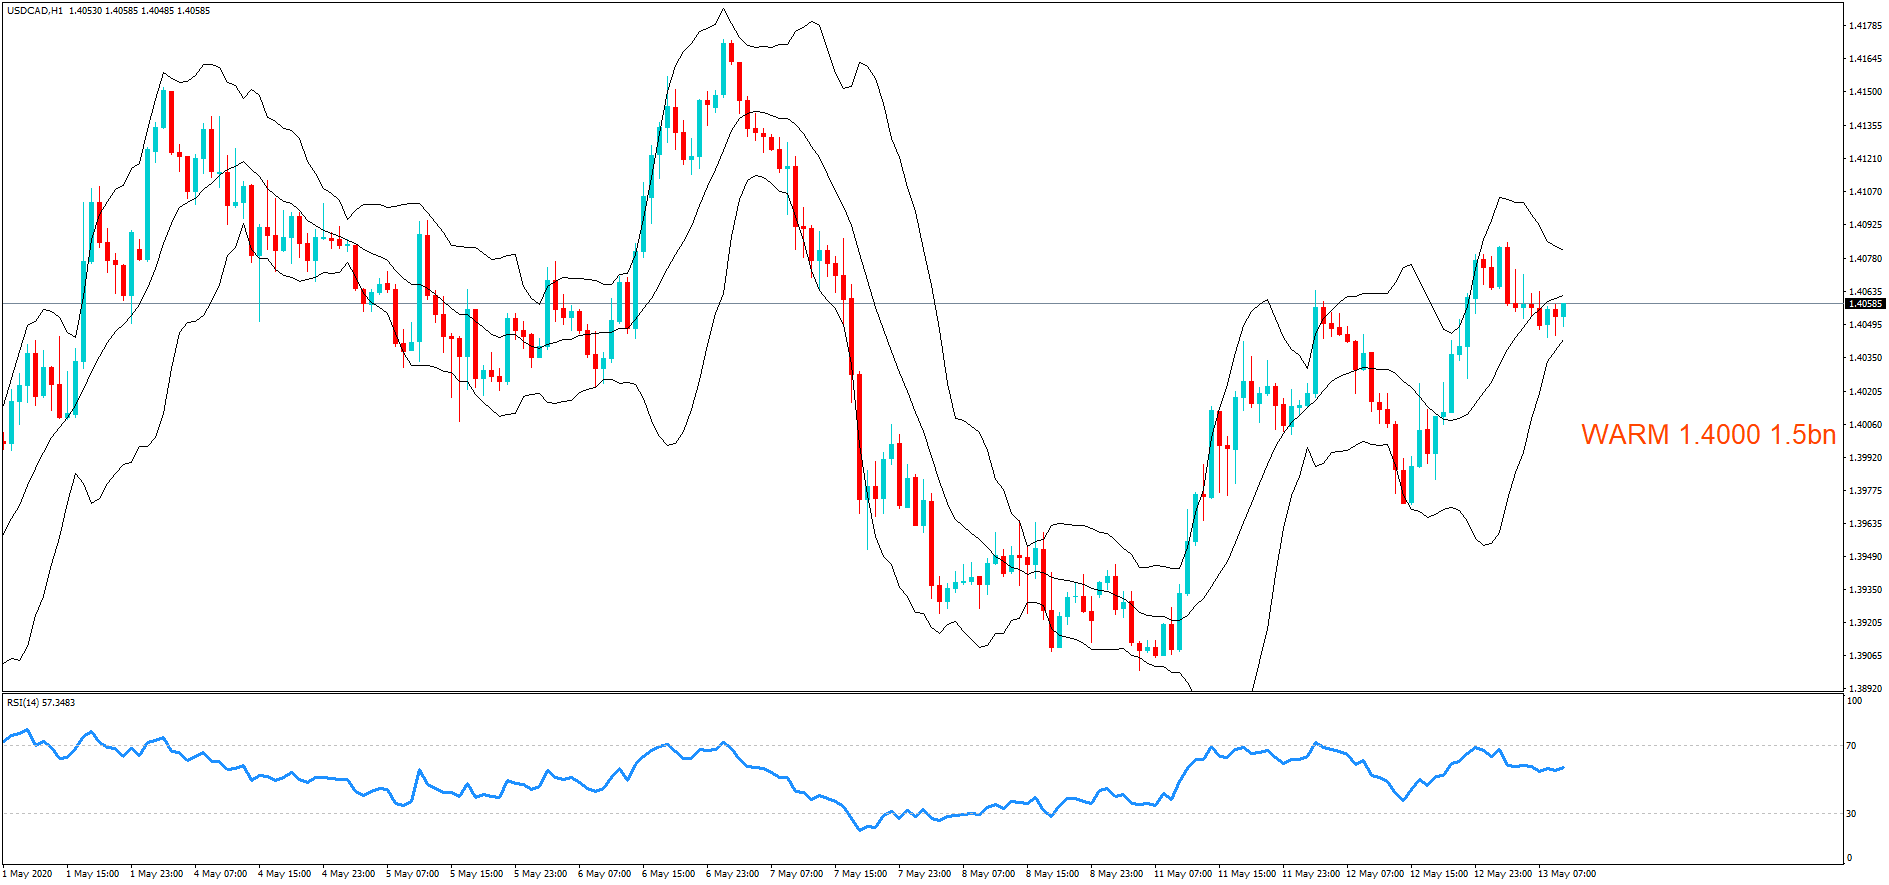
  • 1.4000 1.5bn


– EUR/GBP: EUR amounts

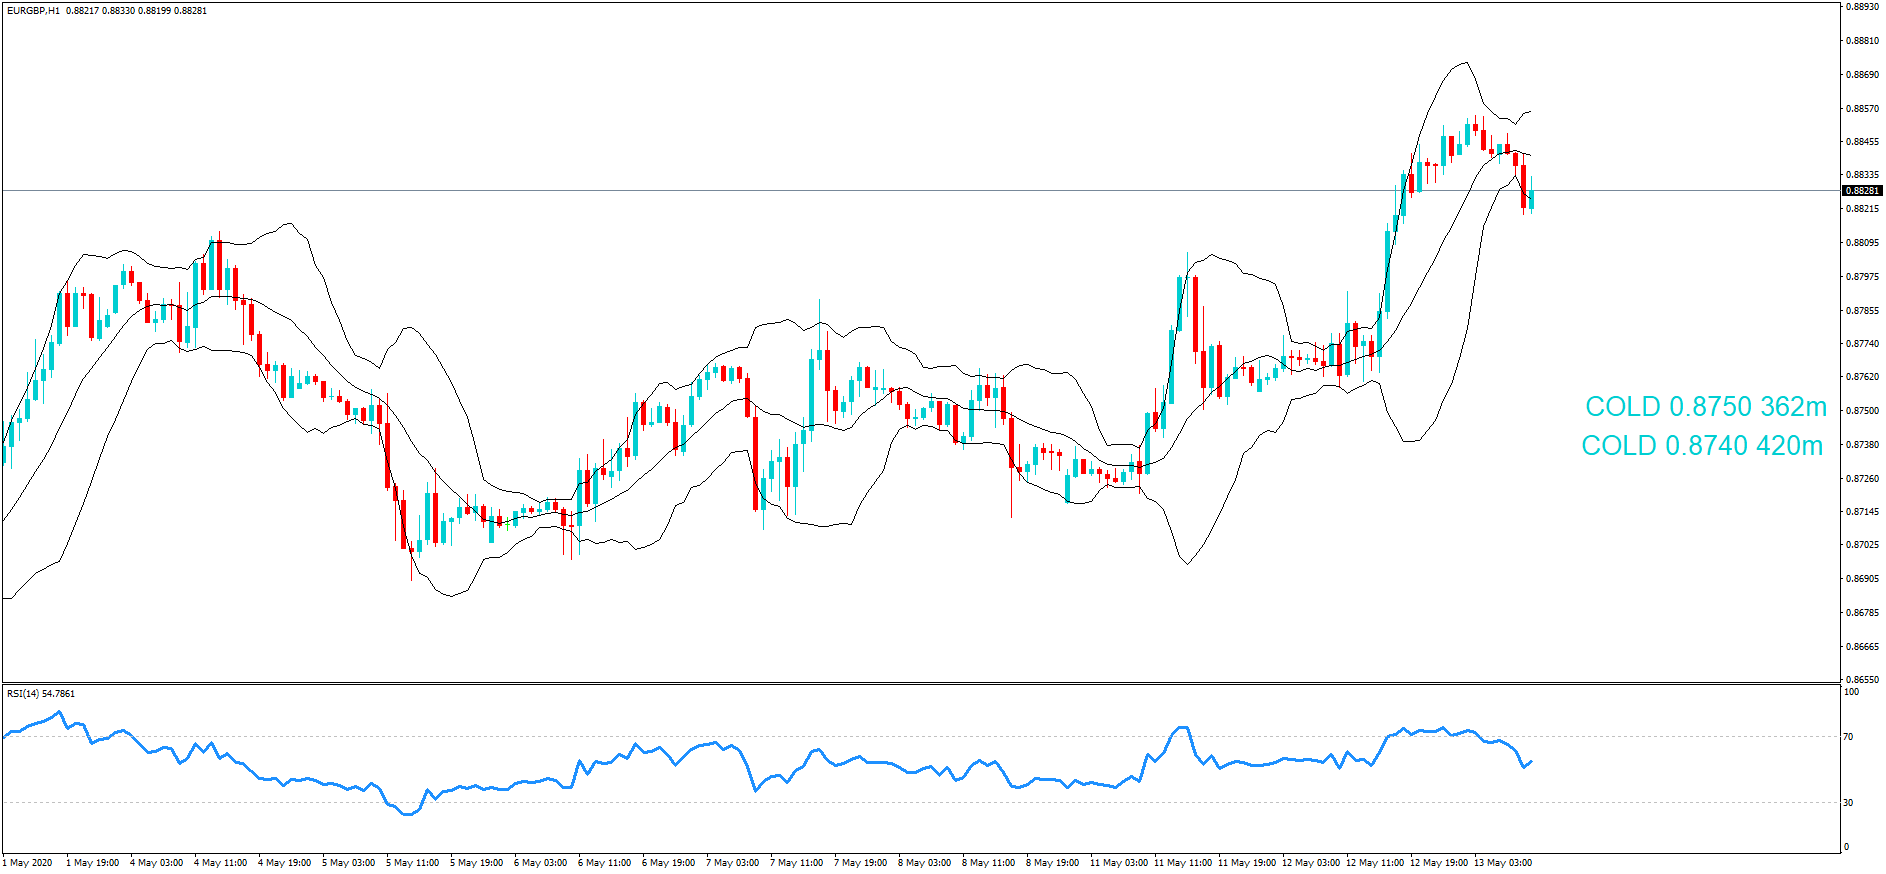
  • 0.8740 420m
  • 0.8750 362m

………………………………………………………………………………………………………………

As we can see on the charts we have also plotted the expiration levels at the various exchange rate maturities and we have also labelled them as cold, warm or hot.

Therefore, if you spot exchange rates labelled as warm or hot, these should be considered In-Play. That is because we believe there is a greater likelihood of the expiry maturing at these levels based on the technical analysis at the time of this writing. However, if you see them labelled as Cold, they should be considered Not In-Play; thus it would be unlikely that price action could reach these levels, which are referred to as Strikes, at the New York’s cut time. Please consider that upcoming economic data releases are not factored in, nor did we take into account policymaker speeches that may modify the technical analysis outlook in the hours leading up to the expiration.

We suggest you plot these levels onto your own trading charts and combine this information into your own trading methodology in order to use the information to your advantage.

Remember the higher the volume of interest, the larger the gravitational pull towards the exchange rate maturity at 10:00 AM Eastern time.

If you want to learn how forex option expiries affect price action in the spot FX market see our educational article by clicking here: https://bit.ly/2VR2Nji

DISCLAIMER: Please note that this information is for educational purposes. Also, heat levels may change throughout the day in line with the exchange rate fluctuations due to technical analysis trading and upcoming economic data releases of the associated pairs.

Categories
Forex Options

FX option expiries for May 12 New York cut

Thank you for visiting the Forex.Academy FX Options Expiries Section. Each day, where available, we will bring you notable maturities in FX Options of amounts of $100 million-plus, and where these large commutative maturities at specified currency exchange rates often have a magnetic effect on price action, especially in the hours leading to their maturities, which happens daily at 10.00 AM Eastern time. This is because the big institutional players hedge their positions accordingly. Each option expiry should be considered ‘in-play’ if labelled as Hot, or Warm, or ‘out of play’ if labelled Cold with regard to the likelihood of price action meeting the strike price at maturity.

………………………………………………………………………………………………………….

FX option expiries for May 12 NY cut

FX option expiries for May 12 NY cut at 10:00 Eastern Time, via DTCC, can be found below.

– EUR/USD: EUR amounts

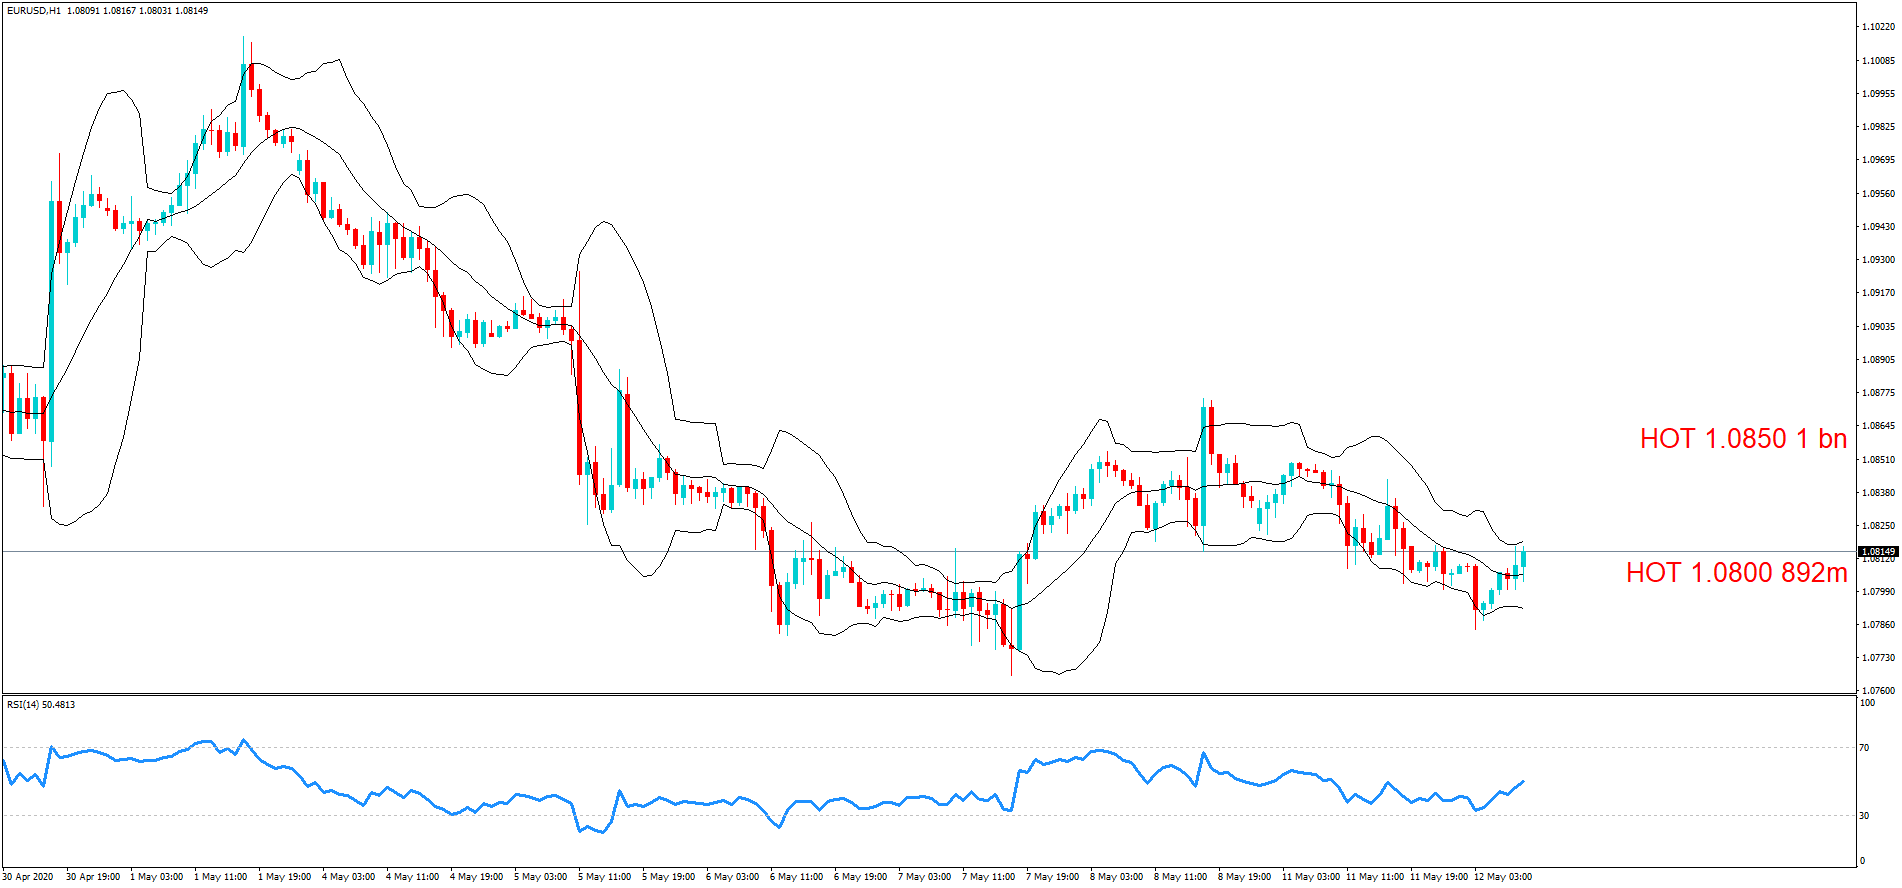
  • 1.0800 892m
  • 1.0850 1.0bn


– USD/JPY: USD amounts         

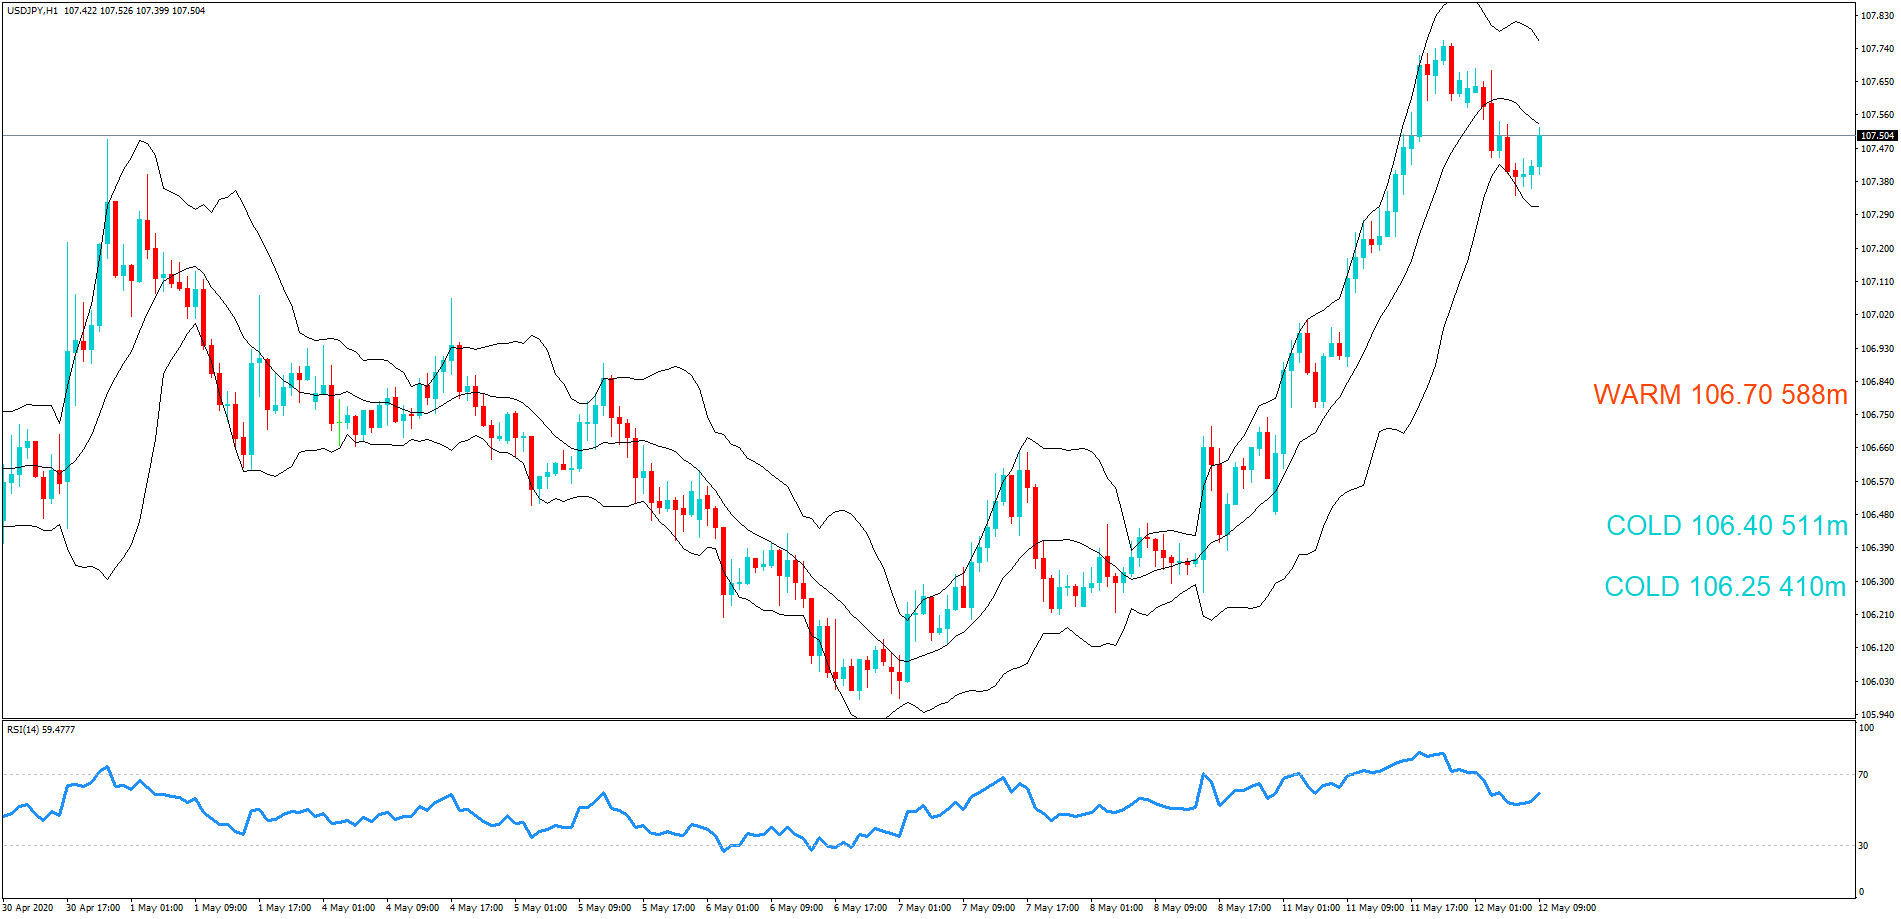
  • 106.25 410m
  • 106.40 511m
  • 106.70 588m


– NZD/USD: NZD amounts

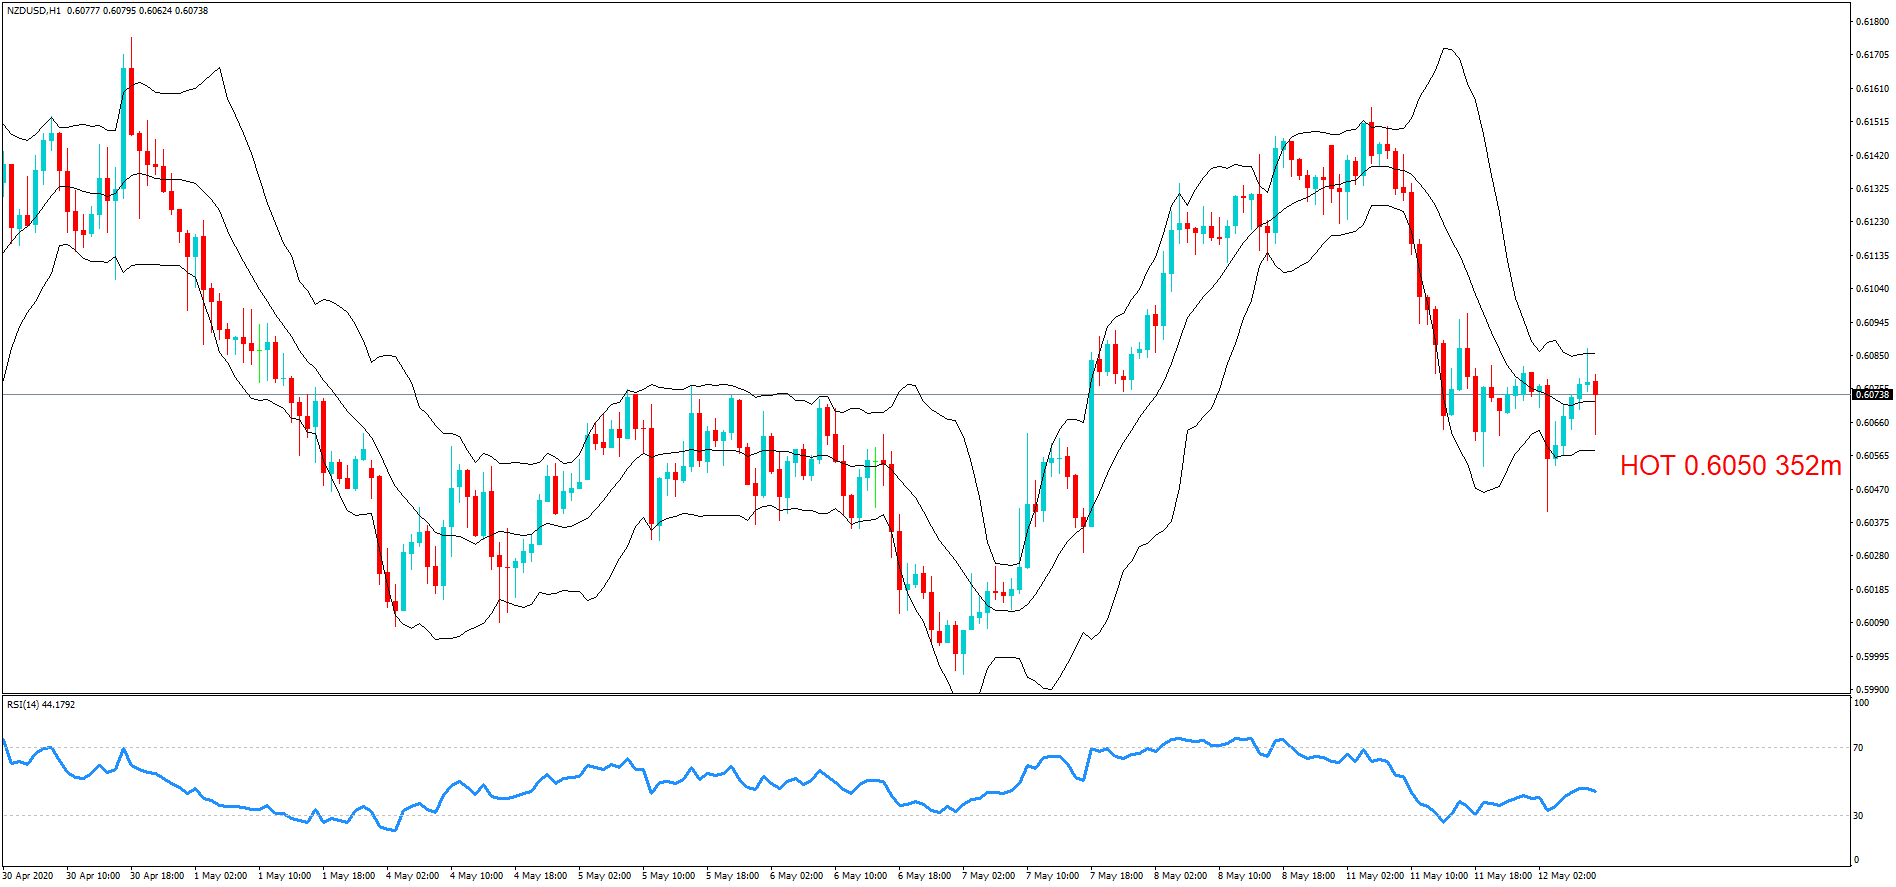
  • 0.6050 352m

………………………………………………………………………………………………………………

As you can see on the charts we have also plotted the expiration levels at the various exchange rate maturities and we have also labelled them as cold, warm or hot.

Therefore, if you see exchange rates labelled as warm or hot, these should be considered In-Play, because we believe there is a greater chance of the expiry maturing at these levels based on technical analysis at the time of writing. However, if we have labelled them as Cold, they should be considered Not In-Play and therefore price action would be unlikely to reach these levels, which are often referred to as Strikes, at the time of the New York cut. Please bear in mind that we have not factored in upcoming economic data releases, or policymaker speeches and that technical analysis may change in the hours leading up to the cut.

We suggest you take the levels and plot them onto your own trading charts and incorporate the information into your own trading methodology in order to use the information to your advantage.

Remember the higher the amount, the larger the gravitational pull towards the exchange rate maturity at 10:00 AM Eastern time.

If you want to learn how forex option expiries affect price action in the spot FX market see our educational article by clicking here: https://bit.ly/2VR2Nji

DISCLAIMER: Please note that this information is for educational purposes. Also, heat levels may change throughout the day in line with the exchange rate fluctuations due to technical analysis trading and upcoming economic data releases of the associated pairs.

Categories
Forex Fundamental Analysis

The Impact Of ‘Capacity Utilization’ On The Forex Price Charts

Introduction

Capacity Utilization is a straightforward and crude way of finding out whether a business or an economy is operating at its peak potential. Investors would always prefer to direct their capital, where their returns are maximized to the optimal levels. In this sense, Capacity Utilization can tell us which sectors, or companies, or even economies would attract capital, which would further fuel growth and prosperity. Hence, understanding Capacity Utilization figures will prove advantageous for our fundamental analysis.

What is Capacity Utilization?

Capacity Utilization refers to the proportion of the real potential economic output that is realized at a given point in time. It tells us at what level of maximum capacity is an industry operating at. It is expressed in percentage and is given by the below equation:

For example, a firm that can produce 10,000 phones a day, if it is producing 6,000 phones only, then the company is said to have a Capacity Utilization of 60%.

In the simplest sense, Capacity Utilization is like a report card of an industry or an economy. It tells the current score (or marks) out of the maximum possible marks.

How can the Capacity Utilization numbers be used for analysis?

Capacity Utilization Rate is an essential operational parameter for businesses, especially those manufacturing physical goods, as it is easier to quantify the output.

A company operating at less than 100% implies that the firm can increase its production, and consequently, its profit margin without incurring additional costs of installing new equipment to increase production. Likewise, economies with scores of less than 100% can afford to increase production capacity when demanded.

For the companies, it serves as a metric for determining operating efficiency. Capacity Utilization is susceptible to the following factors:

  • Business Cycles: Businesses are often seasonal, seeing an increase in business during specific periods of the years, although some companies may have consistent business activity throughout the year. It depends on the nature of business and the products being manufactured.
  • Management: Lack of proper management can also lead to wastage of resources; therefore, undermining the efficiency of the company itself. It is not often the common cause but is also one factor that investors must look into to make sure proper management is there to handle the business to utilize the available resources in terms of workforce and equipment to optimize revenue for the firm.
  • Economy’s Health: Economic conditions drive consumer sentiment and affect the spending patterns of people. During fluctuating inflation rates and unstable market economic conditions, people tend to save more and spend less, which can effectively reduce the demand for goods and services. In this case, the company may need to adjust their production to demand.
  • Competition: In an open market environment, competition always takes away a portion of our business, as companies battle for a bigger portion of the market, the best companies with excellent quality goods, and reputation tend to take a higher proportion of market revenue. At the same time, the laggards end up with lower demands for their product.

In general, competition and management factors are a minor component that applies to novice companies that are in the early stages of development. In most cases, the industries are well established in their field and have consistent performance and are indeed susceptible to Economic health and business cycles.

Low Capacity Utilization figures are not desirable. Fiscal and Monetary Policymakers ( Government and Central Banks) monitor the Capacity Utilization figures and intervene using fiscal or monetary levers to stimulate business and economy. Governments can decrease the tax burden on specific sectors to encourage them to invest capital in their growth. At the same time, Central Banks can reduce interest rates to encourage business owners to borrow money and increase business activity through expansion or investment opportunities.

 High Capacity Utilization figures are always preferable, as it indicates that the companies are running at their maximum capacity, and earning maximum achievable profit through their current business setup. When Capacity Utilization is close to 100%, the economy is performing at its peak, and it is ideal an ideal environment for investors to invest in industries. It implies that economic health is stable and growing.

Sector-wise Capacity Utilization rates difference can tell us what amount of slacks each industry is carrying and can direct investment capital into the growing industries than the slowing sectors. By comparing historical highs and lows, we can get a reference, on an industry’s current performance with regards to its peak high and low performances, to understand how it is faring right now.

Impact on Currency

Capacity Utilization is a coincident indicator that is reflective of the market environment and the corresponding policy levers executed to counter the market conditions by the Fiscal and Monetary policymakers. Hence, it gives us a current economic picture as it is a function of the market environment and policy levers.

It is a proportional indicator, where high Capacity Utilization Rates indicate healthy revenue-generating activity, which is suitable for the economy, higher GDP prints, and currency appreciates accordingly. On the other hand, decreasing Capacity Utilization Rates indicate a stagnating or deteriorating business activity, which poses a deflationary threat to the economy, or extreme cases recession, which is depreciating for the currency.

It is a low impact indicator, as the corresponding impacts would have been already priced into the market. We are saying this because policy maker’s decisions come out in the form of interest rates, tax exemptions or reductions, and through survey indicators like business and consumer surveys.

Economic Reports

The “Industrial Production and Capacity Utilization – G17” reports are published every month by the Federal Reserve in the United States on its official website. The reports are published in the formats of estimates and revised estimates.

The first estimate is released around the 15th of every month at 9:15 A.M. for the previous month. It factors in about 75% of the data. The second estimate accounts for 85%, the third estimate 94%, the fourth estimate 95%, and 96% in the fifth and sixth estimates as more of the source data becomes available after each passing month.

Sources of Capacity Utilization

The monthly Capacity Utilization statistics are available on the official website of the Federal Reserve for the United States. The St. Louis FRED website provides a comprehensive list of Industry Production, and Capacity Utilization reports on its website with multiple graphical plots. We can also find global Manufacturing Production figures for various countries in statistical formats here.

Impact of the ‘Capacity Utilization’ news release on the price charts

In the previous section of the article, we understood the meaning and significance of Capacity Utilization, which essentially talks about the manufacturing and production capabilities that are being utilized by a nation at any given point of time. If demand increases, Capacity Utilization increases, but if demand decreases, the rate will fall. Policymakers use this data for fixing interest rates and while calculating inflation in the economy. Thus, investors give a reasonable amount of importance to the data and take a stance in the currency based on the Capacity Utilization rate.

The below image shows the latest and previous Capacity Utilization rate of Japan. We see there was a decrease in Capacity Utilization in March, which means the country underutilized its resources. A higher than expected number should be taken as positive for the Japanese Yen, while a lower than expected number as negative. Let us discover the impact of the data on different currency pairs.

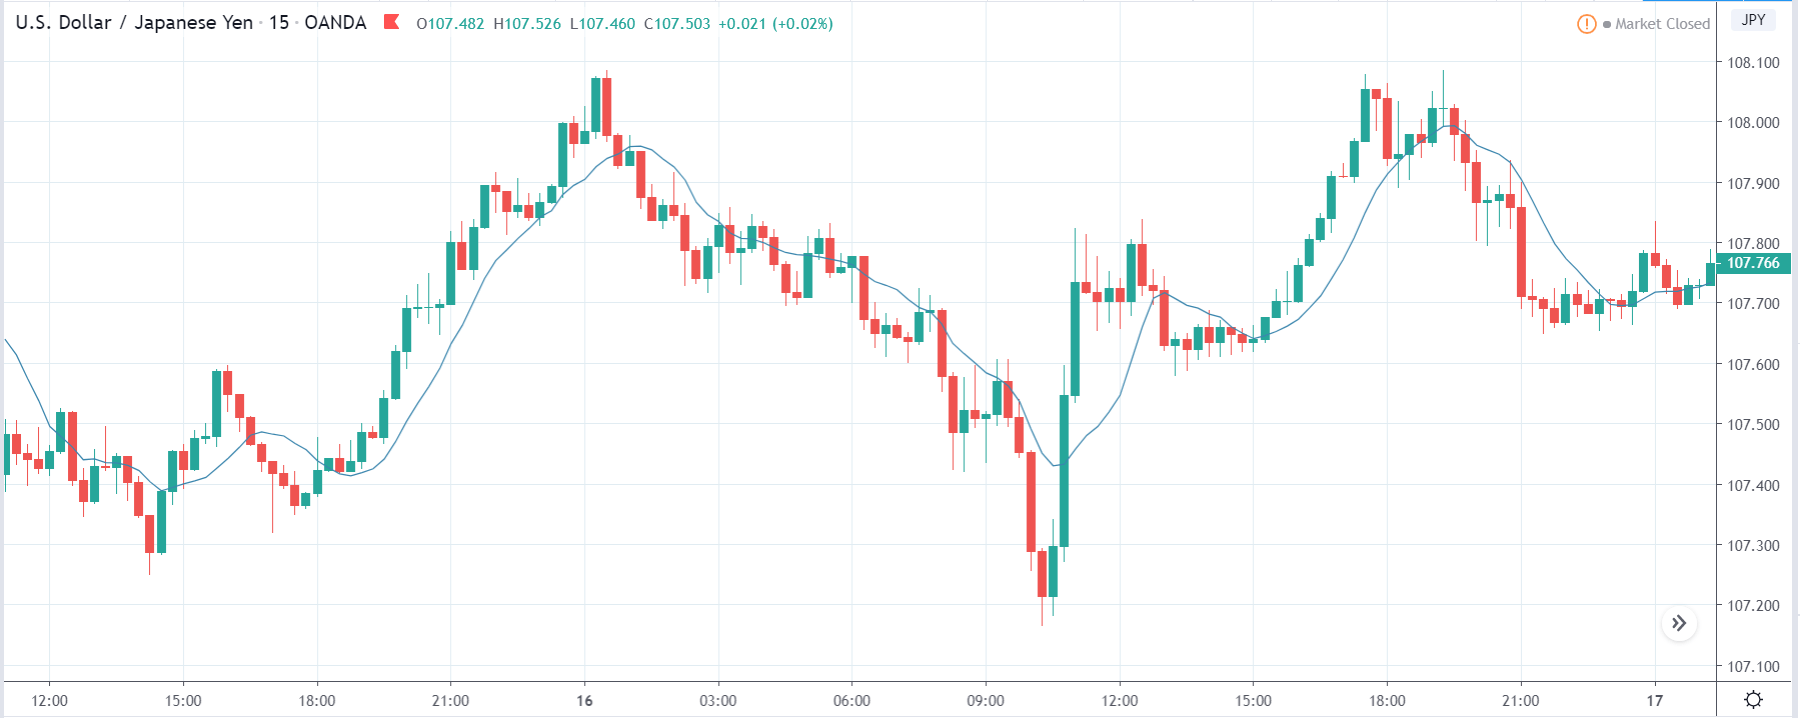
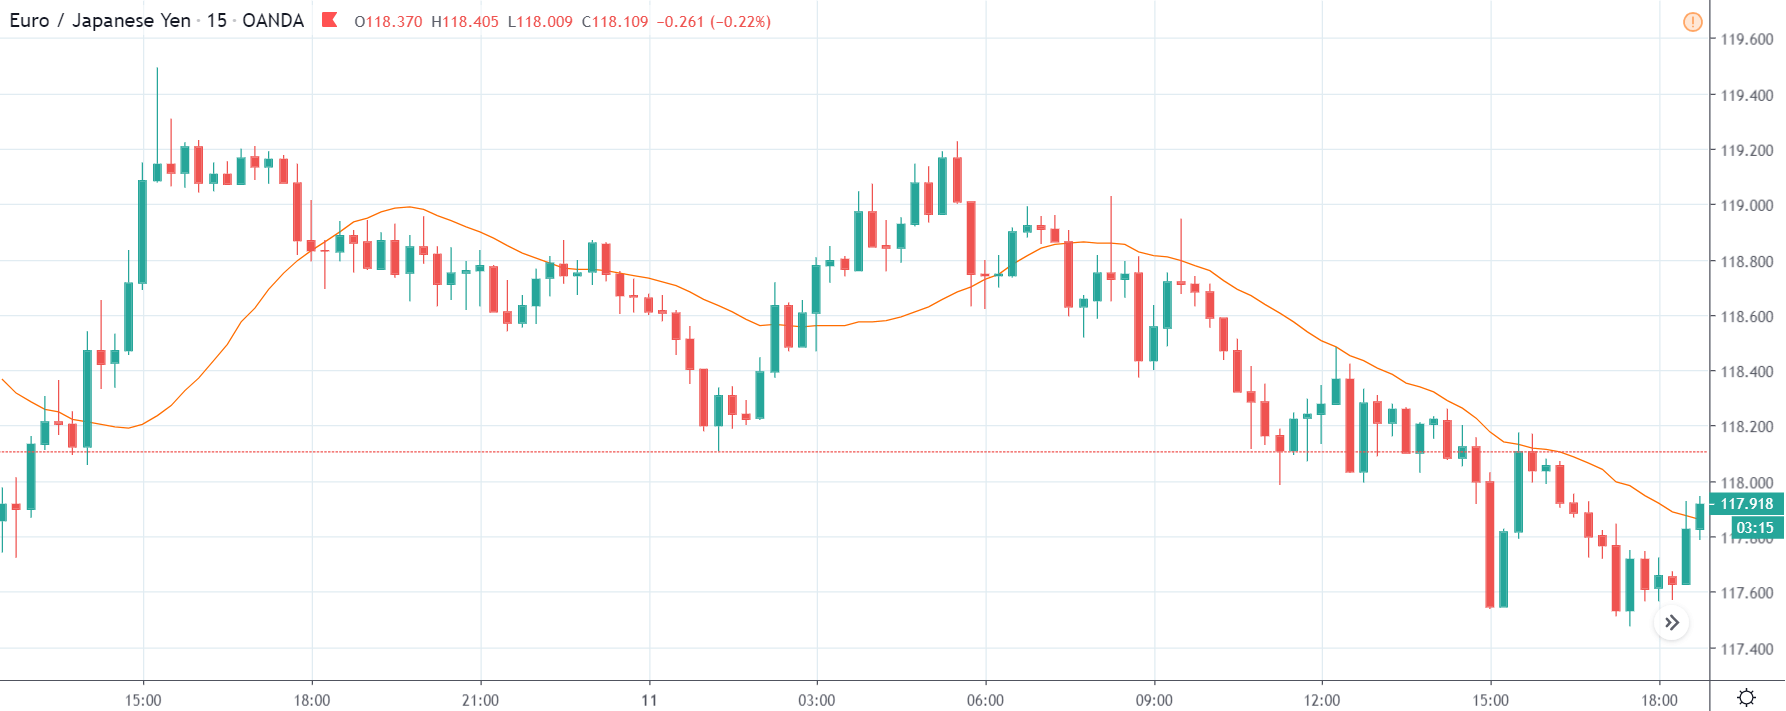
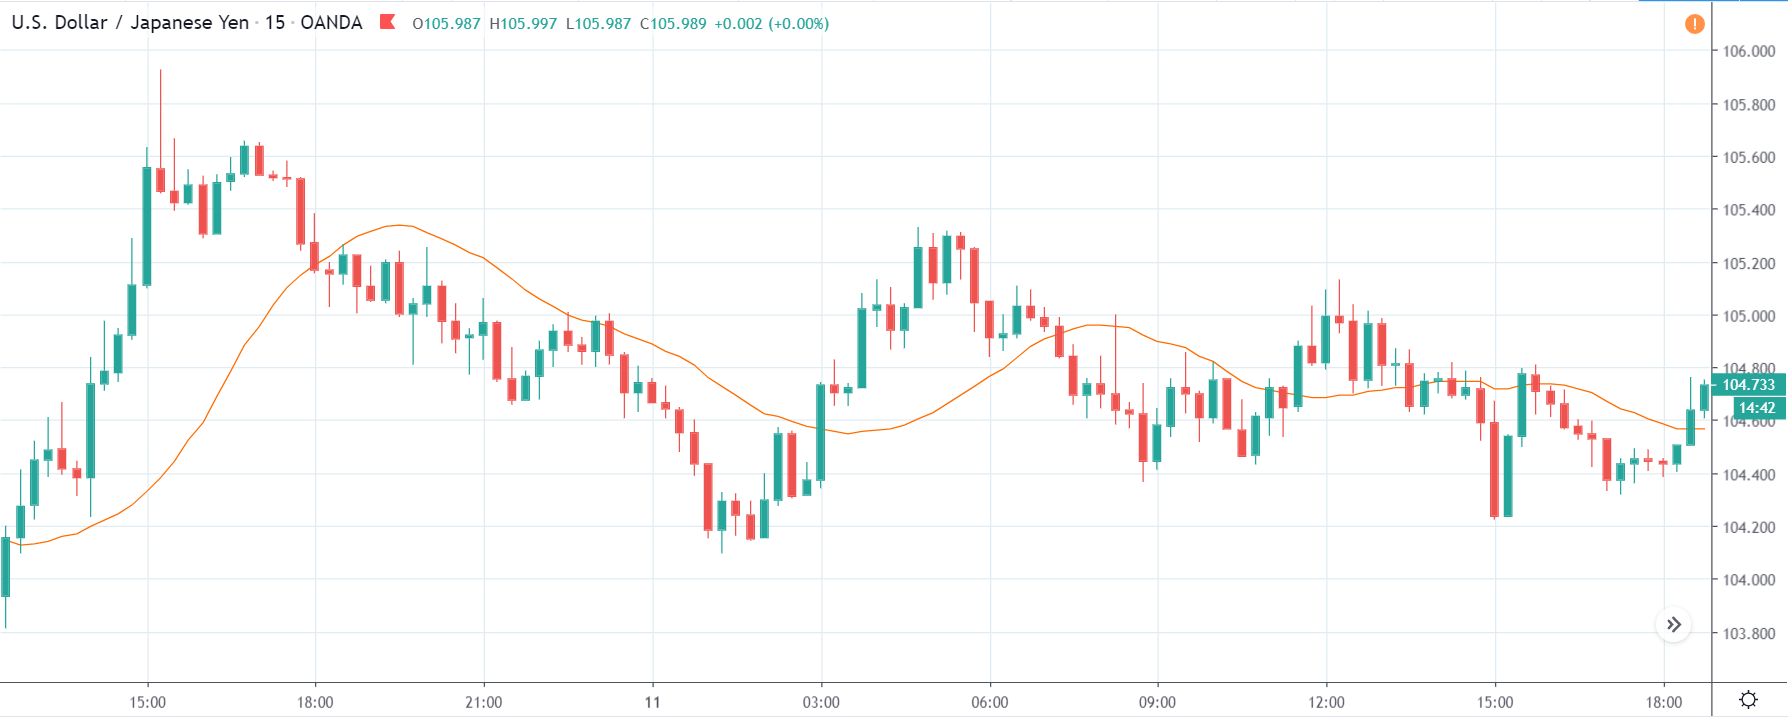
USD/JPY | Before the announcement:

We shall begin with the USD/JPY currency pair to analyze the change in volatility before and after the news announcement. The above image shows the state of the currency pair before the news announcement, where the price moving within a range broadly and currently is in the middle of the range. As there is no clarity with respect to the direction of the market, we shall be trading based on the outcome of the news.

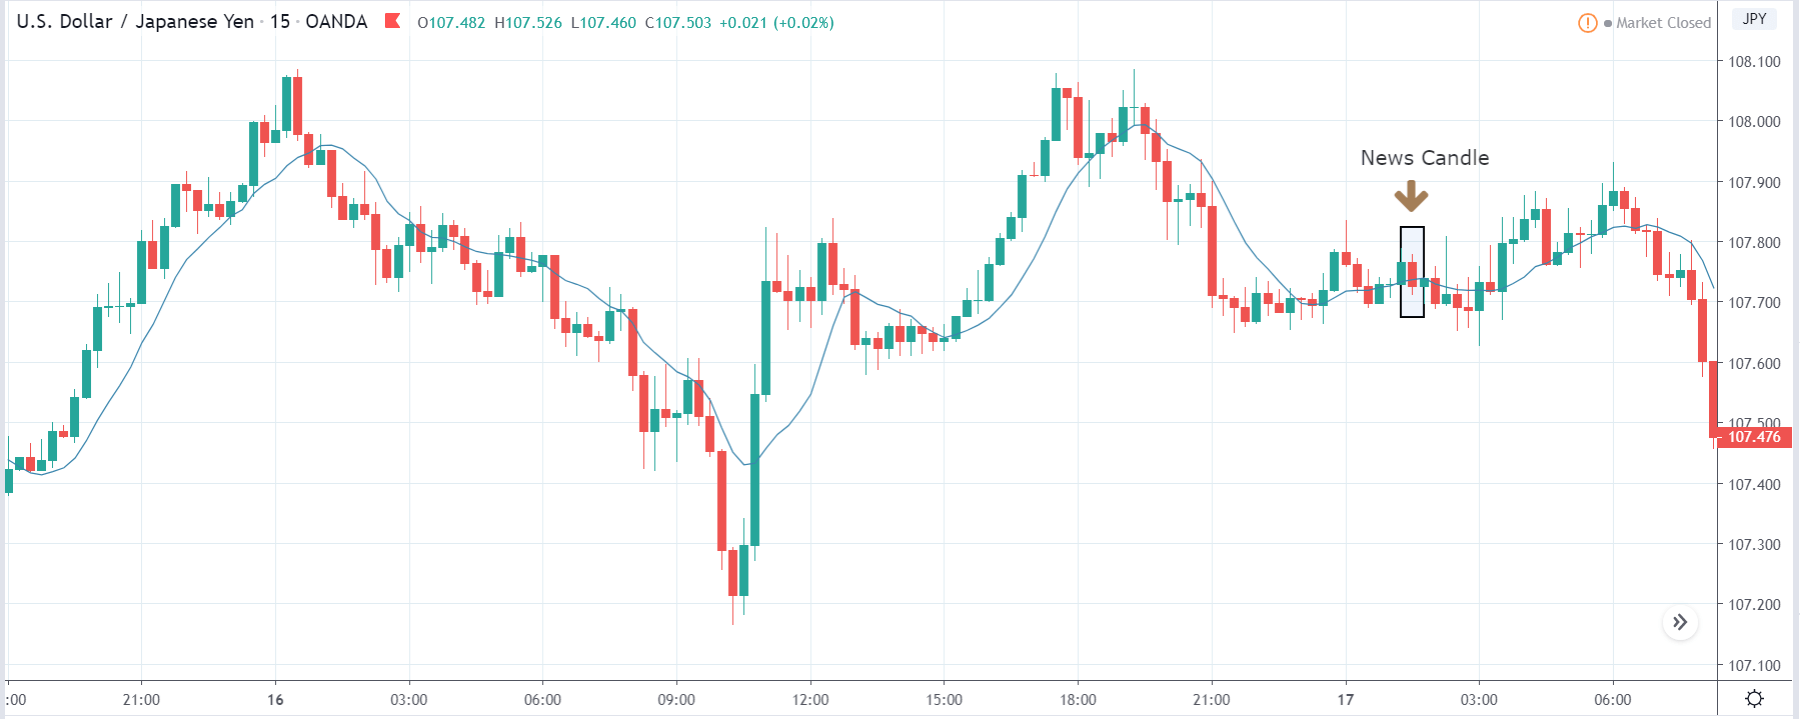
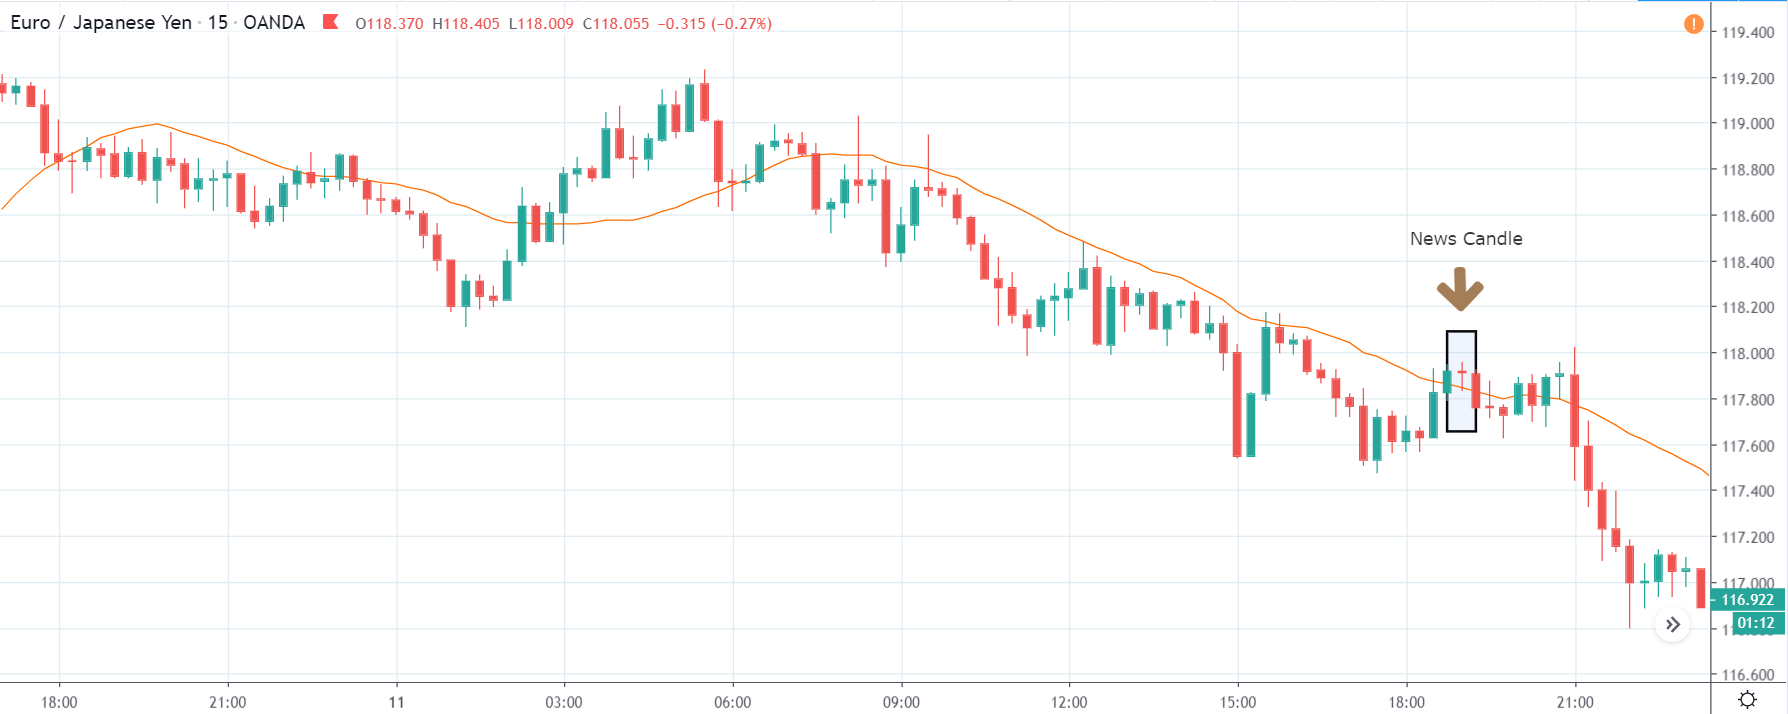
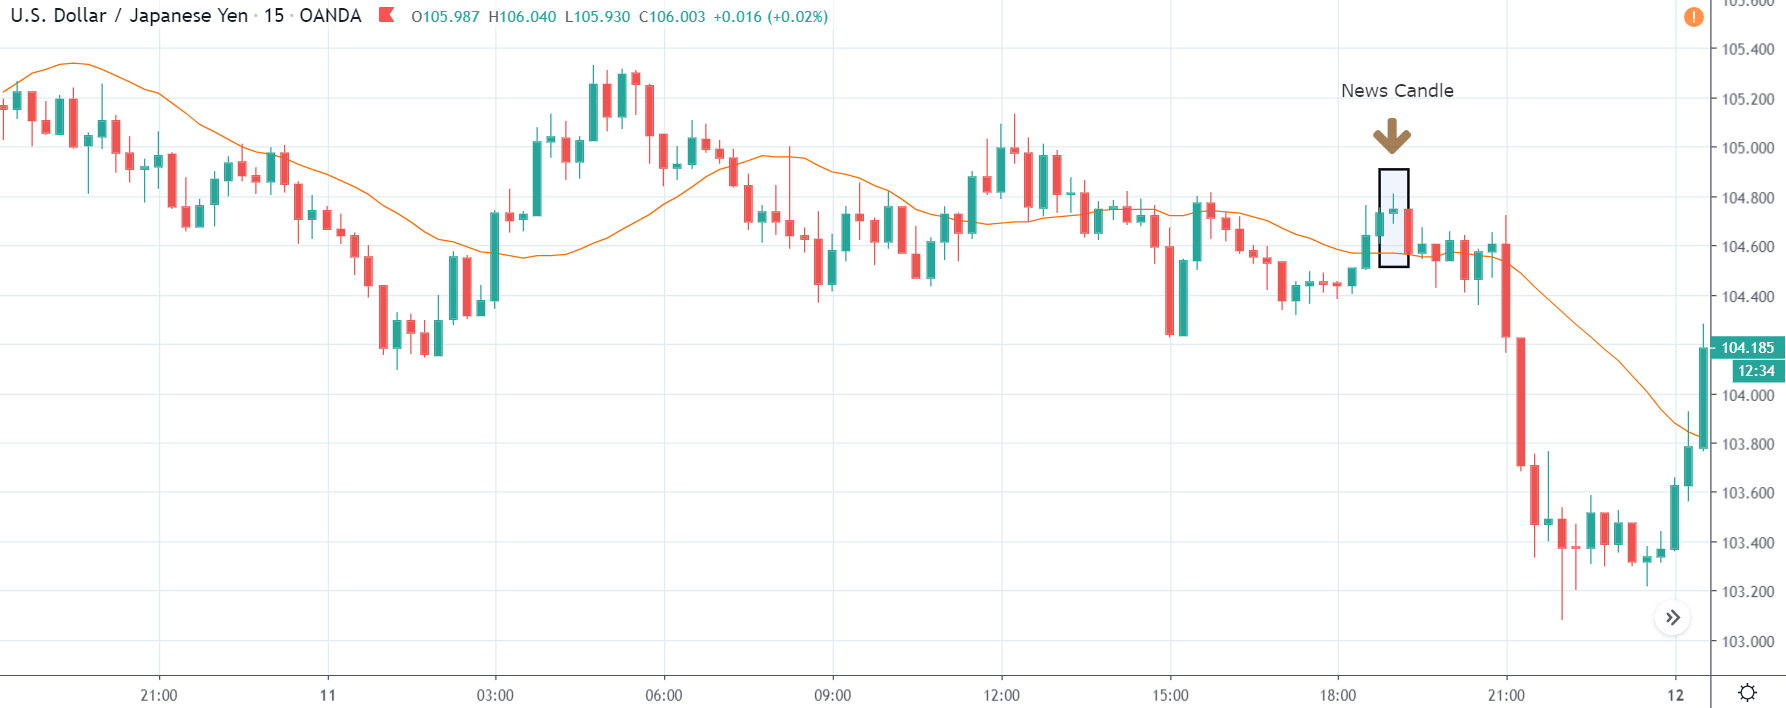
USD/JPY | After the announcement:

After the news announcement, the price falls below the moving average, and volatility increases to the downside. Even though the Capacity Utilization data was not very good for the economy, traders considered the data to be mildly positive for the economy in this case and bought the Japanese Yen. After the market has shown signs of weakness, we are now certain that the volatility will expand on the downside, and thus, we can take a ‘short’ position with a stop loss above the ‘resistance’ of the range.

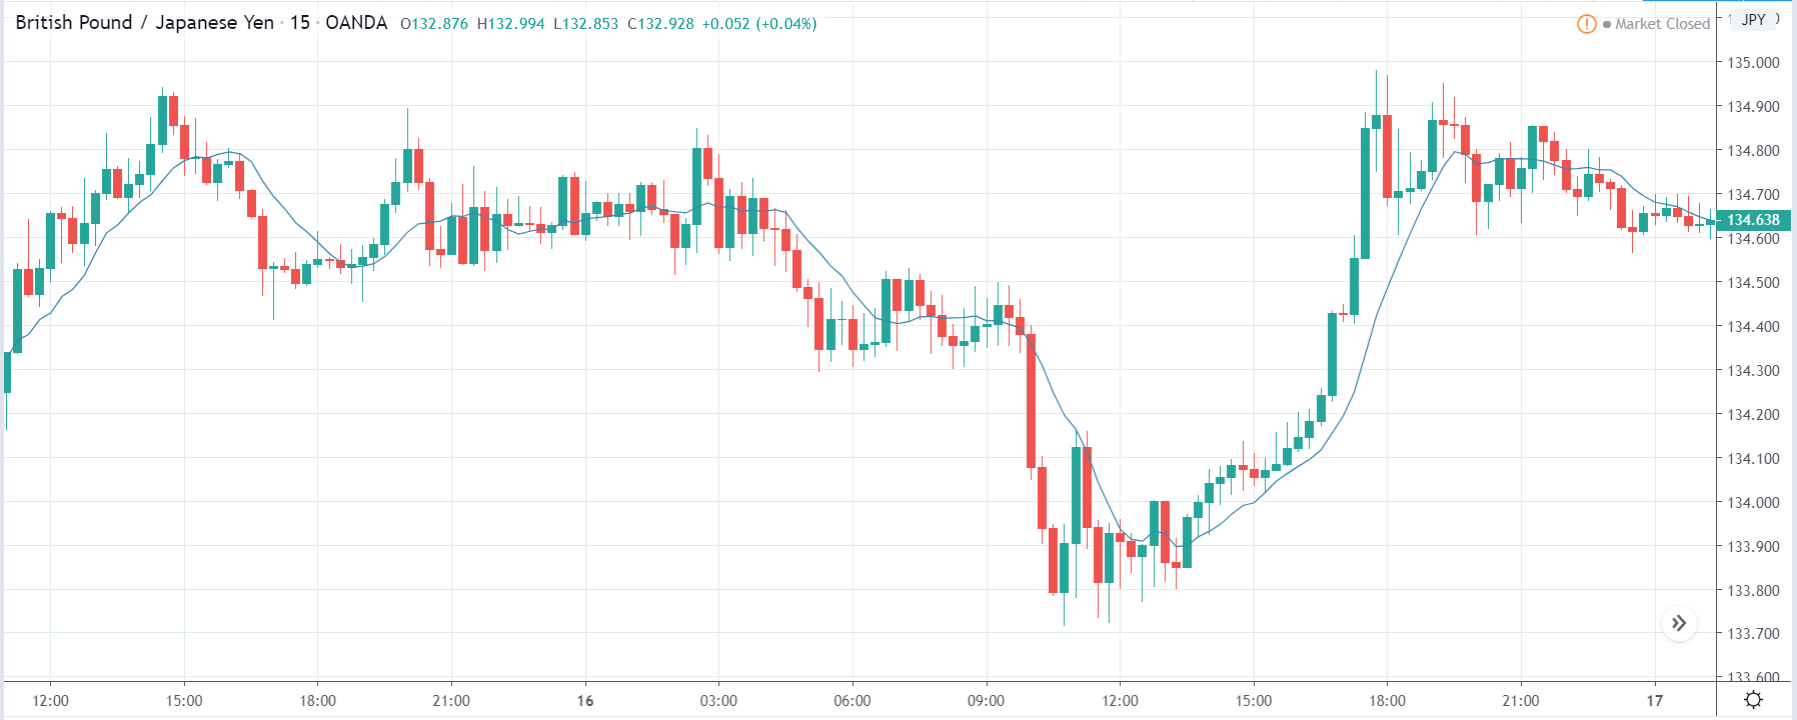
GBP/JPY | Before the announcement:

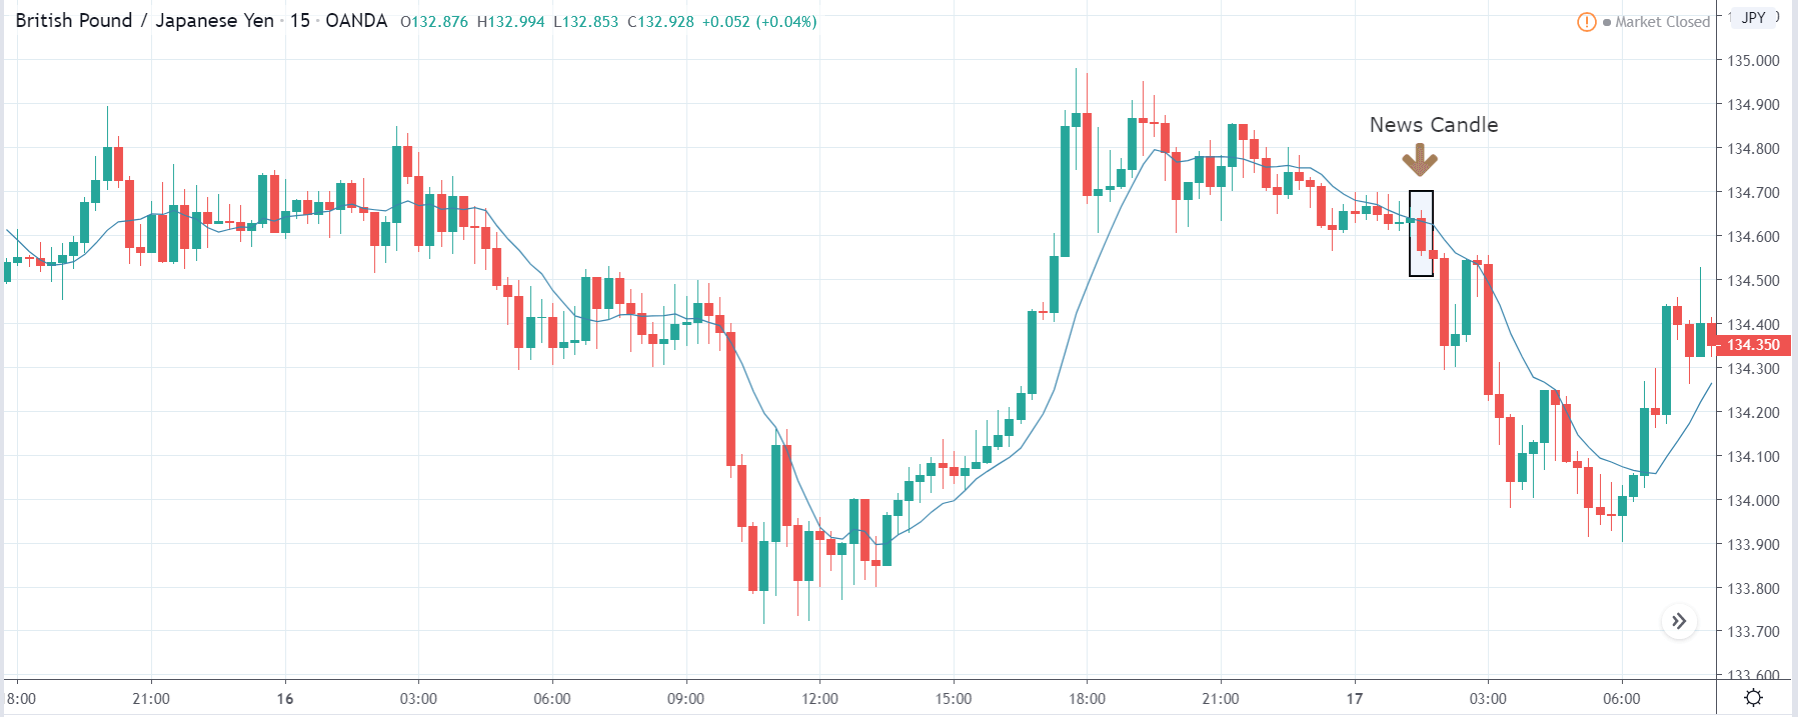
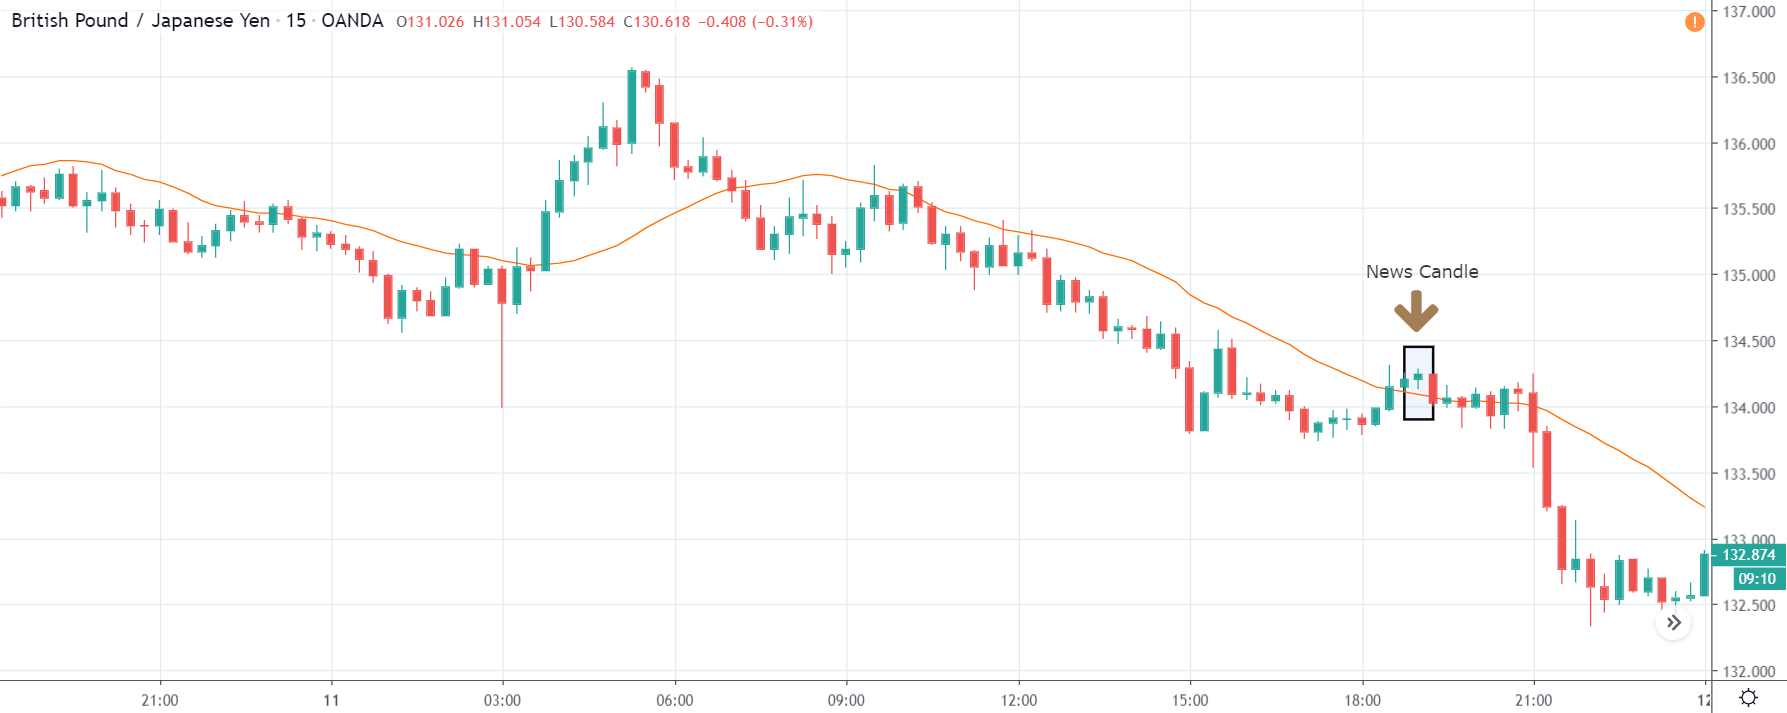
GBP/JPY | After the announcement:

The above images represent the GBP/JPY currency pair, where we see that before the announcement, the price has started to move in a ‘range’ after a large move on the upside. This also a place from where the market had reversed earlier, thus we need to trade with caution, as we are not sure where the market will head now.

After the news announcement, the price crashes and sharply moves lower. The Capacity Utilization data proved to be positive for the Japanese Yen, and traders went ‘short’ in the currency pair, thereby strengthening the currency furthermore. This is our final confirmation for taking a ‘short’ trade and taking entry as the volatility increases to the downside.

AUD/JPY | Before the announcement:

AUD/JPY | After the announcement:

The above images are that of the AUD/JPY currency pair, where in the first image, we see that the market is in a strong uptrend indicating a great amount of weakness in the Japanese Yen. Technically, we should be looking for buying the currency pair after a suitable price retracement to the ‘support’ area, but a news release can change the entire plan. Thus, we need to wait and see what the news outcome does to the currency pair.

After the news announcement, volatility slightly increases to the downside, and the ‘news candle’ barely closes in red. This means the impact of Capacity Utilization was least on this currency pair that did not result in huge volatility in the pair. As the overall trend is up, a ‘short’ trade can be very risky as the risk to reward ratio is not in our favor.

That’s about ‘Capacity Utilization’ and its impact on the Forex market after its news release. If you have any questions, please let us know in the comments below. Good luck!

Categories
Forex Options

FX option expiries for May 11 New York cut

Thank you for visiting the Forex.Academy FX Options Expiries Section. Each day, where available, we will bring you notable maturities in FX Options of amounts of $100 million-plus, and where these large commutative maturities at specified currency exchange rates often have a magnetic effect on price action, especially in the hours leading to their maturities, which happens daily at 10.00 AM Eastern time. This is because the big institutional players hedge their positions accordingly. Each option expiry should be considered ‘in-play’ if labelled as Hot, Warm or ‘out of play’ if labelled Cold with regard to the likelihood of price action meeting the strike price at maturity.

…………………………………………………………………………………………………………………..

FX option expiries for May 11 New York cut

FX option expiries for May 11 NY cut at 10:00 Eastern Time, via DTCC, can be found below.

– EUR/USD: EUR amounts

  • 1.0800 892m
  • 1.0850 1.0bn


– USD/JPY: USD amounts         

  • 106.25 410m
  • 106.40 511m
  • 106.70 588m


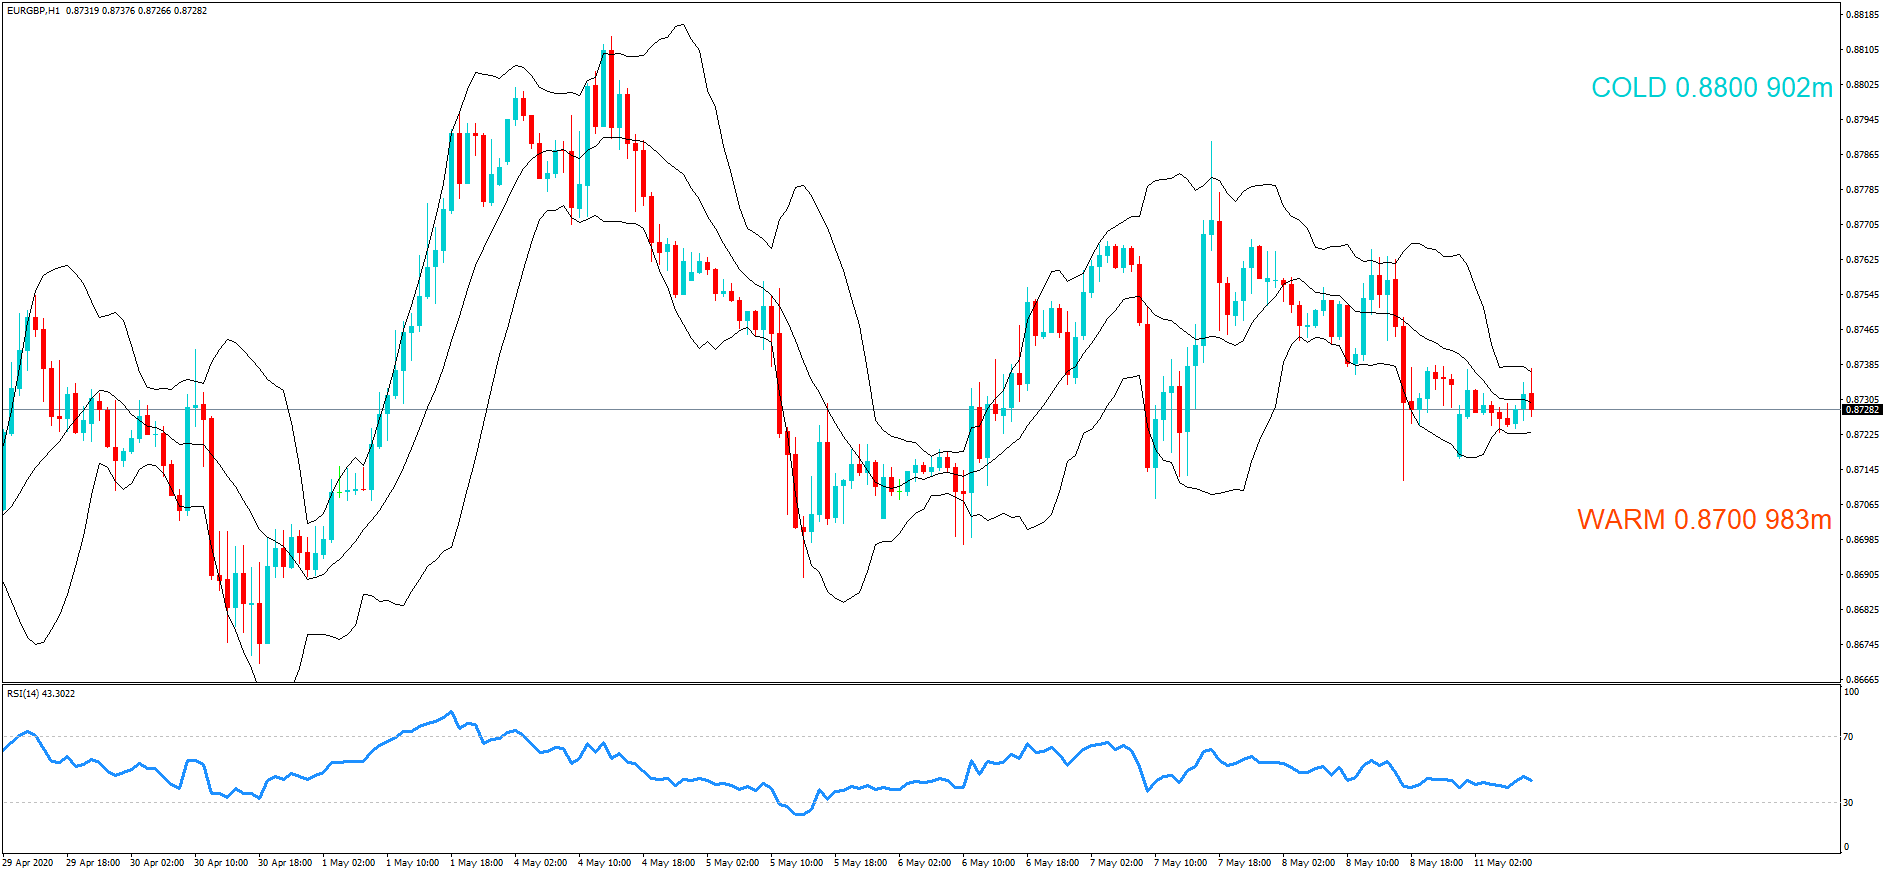
– EUR/GBP: EUR amounts

  • 0.8700 983m
  • 0.8800 902m

………………………………………………………………………………………………………………

As you can see on the charts we have also plotted the expiration levels at the various exchange rate maturities and we will also labelled them as cold, warm or hot.

Therefore, if you see exchange rates labelled as warm or hot, these should be considered In-Play, because we believe there is a greater chance of the expiry maturing at these levels based on technical analysis at the time of writing. However, if we have labelled them as Cold, they should be considered Not In-Play and therefore price action would be unlikely to reach these levels, which are often referred to as Strikes, at the time of the New York cut. Please bear in mind that we have not factored in upcoming economic data releases, or policymaker speeches and that technical analysis may change in the hours leading up to the cut.

We suggest you take the levels and plot them onto your own trading charts and incorporate the information into your own trading methodology in order to use the information to your advantage.

Remember the higher the amount, the larger the gravitational pull towards the exchange rate maturity at 10:00 AM Eastern time.

If you want to learn how forex option expiries affect price action in the spot FX market see our educational article by clicking here: https://bit.ly/2VR2Nji

DISCLAIMER: Please note that this information is for educational purposes. Also, heat levels may change throughout the day in line with the exchange rate fluctuations due to technical analysis trading and upcoming economic data releases of the associated pairs.

Categories
Forex Fundamental Analysis

Comprehending ‘Credit Rating’ & Its Importance as a Macro Economic Indicator

Introduction

The credit rating of an institution, organization, the government is like a pseudo report card of its ability to pay back its debt. The credit rating process is thorough and detailed. The credit rating of a country or a government, in that case, can significantly impact the inflow of domestic and foreign Investments. It is one of the major indicators around which a lot of volatility occurs in the financial markets; therefore, understanding the credit rating system is important.

What is Credit Rating?

Credit Scoring

Among the general population, people who have a job are usually aware of a credit score that is attributed to them buy one or more agencies within that country. For example, in India, CIBIL, which stands for Credit Information Bureau (India) Limited, is the primary agency that assigns credit rating to individuals.

The credit rating of an individual largely determines the eligibility to apply for a loan from any financial institution. A high score would indicate that the individual is capable of repaying on time, and conversely, a low score would mean that there is a high risk of defaulting on repayment by the individual. The credit score of an individual takes into account the history of loans, repayment records and past defaulting records, and his current net income. Based on all these factors, the calculated score then tells their worthiness of credit.

For example, a CIBIL score greater than 750 in India is usually seen as a minimum requirement to be eligible for a loan by most banks. The individual usually seek out to maintain a high CIBIL score to be eligible to borrow a higher amount of loan and lower interest rates as a lower score would greatly diminish their loan eligibility, and even if they do get a loan, they will have to pay higher interest rate than people with a good CIBIL score.

Credit Rating 

Credit scoring applies to individuals within a country, whereas credit rating applies to institutions, organizations, and governments. Similar to credit scoring credit rating tells whether that organization is credit working or not.

Credit rating becomes important as here the borrowers are big institutions, government, large financial organizations, and the lenders are also big investors or foreign bodies. The loan amount is high, often ranging in millions and billions, and the duration of the loan is also long. Hence, investors actively seek credit ratings before deciding to purchase a particular Bond and lending their money.

How are the Credit Ratings calculated?

There are many globally popular credit rating agencies. In the United States, three companies, namely, Fitch Ratings, Standard and Poor’s Global (S&P Global), and Moody’s Corporation, are the most famous and sought after agencies.

The credit rating process is very thorough and accounts for the entity’s entire debt and its repayment history. The process requires credit rating from the agency to meet with the organization and going over their financial records to assess their current financial status and assess their eligibility. They also take into account that past loan repayments and spending patterns, their current financial assets, and future economic prospects.

After this, a group of credit raters will work out the credit rating for that organization. The process may take up to 4 weeks in general. When the credit rating is ready, it is given out to the company and for a press release. The credit rating agencies usually follow an alphabet combination rating system.

For example, according to Standard and Poor’s Ratings, an organization having AAA rating is said to be outstanding, which is the highest rating possible. Next below is AA+, which means excellent this goes down a rating of D, which is the lowest score. The formats of writing may vary slightly from company to company, but in general, they have an understandable notation of alphabet combinations.

Are Credit Ratings important?

The credit ratings became particularly important after the 1936 rule, which restricted Financial Institutions to lend money to speculative bonds, i.e., having low credit ratings in other words.

Many companies now actively seek to get their credit rating assessed to gain the confidence of investors. The financial markets also have seen enough market crashes, the system collapses, and payment defaults even by the most reputed organizations and nations also. The European debt crisis and the Greece default one of the most popular instances wherein national level collapse of financial institutions and debt default occurred in the recent times of 2010-2011.

In one sense, there is a link between capital inflow and credit rating, hence government and financial corporations, when requiring money, the credit rating becomes a significant number.

The credit rating is not a performance report for a particular set year; instead, it is a continuously updated statistic that tells the credibility of the entity at the current time. For example, a country with the best credit rating last year may not have the same rating this year. The credit rating cuts through all the false alarms and directly gauges the financial numbers, which always tell the truth.

Hence, once the agencies publish credit ratings for a particular sovereign body, there tends to be a lot of volatility as investors either become gain or lose confidence in that body. Conversely, a decreased credit rating than the previous number, also stirs down the market in a negative direction.

Credit ratings, particularly sovereign credit ratings, are major indicators for investors, and hence the government bodies take utmost attention to loan repayment to avoid defaulting and thereby spoiling their credit rating, which will cost them future monetary indentures. Government bodies are aware that decreased credit rating will result in foreign investors stepping back, and consequently, losing their funding, which can, in extreme cases, lead to a total collapse of the institution or an economy at a large scale.

How can the Credit Ratings be Used for Analysis?

An institution with a low credit rating is considered a high-risk investment as the prospects of that company being able to repay is low.

A decrease in the sovereign credit rating signals an economic slowdown from which the country may take a significant time to recover. Conversely, a high credit rating for sovereign bodies and conglomerates indicates that the economy is stable and growing, and there are ample financial resources to pay back the debt on time.

Credit ratings are released quarterly, usually, after the financial numbers of the organization are released. They can be used as current macroeconomic indicators and also be used to predict future expansion plans of the borrowing party, as an institution borrows money to expand or invest in its growth.

Sources of Credit Rating Reports

For reference, Fitch credit ratings are published frequently on their official website.

Since Credit Rating is a major indicator, media coverage is huge and is easily available across the internet. For reference, this is a rating table given in Wikipedia.

Impact of the ‘Credit Rating’ news release on the price charts 

After understanding the meaning and significance of Credit Rating in a country, we shall now see the impact it makes on the currency after the Ratings are declared. There are many agencies that give Ratings to different countries, but the two most reliable and followed are the Ratings given Fitch and Standard and Poor’s (S&P). In today’s article, we will be analyzing the Credit Rating of the United Kingdom announced in the month of December. Credit Rating is said to be a major event in both the forex and stock market, which has a long-lasting effect on the value of a currency. Therefore, the rating could largely determine the degree of volatility in the currency pair.

In forex trading, Credit Rating is used by sovereign wealth funds, pension funds, and other investors to gauge the creditworthiness of a county, thus having a big impact on the country’s borrowing costs. As we can see in the above image that Fitch’s Credit Rating for the United Kingdom was last reported at AA with a negative outlook. Since the rating was unhealthy for the economy, let us see how the market reacted to this.

GBP/CAD | Before The Announcement
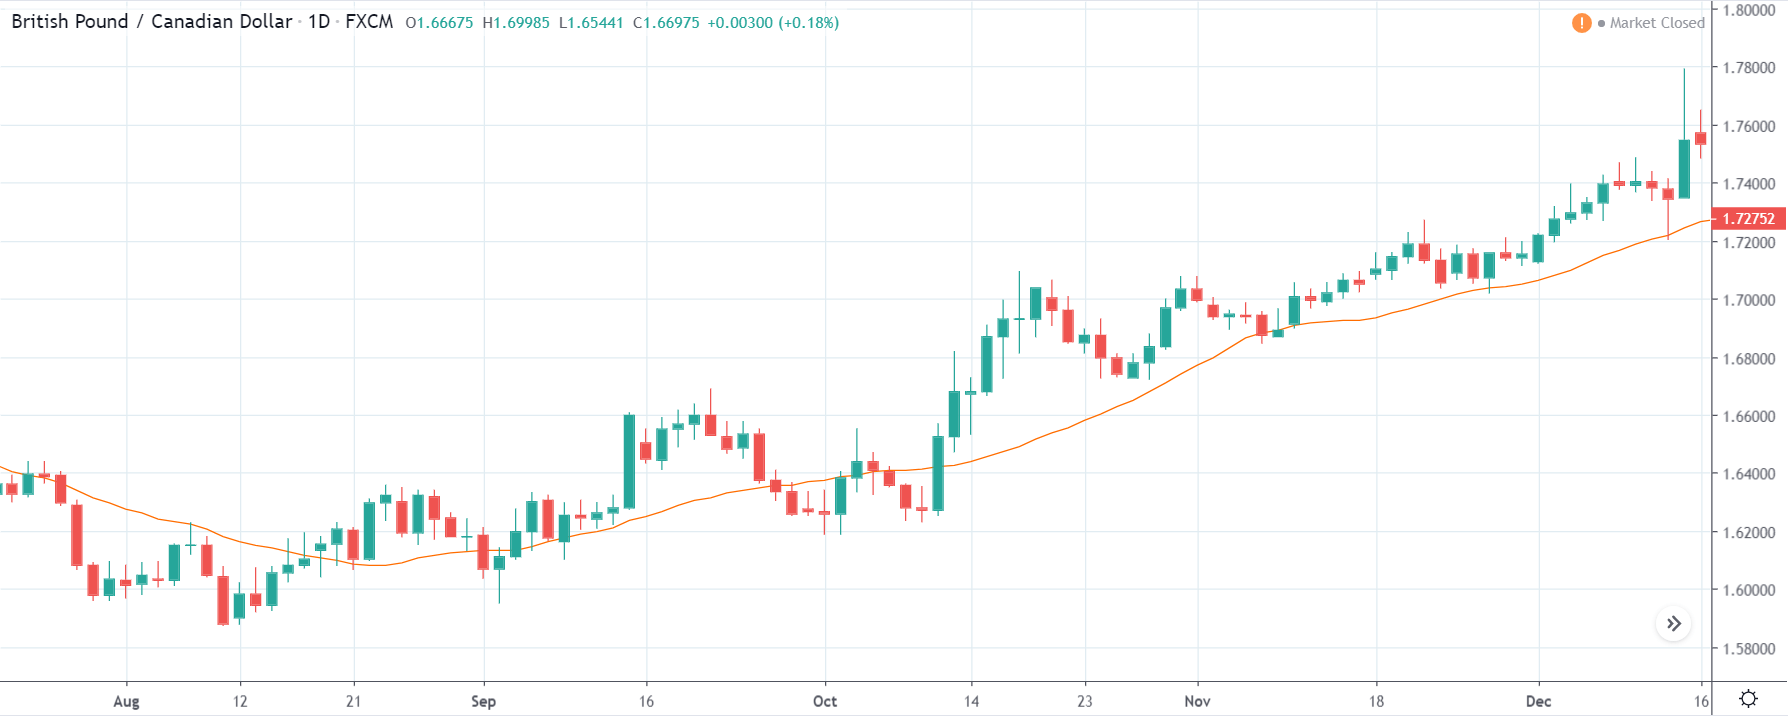
As the Credit Rating announcement is one of the biggest data releases of a country, volatility caused by the news release can be witnessed more clearly on a daily time-frame chart. Likewise, we have considered the ‘daily’ chart of GBP/CAD that shows an uptrend market. As we do not have any forecasted data available for the same, we cannot take any position in the market based on predicted ratings. The only way we position ourselves in the market before the news announcement is through the ‘options’ segment, where we can essentially take advantage of the increase in volatility on either side.

GBP/CAD | After The Announcement
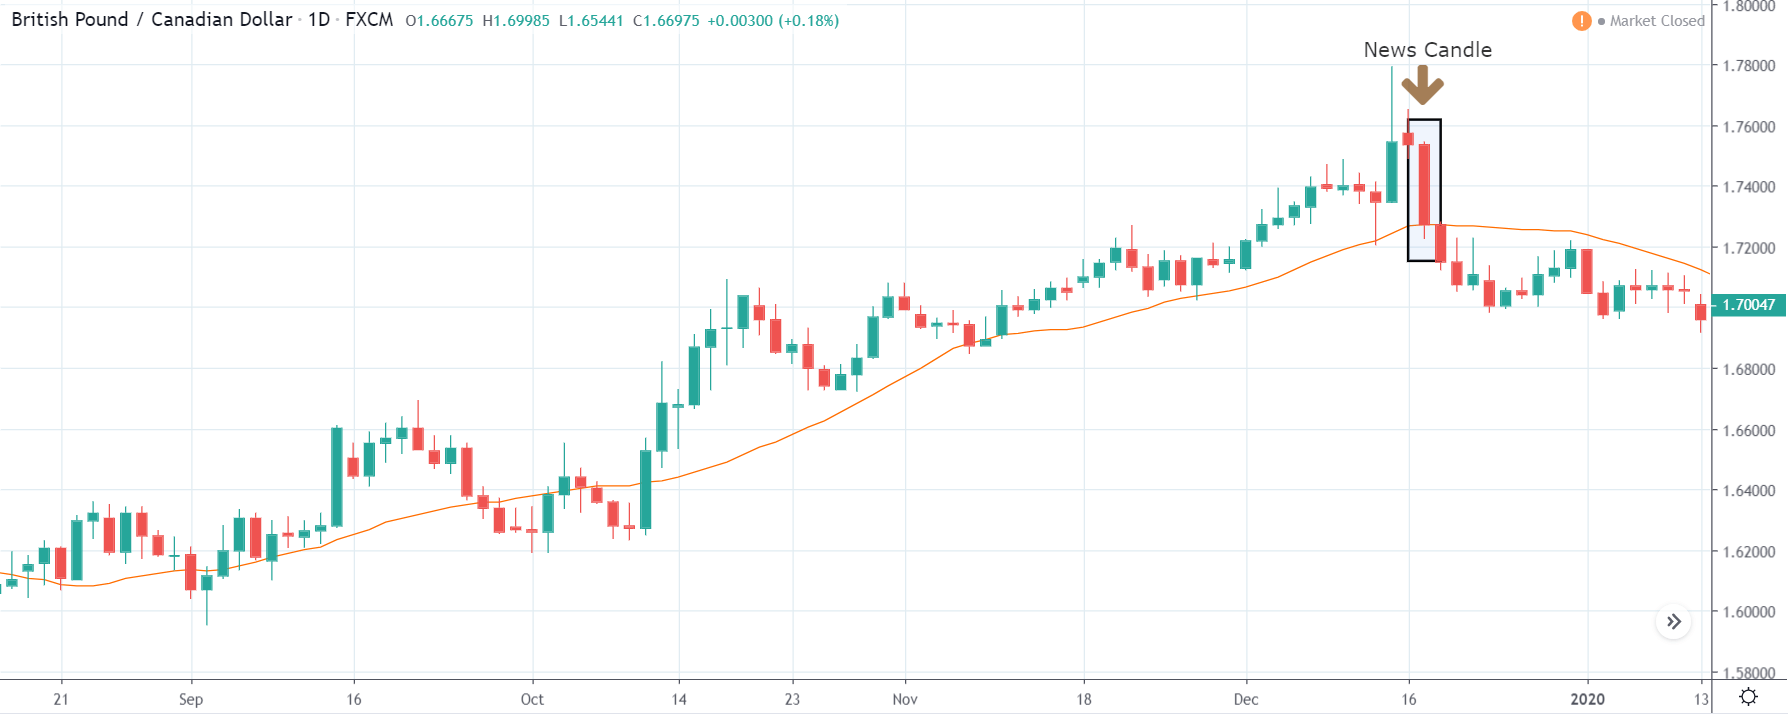
On the day of the Credit Rating announcement, we see that the market falls by more than 500 pips resulting in a complete reversal of the trend. This shows the extent of the impact of Credit Rating on a currency pair. The reason behind the collapse of the British Pound is negative Credit Rating given by the two most renowned agencies.

This rating is used by institutional investors and fund managers to decide if they want to park their cash in the economy. Therefore, when the rating is downgraded, investors withdraw their money from the market and sell British Pound. From a trading point of view, one can take a ‘short’ position in the market with a high much higher ‘take profit’ since the market has the potential to go much lower.

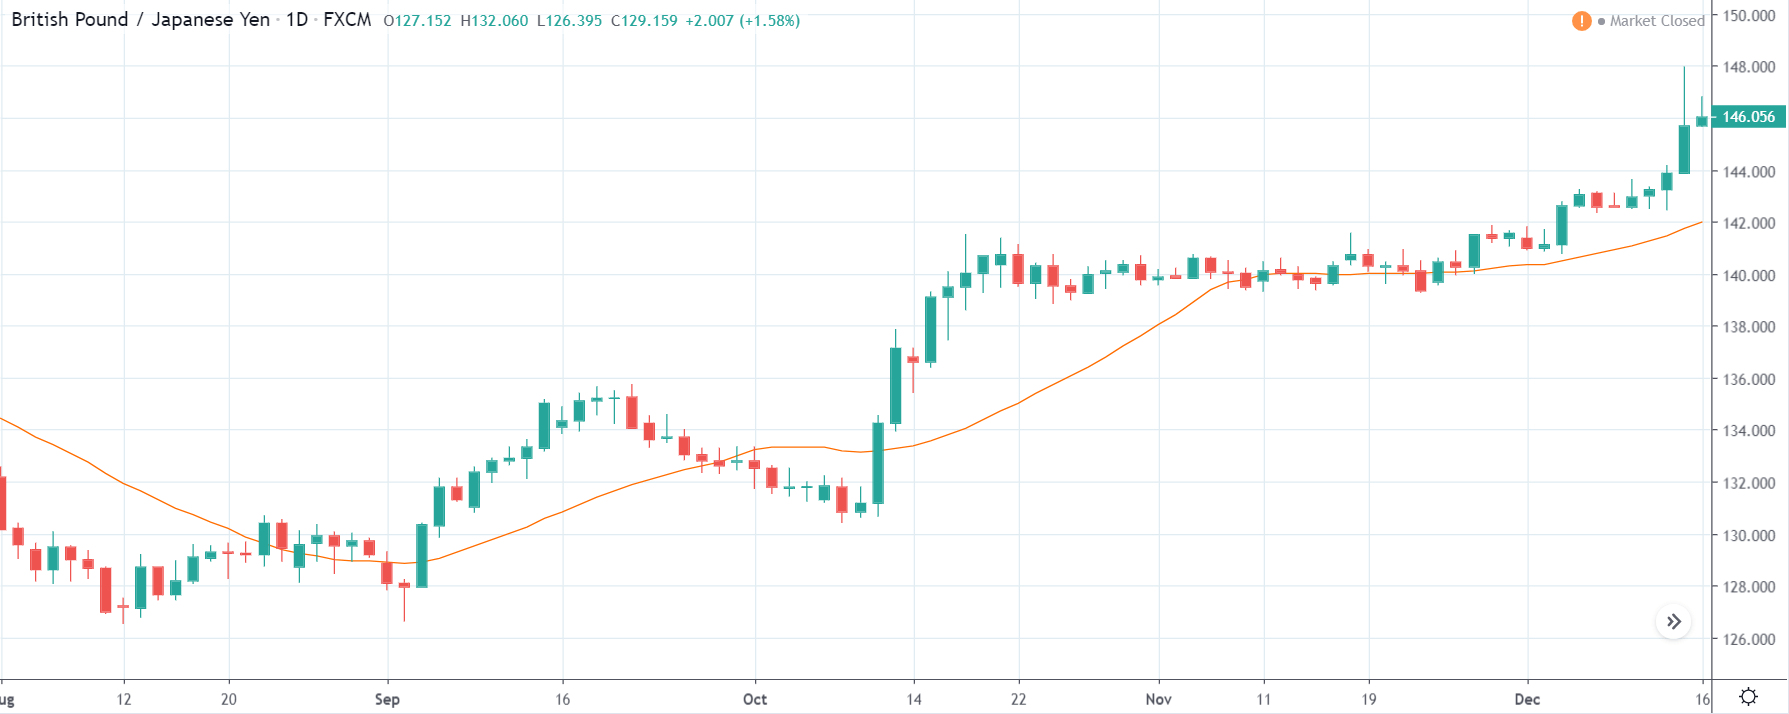
GBP/JPY | Before The Announcement
GBP/JPY | After The Announcement
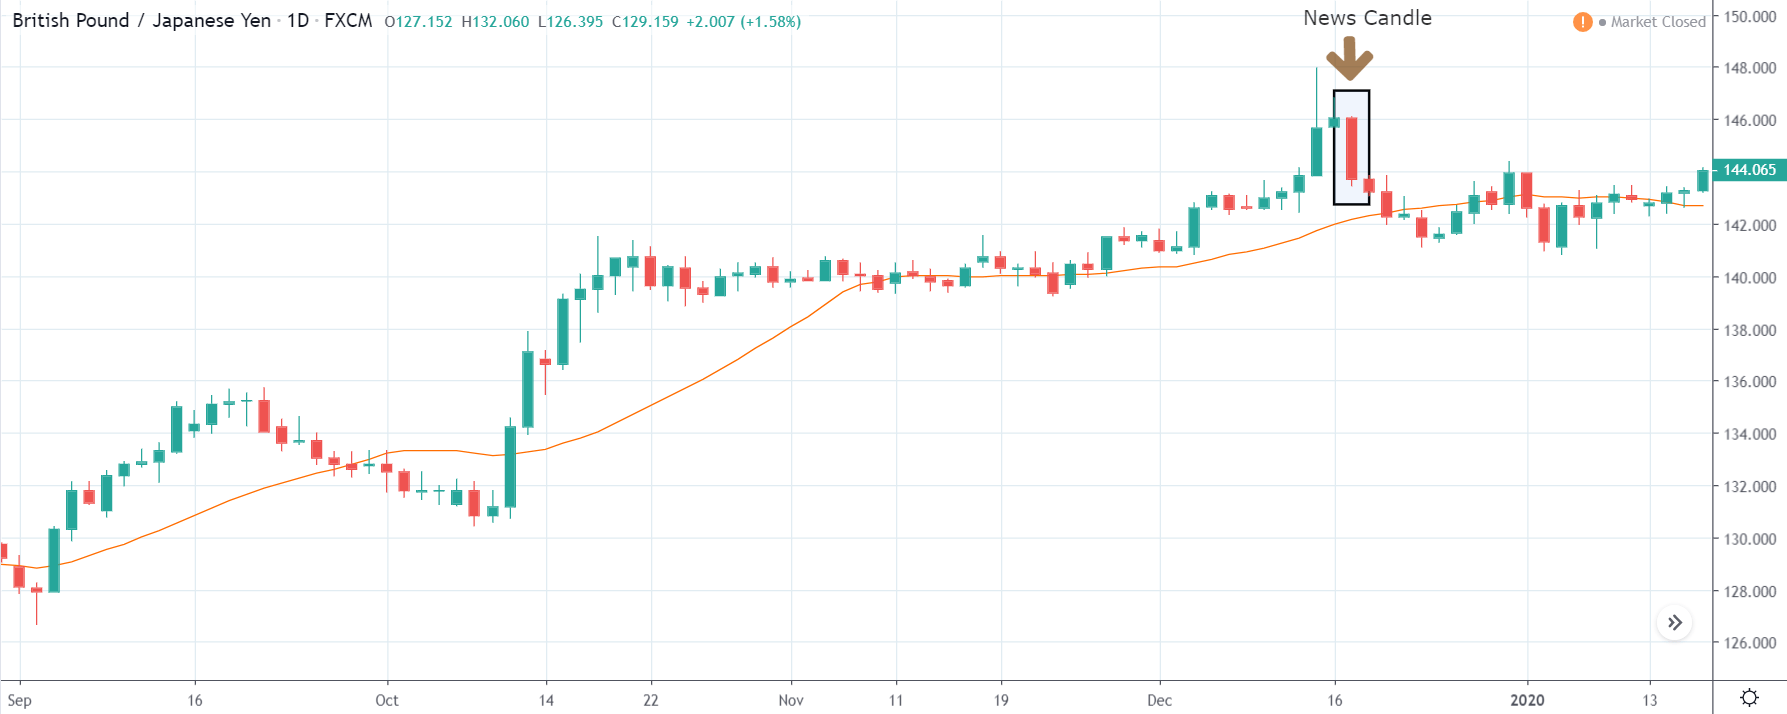
The above images represent the GBP/JPY currency pair where the chart characteristics are almost the same as that of the GBP/CAD, but with a difference that, the uptrend is more extended in this pair. When the market is trending strongly in one direction, we need to cautious while making trades in the opposite direction of the market. Here too, since we are not sure of the Credit Rating data, we cannot position ourselves on any side of the market.

After the news announcement, the British Pound falls but as much as in the above case. There is an increase in volatility on the downside but not sufficient enough to take a ‘short’ trade. Another reason behind a lesser fall in price could be the weakness of the Japanese Yen. Also, the price, even after bad news, is still above the moving average.

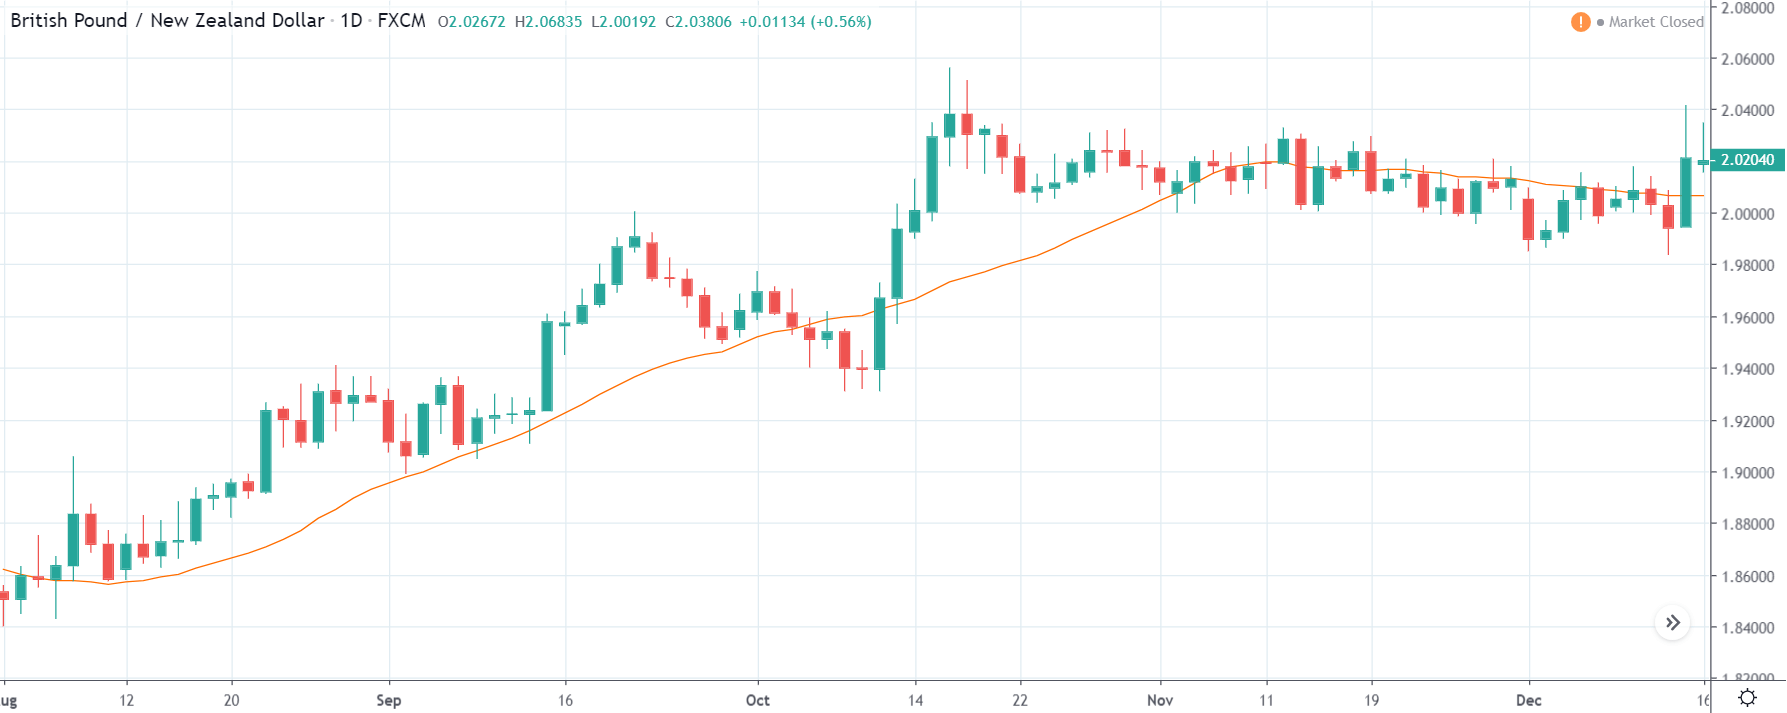
GBP/NZD | Before The Announcement
GBP/NZD | After The Announcement
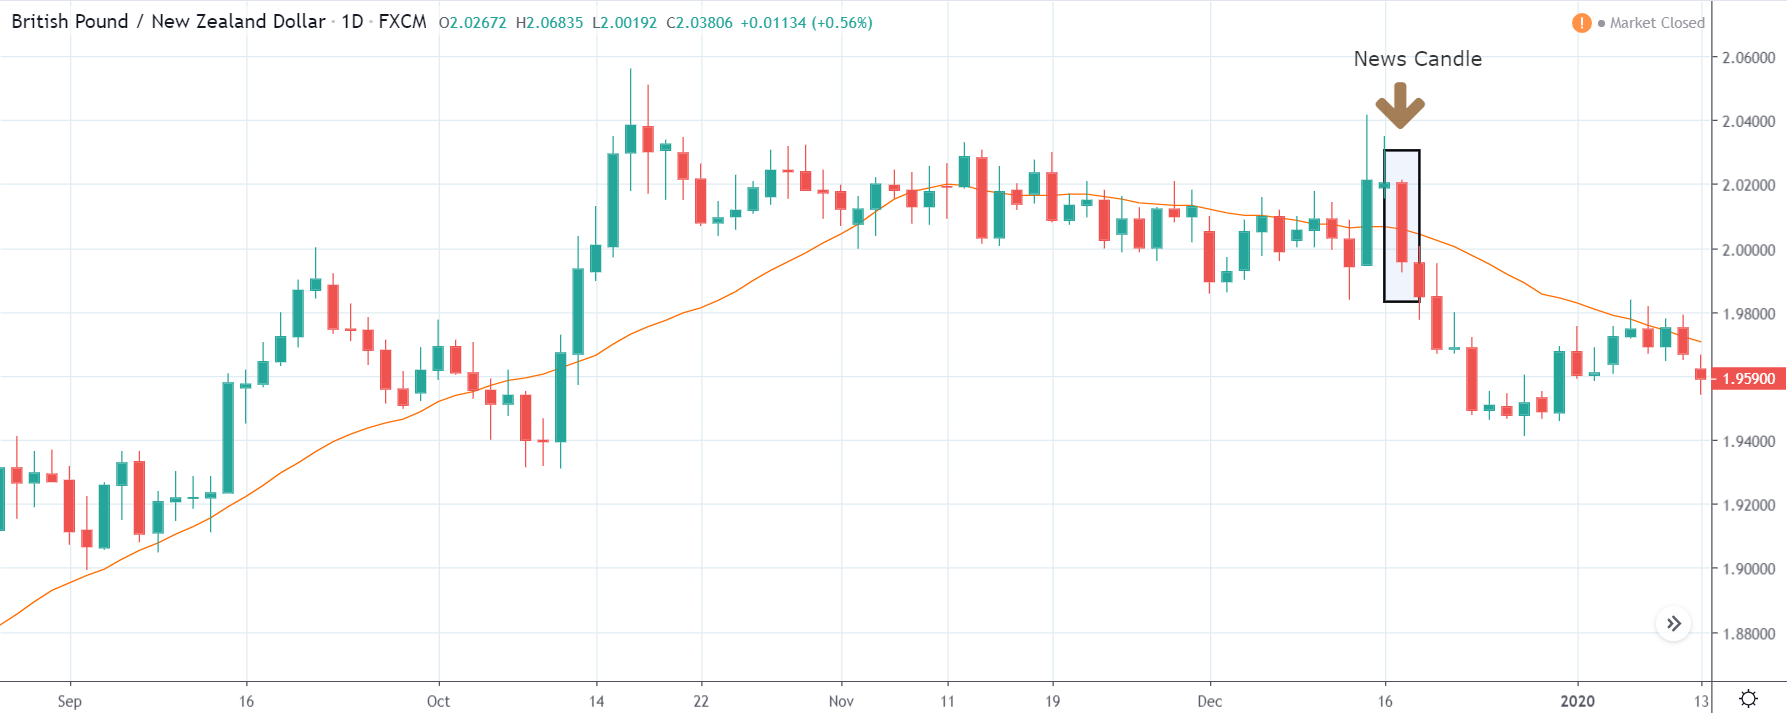
In GBP/NZD currency pair, before the Credit Ratings are declared, we can see that the market is showing signs of weakness. Since the overall trend is up, we need to wait for the news release and get a confirmation from the market. We can still trade in the ‘options’ segment of the market and profit from the increased volatility on either side after the news announcement.

After the Credit Rating data is announced by different agencies, the market falls, and volatility increases on the downside. This is a result of the negative Credit Rating given to the United Kingdom, which disappointed the market participants. Since the market was already showing weakness, this could prove to be the best pair to go ‘short’ with a much higher risk-to-reward ratio.

That’s about ‘Credit Rating’ and its relative impact on the Forex market after its news release. If you have any queries, let us know in the comments below. Cheers!

Categories
Forex Options

FX option expiries for May 8 New York cut

Thank you for visiting the Forex.Academy FX Options Expiries Section. Each day, where available, we will bring you notable maturities in FX Options of amounts of $100 million-plus, and where these large commutative maturities at specified currency exchange rates often have a magnetic effect on price action, especially in the hours leading to their maturities, which happens daily at 10.00 AM Eastern time. Each option expiry should be considered ‘in-play’ if labelled as Hot, Warm or ‘out of play’ if labelled Cold with regard to the likelihood of price action meeting the strike price at maturity.

…………………………………………………………………………………………………………………..

FX option expiries for May 8 New York cut

FX option expiries for May 8 NY cut at 10:00 Eastern Time, via DTCC, can be found below.

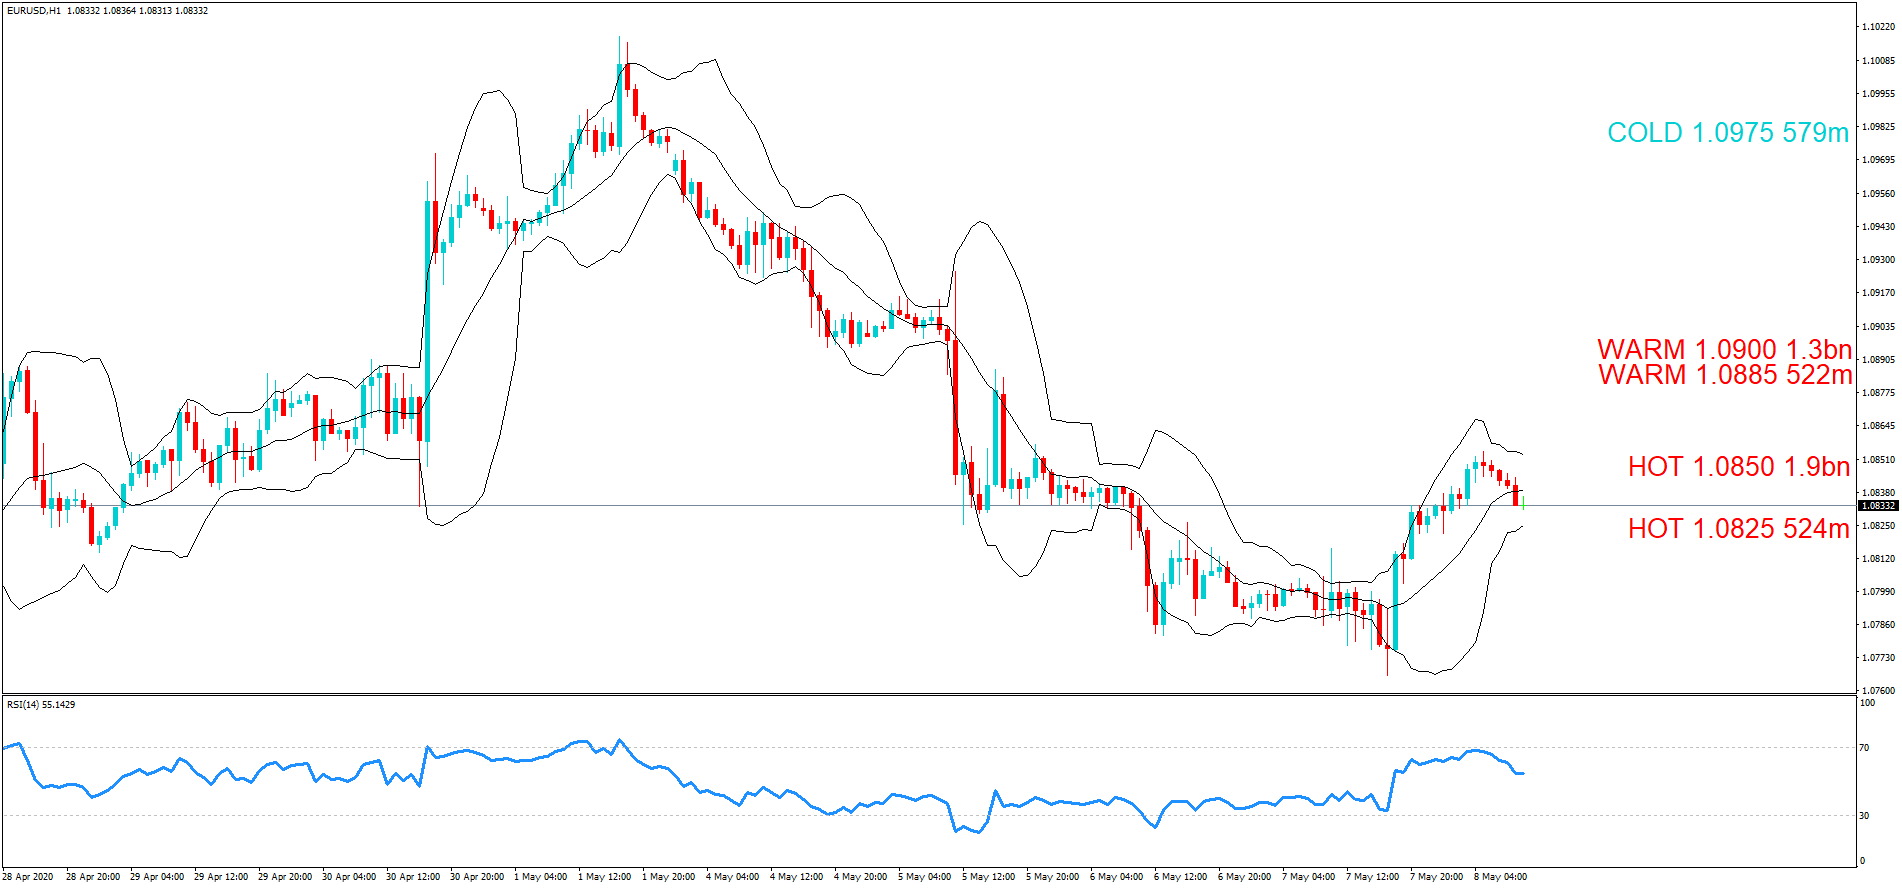
– EUR/USD: EUR amounts

  • 1.0825 524m
  • 1.0850 1.9bn
  • 1.0885 522m
  • 1.0900 1.3bn
  • 1.0975 579m

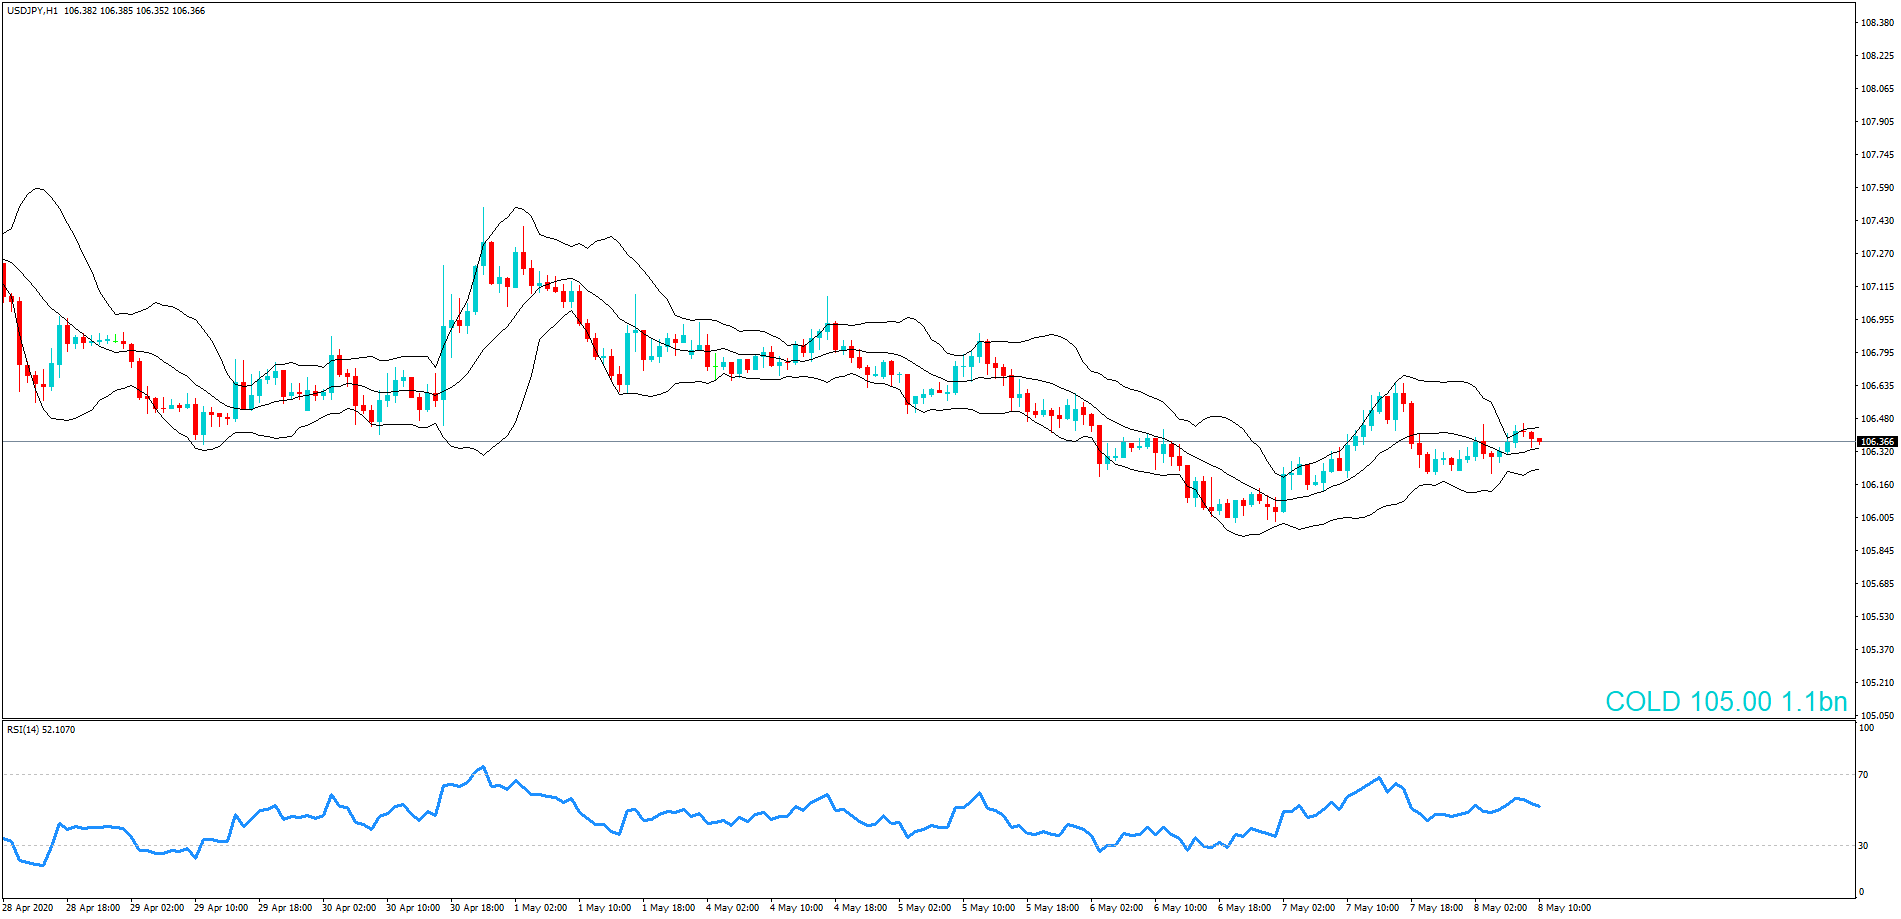
– USD/JPY: USD amounts         

  • 105.00 1.1bn

………………………………………………………………………………………………………………

If you want to learn how forex option expiries affect price action in the spot FX market see our educational article by clicking here: https://bit.ly/2VR2Nji

DISCLAIMER: Please note that this information is for educational purposes. Also, heat levels may change throughout the day in line with the exchange rate fluctuations due to technical analysis trading and upcoming economic data releases of the associated pairs.

Categories
Forex Fundamental Analysis

How The ‘Terrorism Index’ News Release Impacts The Forex Market?

Introduction

Terrorism Index is a macroeconomic indicator that can influence long term investing and foreign investments flowing into an economy. The smoothness in business activities and productivity of the economy is influenced by acts of Terrorism, thereby affecting the overall Gross Domestic Product (GDP). Hence, understanding the changes in Terrorism Index and its impact can help economists and policymakers make critical decisions towards the country’s growth.

What is Terrorism Index?

Terrorism Index, also known as the Global Terrorism Index (GTI), is a report that gives us a comprehensive summary of the key global trends and patterns in the acts of Terrorism. It is one of the measures of Terrorist Activity in different economic regions.

Terrorism: According to GTI, Terrorism is defined as the threatened or actual use of illegal force & violence by a non-state actor to achieve an economic, political, religious, or social goal through fear, coercion, or intimidation.

It also details incidents of Terrorism throughout the globe for the past 50 years, covering the period of the beginning of 1970 and the change in recent periods. It also identifies and categorizes terrorists into designated groups. GTI also ranks the countries that it covers as per the degree of Terrorist Activity being experienced by those economies. It covers 163 countries that attribute to about 99.7 percent of the world population.

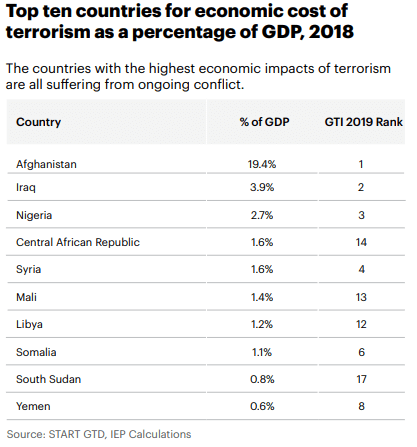
Below is the top ten countries list losing their GDP due to acts of Terrorism.

How can the Terrorism Index numbers be used for analysis?

Acts of Terrorism harm the economy. The impact of Terrorism is calculated through IEP’s cost of violence methodology. The methodology includes direct costs like loss of lifetime earnings, medical bills for treatment, and property loss from terrorism incidents. It also accounts for indirect effects like a loss in productivity, job or earning losses, psychological traumas that impact the victims and their associated family and friends.

Prolonged periods of terrorist activities can result in an unstable economy, where people may panic and fear for their life that impacts social order, political tensions, security threats, and leads to economic contractions. The more the terrorist activities, the lesser the chance for governing bodies to spend on public and growth, and the overall majority of revenue goes into combating Terrorism and bringing back the economy to its normal state.

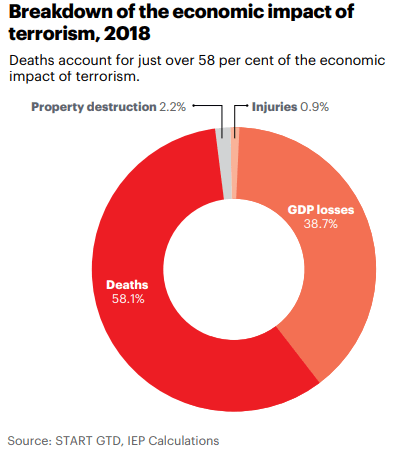
Overall the economic impact is divided into four categories: deaths, injuries or fatalities, destruction of property, and GDP losses from Terrorism. Terrorism has many implications for the larger economies. It depends on the duration, level, and severity of the terrorist activities. Typically, when countries suffer more than 1000 deaths from Terrorism, IEP’s model includes national output losses that are equivalent to two percent of the total GDP.

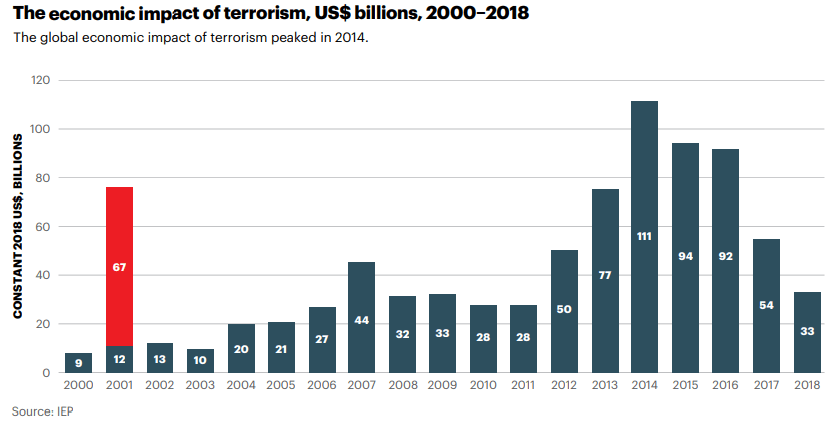
The deaths from Terrorism has a significant impact overall, followed by GDP losses. The global economic impact of Terrorism was 33 billion U.S. dollars in 2018, 38 percent lower than in 2017. Terrorism also has wide-ranging economic consequences that have the potential to spread quickly through the global economy with significant social ramifications.

The violence caused by Terrorism, and the fear of Terrorism creates critical disruptions in the economy. It changes the economy’s behavioral patterns, like changes in investment and consumption patterns, diverting public and private away from productive and economic activities towards protective measures. Developed economies are able to absorb the economic shocks of Terrorism better than growing economies. Terrorist activities directed towards specific organizations specifically hurt that company’s stocks in the short-term.

Trades become costlier as it has to account for increased security and higher wage premiums for workers working during such uncertain times. Countries whose main revenue streams include tourism take a severe hit as terrorist attacks significantly reduce tourist arrivals and, accordingly, the revenue from it.

Impact on Currency

GTI is an inverse indicator, meaning; low GTI levels are suitable for the economy and the currency. High levels of GTI results in allocating a lot of government resources in combating and containing Terrorism. In extreme cases, the regions experiencing high levels of terrorist activities can enter curfews for weeks or even months on end that is bad for the economy.

High GTI discourages foreign capital flow into the economy as investors are not sure of a smooth growth of business and industries within that economy when frequent disturbances are expected.

Terrorism Index is an annual metric and has a low impact on the volatility of the market as it is a lagging indicator and shows the long term trends and studies of Terrorism. The more direct consequences are obvious through other macroeconomic indicators, but GTI is useful for investors and impacts long term growth plans of the economy. High GTI can also lead to shying away from foreign companies to invest and expand in the country.

A decrease in the percentage of GTI is indicative of recovering economy and hence, can be used as a positive signal for growth overall.

Economic Reports

The Global Terrorism Index (GTI) report is released by the Institute for Economics and Peace (IEP) and was developed by Steve Killelea, the founder of IEP. It obtains its data from mainly from the Global Terrorism Database (GTD) and some other sources.

GTD data is collected at the University of Maryland by the National Consortium for the Study of Terrorism and Responses to Terrorism (START). It is an annual report that is released at the year-end, usually around November and December, on the official website of Vision of Humanity organization.

Sources of Terrorism Index

The GTI and Peace reports are available on the official website of the Institute for Economics and Peace – Institute for Economics and Peace – Reports

We can refer the 2019 GTI report here: GTI – 2019

We can find the GTI for different countries listed out in various categories here.

Impact of the ‘Terrorism Index’ news release on the price charts 

The report of the Global Terrorism Index is gaining a lot of importance today as it measures the amount of loss incurred by a country due to the destruction caused by the terrorism activities. The report consists of patterns and trends of terrorism activities in 163 countries. It also measures the economic impact of Terrorism.

Terrorism, for instance, impaired the GDP growth of 18 Western European countries from 1971 to 2004, where the GDP per capita fell by 0.4 percentage points. A large terrorist attack can affect financial markets negatively in the short-term. However, in the long term, they continue to function efficiently, absorbing the shock. Therefore, more and more countries try to quantify the effects of Terrorism on the granule level so that the currency is not adversely impacted.

In today’s article, we will be analyzing the impact of the Global Terrorism Index news announcement on various currency pairs and interpret the change in the volatility. For illustration, we have considered the Terrorism Index of the U.S., where the below image shows the Rank, Score, and the Change in Rank from the previous year. It represents the year-on-year Terrorism Index Score of the U.S., which was released in November.

EUR/USD | Before The Announcement

The above image is that of the EUR/USD currency pair before the news announcement, where we see that the overall trend is down, and currently, the price has retraced up to a key level of support equals resistance. From the knowledge of technical analysis, this is the perfect trade setup for going ‘short’ in the market, but since there is a news announcement on the next day, it is wise to wait and then trade based on the numbers. However, aggressive traders take a ‘short’ trade with a larger stop loss above the recent ‘high.’

EUR/USD | After The Announcement

After the Global Terrorism Index numbers are announced, the price goes lower, and there is an increase in volatility to the downside. But the candle leaves a wick on the bottom and closes near the opening price. Initially, traders bought U.S. dollars because of the positive economic indicator data where the Terrorism Score was better than last time, and the rank reduced by two positions. Even though it was positive, there were some traders who felt it was that robust, which is why the selling did not sustain. One can still go ‘short’ in the pair but with a shorter ‘take-profit.’

USD/JPY | Before The Announcement


USD/JPY | After The Announcement

The above images represent the ‘daily’ timeframe chart of USD/JPY currency pair, where in the first image, it is clear that the market is moving within a channel, and now it is at the bottom of the channel. Technically, it is the right place for going ‘long’ in the market as one can expect some buying force from here. A ‘buy’ trade is only for the aggressive traders, and others still need to wait for the clarity in news data. But since a news announcement.

After the numbers are published, volatility increases on both sides, and the candle managed to close in green. The market reaction was again neutral in this case as the Terrorism Index data was mildly positive to mixed, which is why the ‘news candle’ forms a ‘Doji’ candlestick pattern. Thus, one can now go ahead and take a ‘long’ position once the price goes the moving average with a ‘take-profit’ near the upper trendline.

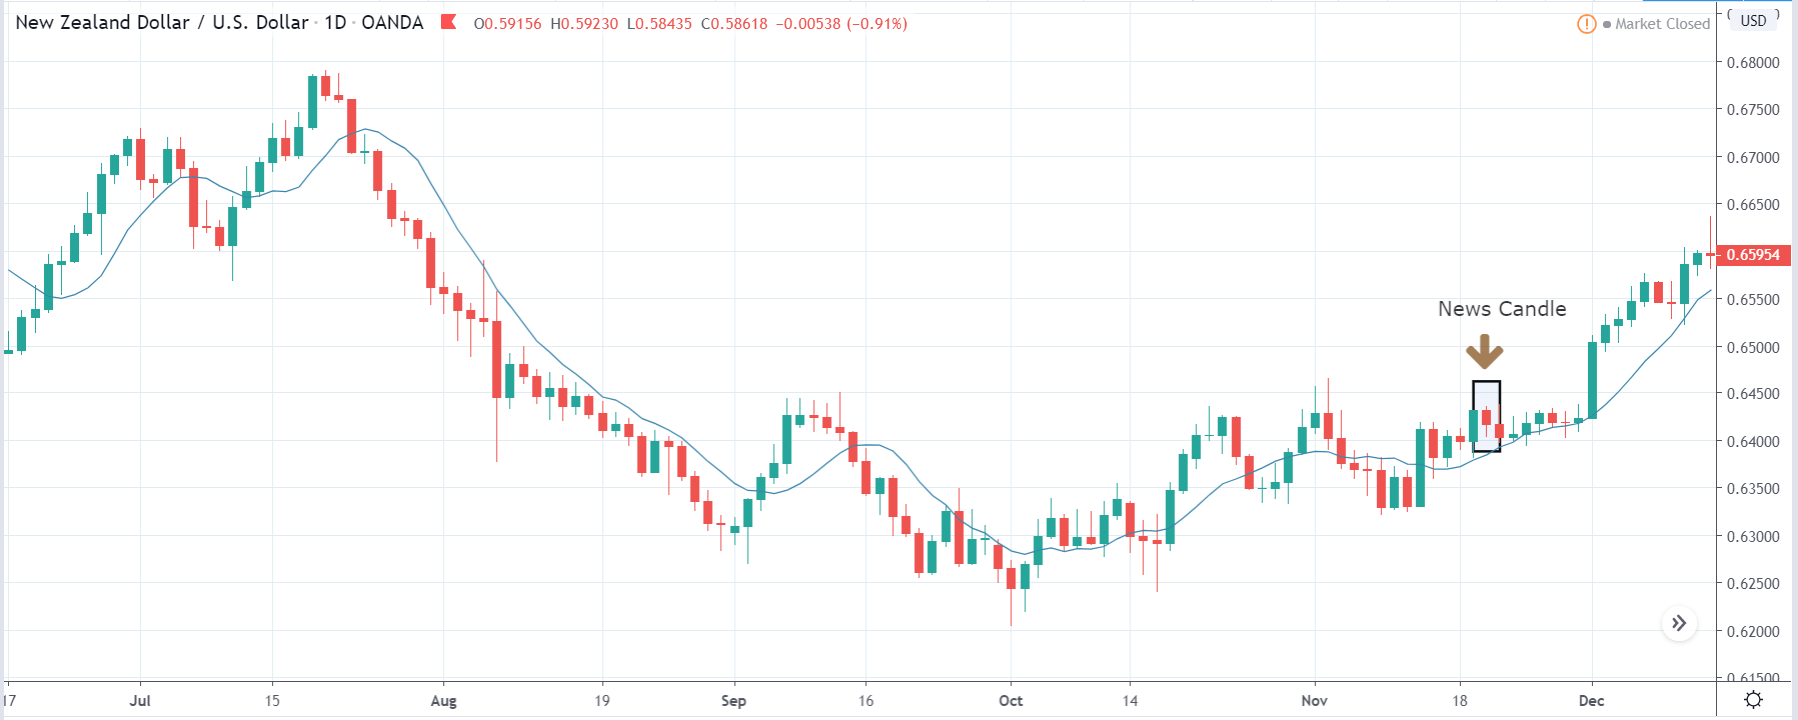
NZD/USD | Before The Announcement

NZD/USD | After The Announcement

These are the images of NZD/USD currency pair, and since the U.S. dollar is on the right-hand side of the pair, a down-trending market means that the U.S. dollar is showing strength. Though recently, the price is moving in a range and right before the announcement, it is at the top of the range, also known as ‘resistance.’ Another important point of consideration is that the volatility has increased on the upside, and this could be a sign of reversal. Therefore, ‘short’ trades from here have to be taken with caution.

After the Terrorism Index data is released, we see that the market moves lower and a moderate increase in volatility to the downside. The news outcome did not create the kind of impact that was expected and seen in other pairs. Thus, we need more indication from the market in order to go ‘short’ in the currency pair.

This ends our discussion on the ‘Terrorism Index’ and its relative news release impact on the Forex price charts. If you have any questions, please let us know in the comments below. Good luck!

Categories
Forex Fundamental Analysis

The Impact Of ‘Personal Saving’ News Release On The Forex Price Charts

Introduction

Personal Saving is one of the main components of Personal Income. Savings can give us hints on Consumer Spending patterns and future sentiments concerning financial matters. Personal Spending and Personal Savings are two primary sections into which the Disposable Personal Income divides, and the proportion of these two helps us ascertain short-term and long-term economic activity. Hence, understanding Personal Savings and Personal Savings Rate reports can help us solidify our understanding of fundamental analysis.

What is Personal Saving?

Personal Saving is the difference between Disposable Personal Income and Personal Outlays.

Disposable Personal Income (DPI), also called After-Tax Income, is the remainder of an individual’s income after all federal tax deductions. Hence, It is the amount people can spend, save, or invest.

Personal Outlays, or Personal Spending, refers to all the expenditures incurred to conduct one’s lifestyle, like rent, internet, fuel, transportation, groceries, etc.

For example, If an individual earns 100,000 dollars per year and his tax-deductible is 30%. His DPI is 70,000 dollars. If his year around expenses amount to 63,000 dollars, then the Personal Savings would be 7,000 dollars. Here, the Personal Saving rate would be 10%. Personal Savings would be the amount left after all the expenses have been deducted from the available income.

Personal Savings Rate (PSR) is the ratio of Personal Saving to the Disposable Personal Income expressed as a percentage.

Marginal Propensity to Save (MPS): It is one more metric used to assess Saving, which is defined as the ratio of the amount saved for each additional dollar. If a person got 100 dollars extra as a bonus this month, and if he spends 60 dollars of it and saves 40 dollars, then his MPS would be 0.4 (40/100). His general savings saw an increase of 40 dollars, and his disposable income saw an increase of 100 dollars. Hence, MPS considers the change in savings to change in income rather than the actual Saving.

Factors That Affect Personal Saving

DPI: An increase in Disposable Personal Income generally translates to increased savings once the necessities are met. Low levels of DPI mean that the majority of the available income is spent on Personal Expenditures leaving little room for saving. Personal Saving has been affected by variations in household net worth, consumer debt, and housing investment. In 2008 and 2009, during the most recent recession, the personal saving rate increased by about two percentage points each year, reaching 5.9 percent in 2009.

Economic Stability: Unstable economic conditions and frequent recessionary periods induce higher saving patterns in the general public as they cut back on their expenses to save for future rainy days. A growing and healthy economy see a stable saving rate and an increase in personal consumption, as people spend more when they have a positive sentiment towards their future financial security.

Deposit Rates: Banks pay interest to depositors for their deposited money. Higher interest rates can attract the general public to save money overspending as it would generate more money for future consumption.

Individual preference: How people traditionally see debt, mortgages, and savings also determines people’s saving and spending patterns. Generally, people from unstable economic regions or developing economies tend to save more than people who have always been in a stable economy. For example, the China saving rate is 35%, while that of America is around 8%. This cultural backdrop also plays a role in people’s tendency to save and spend. The proportion of different people within the economy will determine the direction of Personal Saving Rates.

How can Personal Saving numbers be used for analysis?

Changes in the saving rate are inversely related to changes in household net worth (i.e., cost of a house) as a percentage of DPI. The ratio of household net worth to DPI typically rises during periods in which household real estate and financial assets are appreciating and falls when these assets are losing value. As household assets appreciate, incentives to save from current income are lessened, while incentives to save are increased during periods of falling asset values.

An increase in Personal Savings is good for banks as they can give out more loans in one aspect and hence is good in the long run for the economy. But, in the short term, it implies expenses are cut back, which means businesses will see a slowdown, and that is not good either. An optimal balance between Spending and Saving has to be struck for sustained growth.

Personal Savings usually see an increase during economic shocks and recessionary periods. Hence a significant spike in Saving Rate can be considered as an indicator of an ongoing financial contractionary period.

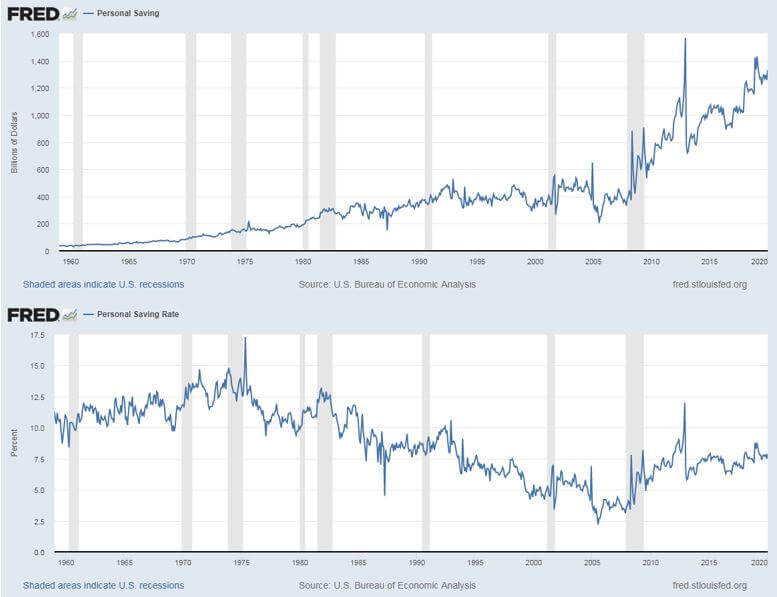
Personal Savings numbers simply would be a function of growing population and inflation. If the economy improves, so does the Personal Savings. For example, saving 100 dollars ten years back and now are two different things. We have to take inflation and increase in wages into account. Personal Saving Rate is more accurate in this regard as it is proportional. This is illustrated clearly in the below graphs of PS and PSR, respectively.

Hence, PSR is more prevalent amongst economists and investors for analysis. Also, Marginal Propensity to Save is higher for wealthier people than for poorer people. Hence, MPS can also be used to understand what is the standard of living and wealth the general public is enjoying, which reflects the strength and wealth of the overall economy itself.

Impact on Currency

As such, there is no direct one-to-one indication of Personal Savings figure to GDP, but there is a pattern here, during deflationary conditions when the currency value depreciates there is an upward spike in Personal Savings figures. In this sense, it is an inverse indicator and has a mild-to-low impact on the currency market. Economic shocks can also increase the Personal Savings figure.

Due to the long-term nature of the figures themselves, the currency volatility is low around these numbers compared to other macroeconomic indicators. Still, they are useful in understanding the long-term direction of the economy.

Economic Reports

The United States Commerce –  Bureau of Economic Analysis releases Personal Saving as part of the monthly report titled “Personal Income and Outlays.”

BEA releases the report in the last week of the month for the previous month. Quarterly and Annual reports, Seasonally adjusted versions of the same, along with Personal Saving Rate Reports, are all available under this release.

Unlike the PCE (Personal Consumption Expenditure) report, the Personal Saving figures are not expressed in percentages. Instead, the Personal Saving Rates is more popular, which is a percentage metric.

Sources of Personal Saving

The monthly Personal Saving numbers releases can be found on the official website of the Bureau of Economic Analysis under the “Current Release” section. This data can be found here – Consumer Spending – BEA. The Personal Saving Rate report can be found here.

Historical and Graphical comparisons are available on the St. Louis FRED website. Visit these pages to access this information. Personal Savings – FREDPSR – FRED.

Personal Savings date for countries other than the USA can be found here.

Impact of the ‘Personal Saving’ news release on the price charts 

The Personal Savings Rate is a big determinant of economic activity. The savings of an individual are directly related to consumer spending, which accounts for 63% of GDP. Higher savings can generate higher levels of investments and boost productivity over the longer term. The Harrod-Domar model of economic growth suggests that the level of Personal Savings is a key factor in determining growth. This has an effect on the value of the currency, and traders have a short to long term view on the currency based on the Personal Savings data. Today we will be analyzing the fourth quarter Personal Savings data of Australia that was released on the following date.

The below image shows the latest and previous Personal Savings data, where it was decreased to 3.6% percent in the fourth quarter of 2019 from 4.8% percent in the third quarter of 2019. A higher than expected reading is considered to be bullish for the currency while a lower than expected reading is considered to be bearish.

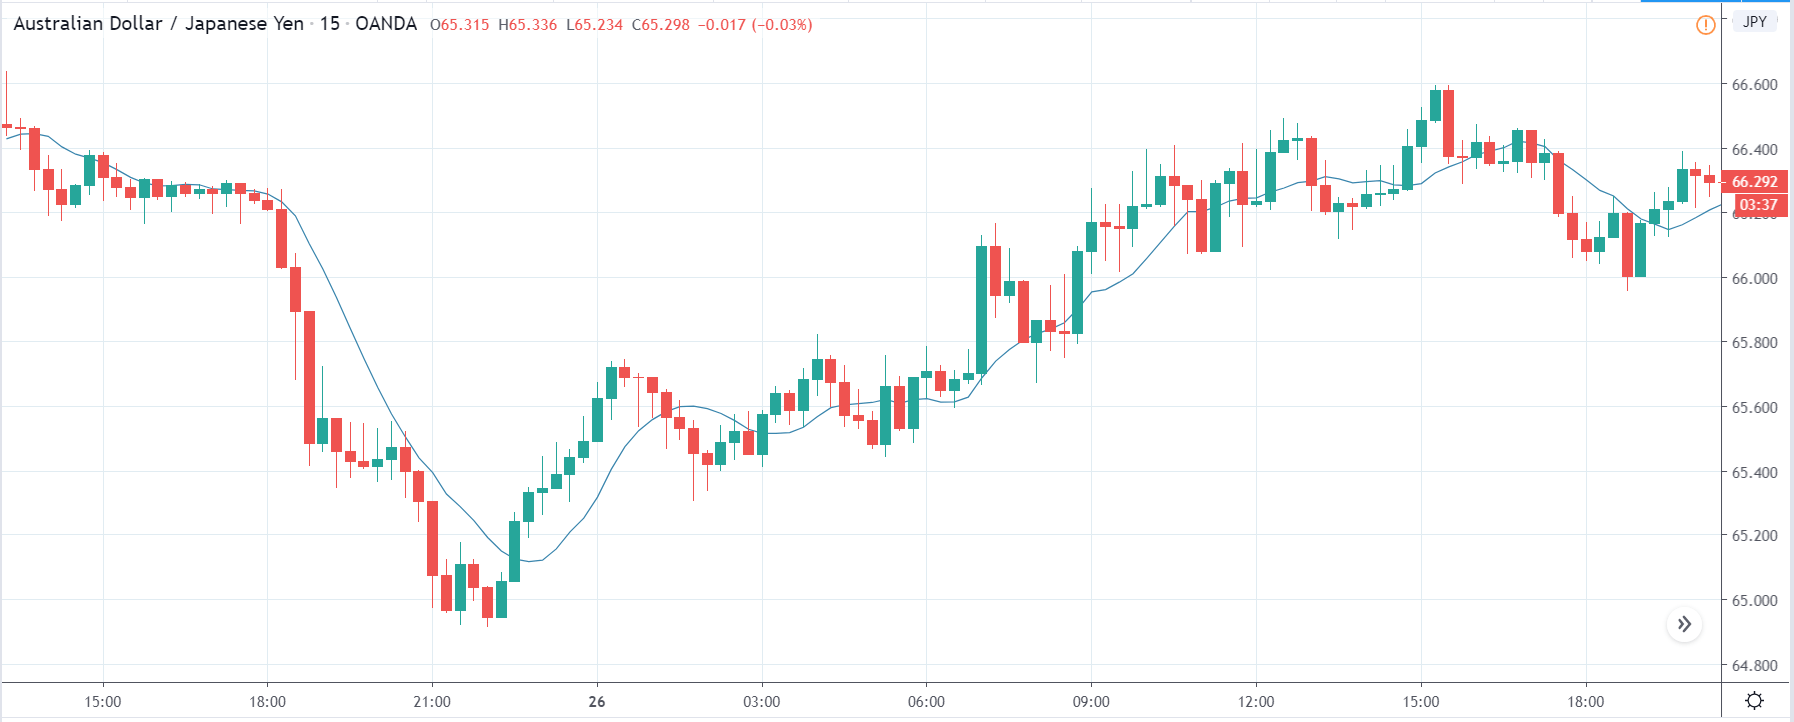
AUD/JPY | Before The Announcement

The first pair we will be examining is the AUD/JPY currency pair, and as we can see in the above image, the price has shown signs of reversal and might be going lower. Just before the announcement, the market has retraced the recent down move and is somewhere near the support turned resistance area. Technically, this is the ideal situation for going ‘short’ in the market, but it is wise to do so after we get confirmation from the market.

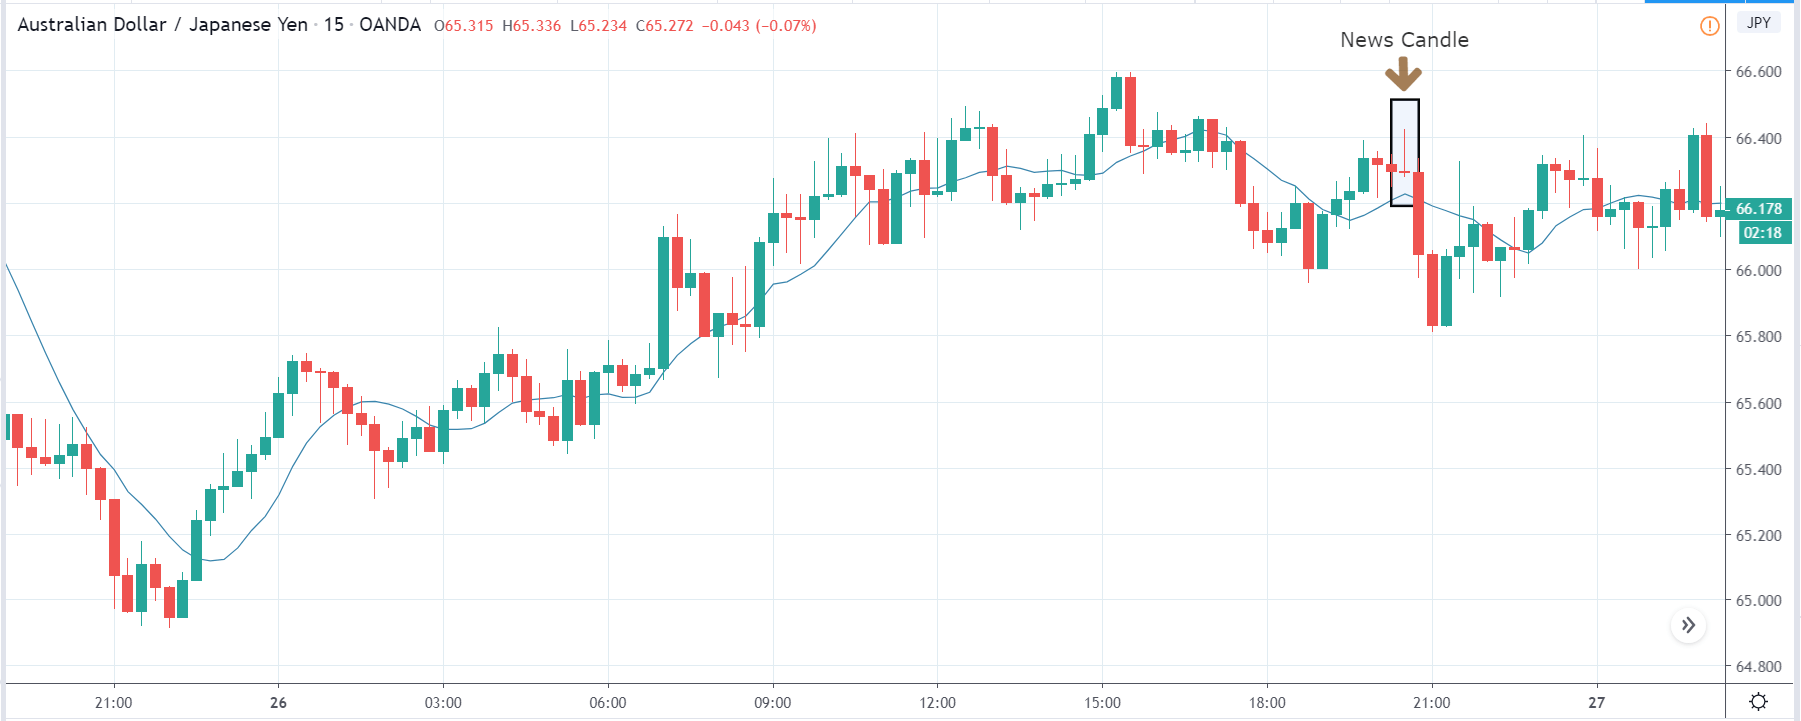
 AUD/JPY | After The Announcement

After the Personal Saving numbers are announced, there is a sudden surge in volatility where the price the initially moves higher, but this gets immediately sold into, and the ‘news candle’ leaves a large wick on the top. When traders found the Personal Savings to be lower than last time, they sold Australian dollars and weakened the currency. This happened as the news was not healthy for the Australian economy. Once the volatility increases to the downside, one can go ‘short’ in the pair with a stop loss above the ‘news candle’ and a ‘take-profit‘ near the ‘support’ area.

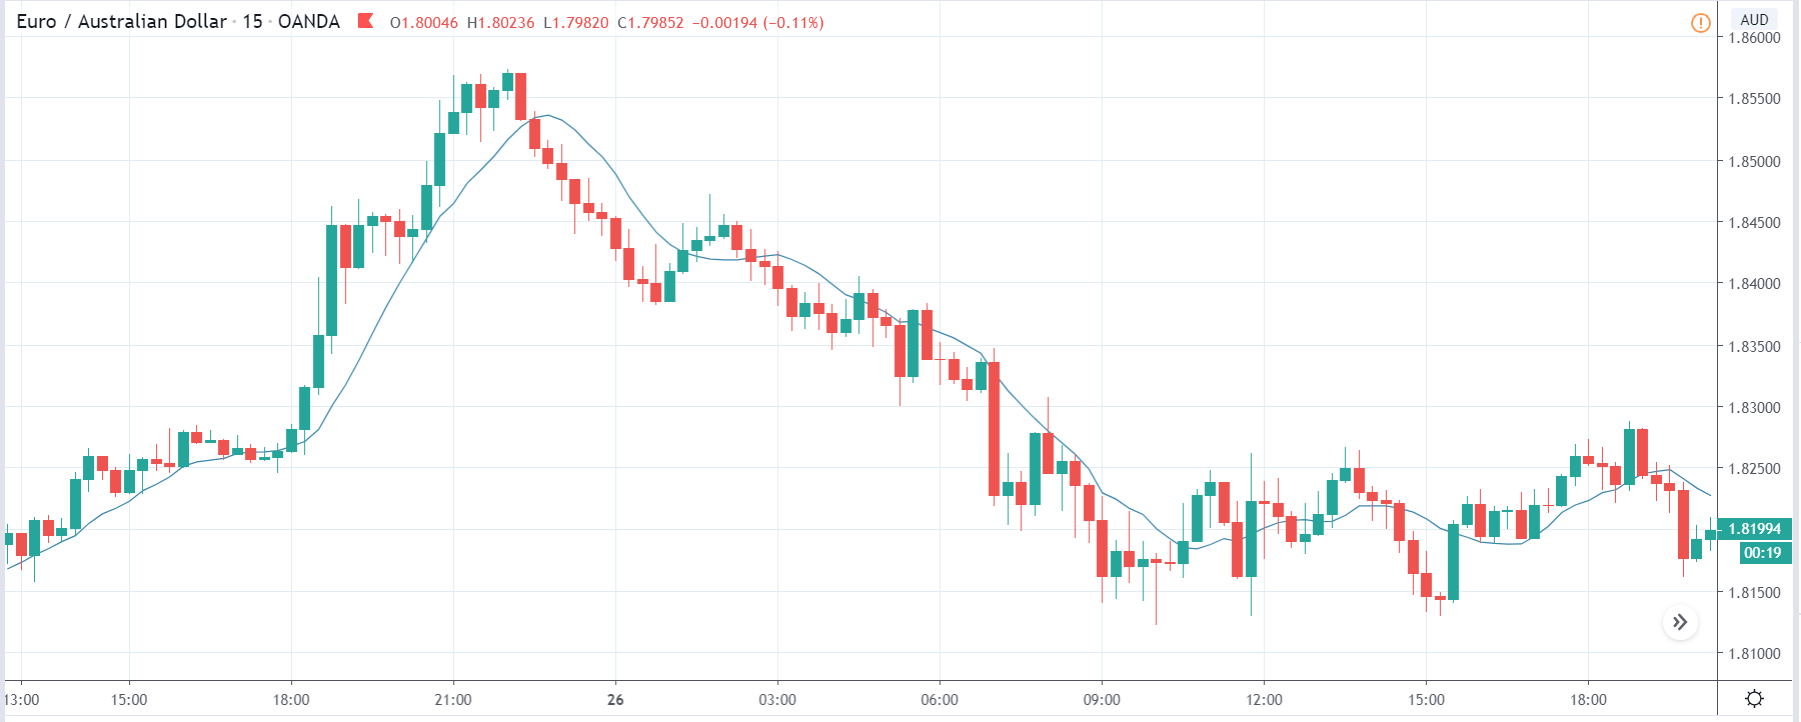
EUR/AUD | Before The Announcement 

EUR/AUD | After The Announcement

The above images are that of the EUR/AUD currency pair, and since the Australian dollar is on the right-hand side, a down-trending market, as in this case, indicates strength in the currency. After the big move to the downside, the market has started moving in a range and volatility appears to be high on both sides. Just before the news release, price is at the bottom of the range, known as ‘support,’ and from here, we can expect some buying force, which can take the market higher.

But as there is news release in the next few minutes, it can bring a drastic change in volatility, and we cannot predict where the market will go. After the announcement is made, we see a similar reaction from the market as in the above pair, and the ‘news candle’ leaves a wick on the bottom. We find that the Personal Savings was lower than last time and poor. This is why we see some buying interest in the market from the support, and thus we can go ‘long’ in the market with a stringent ‘take-profit’ near the resistance.

NZD/USD | Before The Announcement


NZD/USD | After The Announcement

These images represent the AUD/USD currency pair, where we see that the market is in a strong uptrend, and the Australian dollar is showing a lot of strength. Before the Personal Savings numbers are announced, price is above the moving average, and the uptrend is very much in place. As we do not have any forecasted data available with us, we cannot take any position in the prior to the announcement. We need to notice the change in volatility and then take suitable in the market.

After the Personal Savings data is announced, the market falls owing to poor Personal Spending data, and we see some selling pressure. But since the price does fall drastically and we do not see any trend reversal patterns, going ‘short’ in this pair is ruled out. Thus, the news announcement does not have a major impact on this pair as the uptrend is very strong.

This completes our discussion on the fundamental indicator ‘Personal Spending’ and the impact of its news release on the Forex market. If you have any questions, please let us know in the comments below. Cheers.

Categories
Forex Fundamental Analysis

‘Consumer Confidence’ & The Impact Of Its News Release On The Forex Price Charts

Introduction

Changes in Consumer Confidence drives macroeconomic indicators like Consumer Spending, which is a significant driver for Gross Domestic Product. Understanding what Consumer Confidence Surveys mean and imply are essential for predicting current and upcoming economic conditions. When understood properly, Consumer Sentiment can give us a hint regarding the direction of economic activity as an advanced or leading indicator.

What is Consumer Confidence?

The Consumer Confidence Statistics reflects the outlook of consumers on the future economic conditions and their financial status. The uniqueness of this indicator lies in the fact that this is a very subjective indicator and may be biased to some extent as it depends largely on the people’s opinion. Two people having the same current job and financial status may give a different outlook on it, but since the scope of the survey is broad, it irons out such exceptions and inconsistencies.

Consumer Confidence reflects how positive or negative people are feeling towards their future in the context of financial security, income, and employment. It is essentially a measure of the Consumer Sentiment in economic and monetary terms.

The numbers shown by Consumer Confidence surveys are not some monetary numbers derived from calculations, but instead, they are opinions rated on a scale in a numeric form similar to how we give a rating to movies on corresponding websites with stars or a ranking from 0-10.

How is Consumer Confidence scaled and assessed?

There are two major survey reports which show Consumer Confidence:

Consumer Confidence Index

It is released monthly by the Conference Board and reflects the general public’s expectations about their economic prospects for the next six months. The Conference Board expertise in these types of surveys (watching Consumer Spending and Buying habits) and take into account a plethora of data and survey information into account (about 5000 households) for their indices. Hence, it is considered a very reliable indicator by many.

Consumer Confidence Index is composed of the Present Situation Index, intended to be a coincident or current economic indicator, and the Expectations Index, expected to indicate future financial health.

Consumer Sentiment Index

The University of Michigan releases a preliminary report on the second Friday and a final report on the fourth Friday of every month. Their Consumer Research center conducts a telephonic survey asking 500 consumers a series of questions on personal finances and their opinions on business conditions. Two components, namely, Expectations Index and Current Conditions Index, make up the questions of Consumer Sentiment Survey.

Is Consumer Confidence necessary for our analysis?

The idea behind Consumer Confidence Surveys is that when consumers are confident of their economic prospects, they will spend more on personal expenses beyond the basic needs. For instance, when you assuredly receive 100$ daily, and the necessary daily requirements are taken care of with 50$. Naturally, we will spend the remaining 50$ for personal enjoyment as the next 50$ take care of tomorrow’s primary needs. In another case, if we were to receive the same 100$ on alternate days, then that money goes only for basic requirements, which cuts off the personal enjoyment expenditure.

Consumer Confidence drives Consumer Spending, which is more than a two-third component of GDP. Consumer Spending is the maker of GDP, and Consumer Confidence is a prime component of Consumer Spending.

How can Consumer Confidence be Used for Analysis?

The University of Michigan’s Consumer Sentiment Index historical data goes back to 1978, which is pretty decent for an economic indicator. Historically it has shown an excellent 85% correlation with the GDP growth rate, and this is a remarkable percentage to rely on these survey indices as leading indicators for the economy’s direction.

A low Consumer Confidence Index is a danger sign showing what is the probable economic crisis ahead in extreme cases. Weak confidence indicates there is a threat to the economy, and a contraction is on its way. Central Authorities may also use this to take corrective measures to change this. On the contrary, A healthy Consumer Confidence Index signals an economic expansion on its way, which stimulates growth and improves the standard of living of the citizens. Consumer Confidence can also be used by businesses to identify recessionary periods and take appropriate steps to minimize their risk and adapt accordingly.

Traders and Investors will always benefit the most from the leading or advanced indicators in comparison to coincident or lagging indicators. With such strong confidence leading indicators, we can significantly reduce our risk on financial investments and come out of trades before the danger signals manifest in the economy or go into the market and ride the economic growth ahead of others.

Sources of Consumer Confidence Indices

The Conference Board, which is a not-for-profit organization, has excellent data analysis for Consumer Confidence Indices. We can go through their surveying methodologies, historical records, samples on their official website. A sample issue of Consumer Confidence Survey pdf file can be found here.

The Michigan Consumer Sentiment Index numbers and corresponding data can be found here. The same is available on the St. Louis FRED website, where we can perform graphical analysis and plot against GDP rates for better understanding.

Impact of the Consumer Confidence news release on the price charts 

After understanding the Consumer Confidence economic indicator, we will now extend our discussion and analyze the impact of the same on the currency. It is a leading indicator that measures the overall economic activity. The reading is compiled after carrying out a survey of about 5000 consumers, which asks them to evaluate future economic prospects. When respondents give high ratings, it shows consumer optimism. Consumer Confidence data does not have a major effect on the monetary policy and the decision of policy-makers. Hence it does not cause severe volatility in the currency pair.

For illustrating the impact, we have considered the Consumer Confidence data of Europe, which is published by the European Commission. The below figure shows the previous, forecasted, and actual Consumer Confidence data in the Euro Zone, which was collected for the month of March. It shows that there was a decrease in the value from the previous month but higher than what was expected. A higher than expected reading is believed to be positive for the currency while a lower than expected reading is considered to be negative.

EUR/AUD | Before The Announcement

We begin our analysis with EUR/AUD, where the above chart shows the state of the currency pair before the news announcement. We see that the market is moving in a range and currently is at the bottom of the range. Since the impact of the news release is less, we need to rely more on technical analysis and trade based on technical indicators, rather than on the outcome of the news. Technically we are at the bottom of the range, so positive Consumer Confidence data is the ideal case for going ‘long’ in the currency pair.   

EUR/AUD | After The Announcement

After the Consumer Confidence data is released, volatility in the market increases on both sides, and the candle closes, forming a ‘Doji’ pattern. The reason behind this indecision is that the Consumer Confidence numbers were better than before but lesser than the forecasted numbers. Some traders took this to be positive, while some felt the numbers were not too great. From the trading point of view, since the market does not break the ‘support’ area, one can enter for a ‘buy’ with a ‘take-profit’ near the ‘resistance’ area.

EUR/JPY | Before The Announcement


EUR/JPY | After The Announcement

The above images represent the EUR/JPY currency pair, and the characteristics of this pair appear to be very different from that of the above-discussed pair. Before the announcement, the market is in a strong uptrend and currently at a point from where the market had reversed earlier. As the market is at a critical point, it is better to wait for the Consumer Confidence data and then trade based on the change in volatility.

After the news release, the price initially goes up but later gets sold into and closes in red. We need to note here that even though the market reaction was bearish, the price did not break the moving average. Instead, volatility increases on the upside and results in a continuation of the trend. One can trade the above pair after price retracement to an appropriate Fibonacci level and then taking a ‘buy.’

EUR/NZD | Before The Announcement 

EUR/NZD | After The Announcement

Now we shall discuss the impact of Consumer Confidence data on EUR/NZD currency pair. The behavior of the chart is similar to that of the EUR/AUD pair where here also the price is moving within a range, and recently the price has broken below the range. Since the selling pressure has increased, it can be risky to go ‘long’ in the market, even if the data proves to be positive for the economy.

After the news release, the market moves higher as a consequence of positive Consumer Confidence data, and the price closes, forming a bullish candle. As mentioned earlier, going ‘long’ can be risky due to the increased selling pressure, and thus conservative traders should not take such trades. Another reason why the up move might not be sustainable is that the impact of Consumer Confidence data on currency is not as much.

That’s about Consumer Confidence and its impact on the Forex Market. Let us know if you have any questions in the comments below. Cheers.

Categories
Forex Fundamental Analysis

‘Producer Price Index’ & The Degree Of Its Impact On The Forex Charts

Introduction

Producer Price Index PPI, which sounds very similar to the Consumer Price Index CPI is also an equally important indicator. It is widely used as a leading indicator to predict the upcoming CPI and thereby draw economic conclusions accordingly ahead of time. Hence, understanding the Producer Price Index, its history, and the resultant effect it has on the market is significant for traders who trade on Fundamental Analysis.

What is the Producer Price Index?

As the name suggests, the calculation of this index is from the viewpoint of the Producer, i.e., a manufacturer or maker of goods and services. Producer Price Index, in the simplest sense, measures the average of the selling prices of the goods and services at the manufacturing end place. In other words, it is the average of the prices at which the manufacturer sells his products and services to the retailers, who then take it to the local markets and make it available to the general public.

Understanding the difference between what Producer Price Index and Consumer Price Index represent is the key here. Consumer Price Index CPI represents the cost at which goods and services are made available to the general public. Hence, CPI is the measure of average weighed in COST PRICE of finished goods while the Producer Price Index represents the weighted average of SELLING PRICE of the manufactured goods. CPI represents what the end consumer or customer pays, and PPI represents what the manufacturer receives for his commodities.

An item when manufactured and sold from the place where it got manufactured incurs certain costs before it reaches the end consumer. These costs include transportation fees, some specific goods & service taxes, storage costs, etc. Hence, Producer Price is a more rudimentary or cruder form of CPI, and there is an inherent correlation between both. For this reason, PPI is considered an advanced signaling tool to assess CPI and make informed economic decisions by various groups.

How is the Producer Price Index PPI calculated?

The Bureau of Labor Statistics (BLS) surveys almost all industries in the goods manufacturing section and a majority of service sectors. This organization continues to include more and more divisions as time progresses. Producer Price Index of BLS is calculated by first collecting data from all the listed industries by field economists. These people collect data through various means like an onsite visit, phone calls, or even emails, etc.

The producer Price Index uses an altered version of the Laspeyres index. For any given set of goods, it compares the base period revenue to the current period revenue.

Producer Price Index =  (∑QoPo(Pi/Po)) / (∑QoPo)  ×100
  • Qo: Commodity Quantity shipped in the base period
  • Po: Commodity Price in the base period
  • Pi: Commodity Price in the current period

The above equation tells clearly that based on size & importance, items are weighted. The base price corresponds to 100 for which the base year corresponds to 1982. The PPI is published as a percentage increase or decrease with regards to the previously released number, which may be monthly, quarterly, and annually.

Why is the Producer Price Index important?

CPI measures consumer inflation, and PPI measures business inflation. The significance of the Producer Price Index is many-fold. First are the range and history of the data. The index data set goes way back in time. For example, PPIFGS (Producer Price Index by Commodity for Finished Goods) goes as far back as 1947. With such huge data, the reliability of the data set is high, and it usually depicts the macroeconomic picture of country and industrial health with good confidence.

Also, The PPI program is the oldest continuous series of the Federal Government going back to 1902. Second is the frequency & direct ground-level nature of the statistic meaning this data is a real-time reflection of the current industrial health. Thirdly, PPI is very closely related to CPI in the sense that it is an index of the same goods at an earlier stage of the life cycle.

While CPI shows the stats for a product at the near-end of its transaction life cycle in terms of changing hands, PPI shows the stats at the first transaction life cycle, which is very helpful. In this Index, there are many subcategories, wherein certain goods and services get included or excluded from the basket to give a more accurate picture of the concerning market in absolute or relative terms. For example, PPILFE Producer Price Index Excluding Food & Energy (Core PPI) strips away food, gas, and oil prices from the equation whose prices are volatile and measures the absolute changes.

How can the Producer Price Index be Used for Analysis?

The range of PPI is such that there is something for everyone here. Narrowing down into the PPI, any industry can be analyzed. Broadly there are three most popular classifications:

Industry classification: Here, groupings of commodities are done based on the industry sector they represent. The PPI releases about 535 indexes with more than four thousand specific product lines and product category sub-indexes.

Commodity classification: Here, the grouping of items is done based on the similarity of goods and services in terms of their making.

Commodity-based Final Demand-Intermediate Demand (FD-ID): Here, Based on the consumer group, the commodities are classified and are one of the most used PPI stats.

Due to the diversity in the statistics, different sectors of economists can isolate and use the Producer Price Index for their purposes.

Producer Price Index is a widely used indicator for predicting Consumer Price Index. Manufacturers and Industrialists also use these PPI to adjust pricing on the goods and services they buy and sell to fellow manufacturers to avoid having fixed pricing or unfair price changes during the duration of their business contract, which usually tends to be very long periods.

Sources of Producer Price Index

The U.S. Bureau of Labor Statistics releases all the indexes as mentioned above here

You can also find out the same indexes along with many others with a comprehensive summary and statistics of various categories on the St. Louis Fed website.

Impact of PPI’s news release on the Forex market 

After understanding the definition and significance of the Producer Price Index (PPI) in an economy, we shall look at its importance on price charts. For analysis purposes, we have taken the PPI data of Japan, where the survey responses from large Japanese manufactures provide the data for the report. Even though the PPI is a key indicator of the manufacturing sector of the economy, currency traders do not consider it to be the most important indicator of the overall economy. The below image The Business Manufacturing Index (BSI), along with PPI, measures the business sentiment in manufacturing.

The PPI data is released by ‘Bank of Japan’ that measures the change in selling prices of goods purchased by Japanese Corporations. A higher than expected PPI is considered to be positive for the currency and vice versa. The PPI data is released on a monthly, quarterly, and yearly basis, but the highest importance is given to the year-on-year data. The below image shows the latest year-on-year PPI data of Japan that was released in the month of March. As we can see, there is so much variation in the data from ‘previous’ to ‘forecasted to the ‘actual.’ This means, there are many other factors that influence the manufacturing industry that it is difficult to measure for the economists.

EUR/JPY | Before The Announcement

The above chart is that of EUR/JPY, and since the Japanese Yen is on the right-hand side, a down-trending market indicates the strength of the Japanese Yen. The reason behind this downtrend before the news release is because of the bullish expectation of the PPI data from market players. Traders have already forecasted the PPI to be around 1%, which 0.5% lower than the previous reading. Since it is lower, we should expect weakness in the Japanese Yen, but 1% seems to be a good PPI figure for the Japanese economy, hence the downtrend. We need to remember that a higher PPI data is not compulsory to take the currency higher, but rather sometimes the data alone plays importance.

EUR/JPY | After The Announcement

After the PPI numbers are announced, the price barely goes above the moving average line, and there is not much change in the volatility. As the PPI is not an impactful event, the volatility is as expected. A reduction in PPI is bad for the currency, but even though the PPI was reduced, the Japanese yen did not get weak. Therefore, we should just not be paying attention to the news but also use technical analysis to take trades. In this example, we can go long in the market only if we get ‘reversal’ signs, but we don’t see any such patterns. Thus, we should be looking for trend continuation patterns and join the downtrend.

GBP/JPY | Before The Announcement


GBP/JPY | After The Announcement

The above image represents the GBP/JPY currency pair, which shows similar characteristics as that of EUR/JPY, where the downtrend is much stronger than the latter. Since the downtrend is prominent, only a much worse PPI than before can take the currency higher. Even if the PPI was very low, the uptrend would not last as it is not an important measurement of the economy. After the news announcement, there is hardly any effect on the currency pair, and the volatility is in the same range. The PPI data was almost the same as that was forecasted by traders, and we can say that it was as per the market expectations. This made the Japanese Yen to strengthen more and downtrend extended on the downside after a bit of consolidation. Once the market slips below the moving average, a ‘short’ trade can be taken with a stop loss above the ‘news candle.’

USD/JPY | Before The Announcement


USD/JPY | After The Announcement

This is the USD/JPY currency pair, where the chart characteristics are a little different than the above two charts. Here we don’t really witness a downtrend but rather a ranging nature of the market. Since we are near the resistance area, any positive news release should be taken as an opportunity to ‘short’ in this pair. This is the way we should combine fundamentals with technical analysis. After the news is released, we don’t see any change in the volatility, and the ‘news candle’ leaves a wick on the top. The PPI data was again positive for the Japanese Yen, where the price crashed right after the ‘news candle.’

That’s about PPI and how the Forex price charts get affected during the news release of this fundamental indicator. Let us know if you have any questions in the comments below. Cheers!
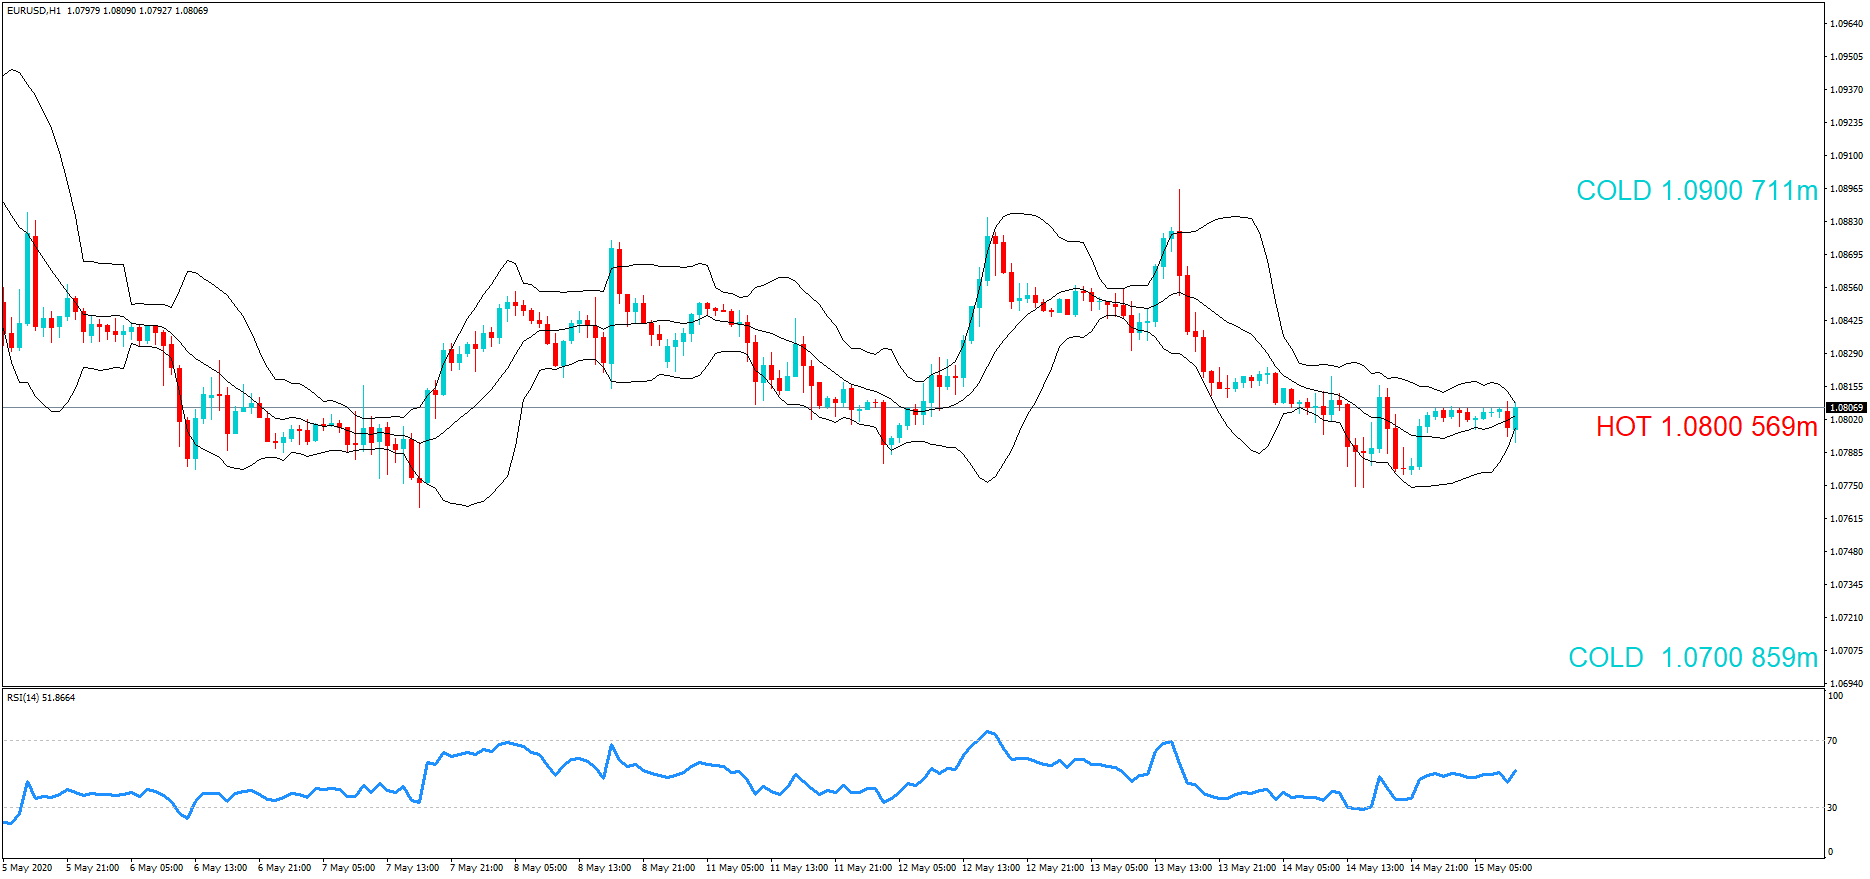
Categories
Forex Fundamental Analysis

‘Productivity’ as a Fundamental Indicator & Its Impact On The Forex Price Charts

Introduction

Productivity is an important fundamental indicator that talks about the levels of the industrial output of a country. It is one of the leading indicators in the Forex market, which has a long-term impact on the currency’s value. The industrial output is linked to the theory of demand and supply, which means the availability of raw material and policies set by the monetary policy committee directly affects the overall output. Let us understand this concept in depth by looking at the definition of Productivity first.

What is Productivity?

Productivity is defined as the ratio of total output volume to the total input volume. The ratio is mentioned in the form of an average, which expresses the total output of a category of goods divided by the total input, say raw materials or labor. In simple words, Productivity measures how efficiently the inputs such as labor and capital are being used in a country to produce a given level of output.

Productivity determines economic growth and competitiveness and hence is the basic source of information for many international organizations for measuring and assessing a country’s performance. Analysts use ‘Productivity’ data to also determine capacity utilization, which in turn allows one to assess the position of the economy in the business cycle and to forecast economic growth.

Measuring Productivity

Before we see how Productivity is analyzed, we need to consider various methods of measuring the output and input components of Productivity and the limitation of using each of these estimates.

Output

When we are talking about output, the number of units produced of each category of commodity or service should be counted in successive time periods and aggregated for the company, industry, and the whole economy. This output should be measured in comparison to some other indicator of equal importance, usually cost or price per unit in a period. The changes in the price of the goods produced are observed for two or more periods that are said to influence the aggregate output volumes. Price deflation is usually employed to get the estimation of the real gross product by sector and industry. The obtained estimates will be used as numerators in the productivity ratios.

The limitation of using the above methods is that quantities and prices for many outputs of finance and service industries are deficient.

Input

Labor input is easy to measure, as it only involves counting the heads of persons engaged in production. But in fact, the number of hours worked is preferable to just the number of people. This dimension, too, is related to the compensation received per hour of work, also known as wage. The official estimates, however, do not differentiate among various categories of labor where they measure labor inputs by occupation, industry, and other categories.

The drawback of using this method for estimating the labor input is that it is difficult to find the relation between the number of hours worked and hours paid for during paid holidays and leaves.

Determinants of Productivity

Technology determines the maximum level of output that can be reached and the quality of output that is required. In this age of technological advancement, innovations and automates systems play a major role in carrying out the production activity. Technological changes are happening very fast in some industries while it is gradual in others.

The Skills of the workers matter a lot when determining Productivity on an individual level. For example, if an unskilled worker tries to carry out a task, he might make more mistakes and will not be able to optimize the time to work, whereas a skilled worker will need less time to do the same job.

Some other methods of attaining high Productivity are through adequate levels of earnings, high job security, quality education and training, good and safe working conditions, and an appropriate work-life balance.

The Economic Reports

The economic reports of Productivity are published every month for most of the countries. There is also the collective data that combines the monthly statistics of a country which is published on a yearly basis. The productivity data is maintained and provided by two big OECD (Organisation for Economic Cooperation and Development) databases, which are ISDB (International Sectoral DataBase) and STAN (Structural Analysis DataBase). At these sources, we can find the data from 1970 for countries like the United States, Japan, and other European countries.

Analyzing The Data

From a trading perspective, Productivity plays a vital role in the fundamental analysis of a currency pair. The productivity data shows the production capacity of a country. Using this data, various agencies decide which goods need to be imported and exported from the country. By comparing the data of two countries, one can determine which economy is stronger and has the potential to grow.

One thing to keep in mind when analyzing the data is to compare similar economies as different countries will have a different level of development. When looking at developed countries, it is fair to expect the productivity ratios to be in triple digits, and for developing economies, it could be in two digits.

Impact on the currency

The impact due to Productivity on the currency is split into two different categories, i.e., the ‘traded’ and the ‘non-traded’ sector of the economy. The ‘traded’ sector is made up of industries that manufacture goods for import to foreign countries and hence have a presence in the foreign exchange market. The ‘non-traded’ sector is comprised of industries that produce goods for the domestic market only.

So, as the prices of goods of the ‘traded’ increase, the currency of that country is set to appreciate and thereby increasing the inflow of funds into the country. In the case of ‘non-traded’ sector goods, an increase in the price of such goods is not good for the economy as this would make the products costlier and people will have to spend more to purchase them. This would negatively impact the currency, and institutions will not be willing to invest in such countries.

Sources of information on Productivity

Productivity data is available on the most prominent economic websites that provide a detailed analysis with a comparison chart of previous data. Using this information, a trader can analyze and predict the future data of the economy. Here is a list of major countries of the world with their productivity stats.

GBPAUDUSDEURCHFCAD | NZDJPY  

Higher Productivity has an impact on the profit of a company and the wages of the employees. High profits due to high Productivity generate cash flow, increase loan provision from banks, and, most importantly, attract investment from foreign investors. Due to this, companies can afford to pay more wages to their employees without losing market share.

Impact Of Productivity News Release On The Price Charts 

Productivity is one of the most important economic indicators that measure the annualized change in the labor efficiency of the manufacturing sector. As Productivity plays a major role in an economy, it is necessary to analyze the impact of the same on the currency. The below image shows that Productivity is not a crucial factor for forex traders, which means the Productivity data might not have a long-lasting effect on the currency. However, one should not forget the data that affects the manufacturing sector and hence indirectly impacts the GDP. Therefore, we should not underestimate the figures.  

To explain the impact, we have considered the NonFarm Productivity of the US, which is released by the Bureau of Labor Statistics of the US Department of Labor. A ‘higher than expected’ reading should take the currency higher and is said to be positive for the economy, while a lower than expected reading is considered to be negative for the economy and should take the currency lower. The latest figures show that there has been a 1.4% rise in Productivity levels from the previous quarter. Let us find out the impact on the US dollar.

NZD/USD | Before the announcement | 5th March 2020

The above chart is of the NZD/USD currency pair before the Productivity numbers are announced. What we essentially see is a strong down move that has resulted in a reversal of the uptrend. The volatility is high even before the news release. The reason behind this move is much greater expectations of Productivity than before, which is making traders buy US dollars. Now, if the Productivity numbers were to be lower than before, we can expect a reversal of the downtrend, but it might not be sustainable as it is not a high impactful event.

NZD/USD | After the announcement | 5th March 2020

After the Productivity data is announced, volatility further increases on the downside, and the market moves much lower. What we need to observe is that even though the market goes lower, it fails to make a ‘lower low.’ This is because the productivity data is not of much importance to traders, and hence the impact will not last long. Therefore, the market respects the news for just a couple of candles and later takes support at the lowest point and goes higher. From a trading point of view, the only way to trade Productivity news release in this pair is by going ‘short’ after the news outcome and exit at the nearest opposing point.

GBP/USD | Before the announcement | 5th March 2020

GBP/USD | After the announcement | 5th March 2020

The above images represent the GBP/USD currency pair, where the characteristics of the chart are totally opposite to that of the NZD/USD chart. Here, the uptrend seems to be dominating, which is also confirmed by the moving average indicator. The forecasted productivity data is not having any impact on the pair before the news announcement, which means the data is relatively weak against British Pound. After the announcement is made, we see the market moves up as the data was no better than the forecasted data. The ‘news candle’ leaves a wick on the top since the data was mildly positive for the US dollar but has no significance. Therefore, the volatility increases on the upside with a minor impact, and the market continues its uptrend. In this pair, we don’t really see a point of ‘entry’ as we don’t have technical factors supporting the trade and hence should be avoided.

USD/CHF | Before the announcement | 5th March 2020

USD/CHF | After the announcement | 5th March 2020

The above chart of USD/CHF is similar to that of GBP/USD pair, but since the US dollar is on the left-hand side, the chart is in a downtrend. Here too, the US dollar is showing a great amount of weakness before the news announcement, which means even a positive Productivity data is less likely to result in a reversal of the trend. After the news announcement, we see that the price suddenly shoots up, and the price closes as a bullish candle. As the impact of Productivity data is less, the sudden rise in volatility shouldn’t last, and hence this could provide an opportunity for joining the trend. When volatility increases on the downside, we can take ‘short’ positions in the market with a stop loss above the ‘news candle.’ This is how we need to analyze such news outcomes.

That’s about Productivity and its impact on the Forex market. If you have any doubts, please let us know in the comments below. Cheers.