Categories
Forex Videos

FOREX – Fundamental Analysis for Novices – US JOLTS Job Openings!


Fundamental Analysis for Novices: US JOLTS Job Openings


Thank you for joining the fundamental analysis for novices’ educational video. In this session will be looking at United States JOLTS job openings. Jolts defines job openings as all the positions that are opened on the last business day of the month. The criterium is that a specific position exists and that there is work available for that position.


If it’s the first time that you have seen one of our fundamental analysis videos for novices, we strongly recommend that you use an economic calendar every day if you are not already doing so. An economic calendar should act as your Bible in order to trade around it while avoiding high impact news data releases which may have a negative impact on your trades.


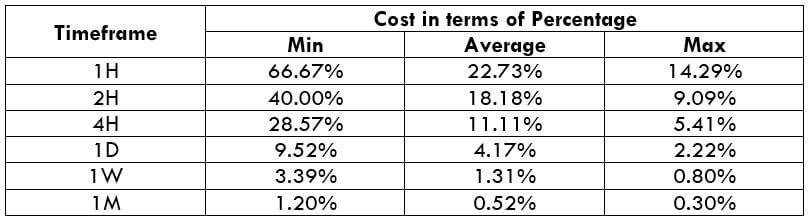
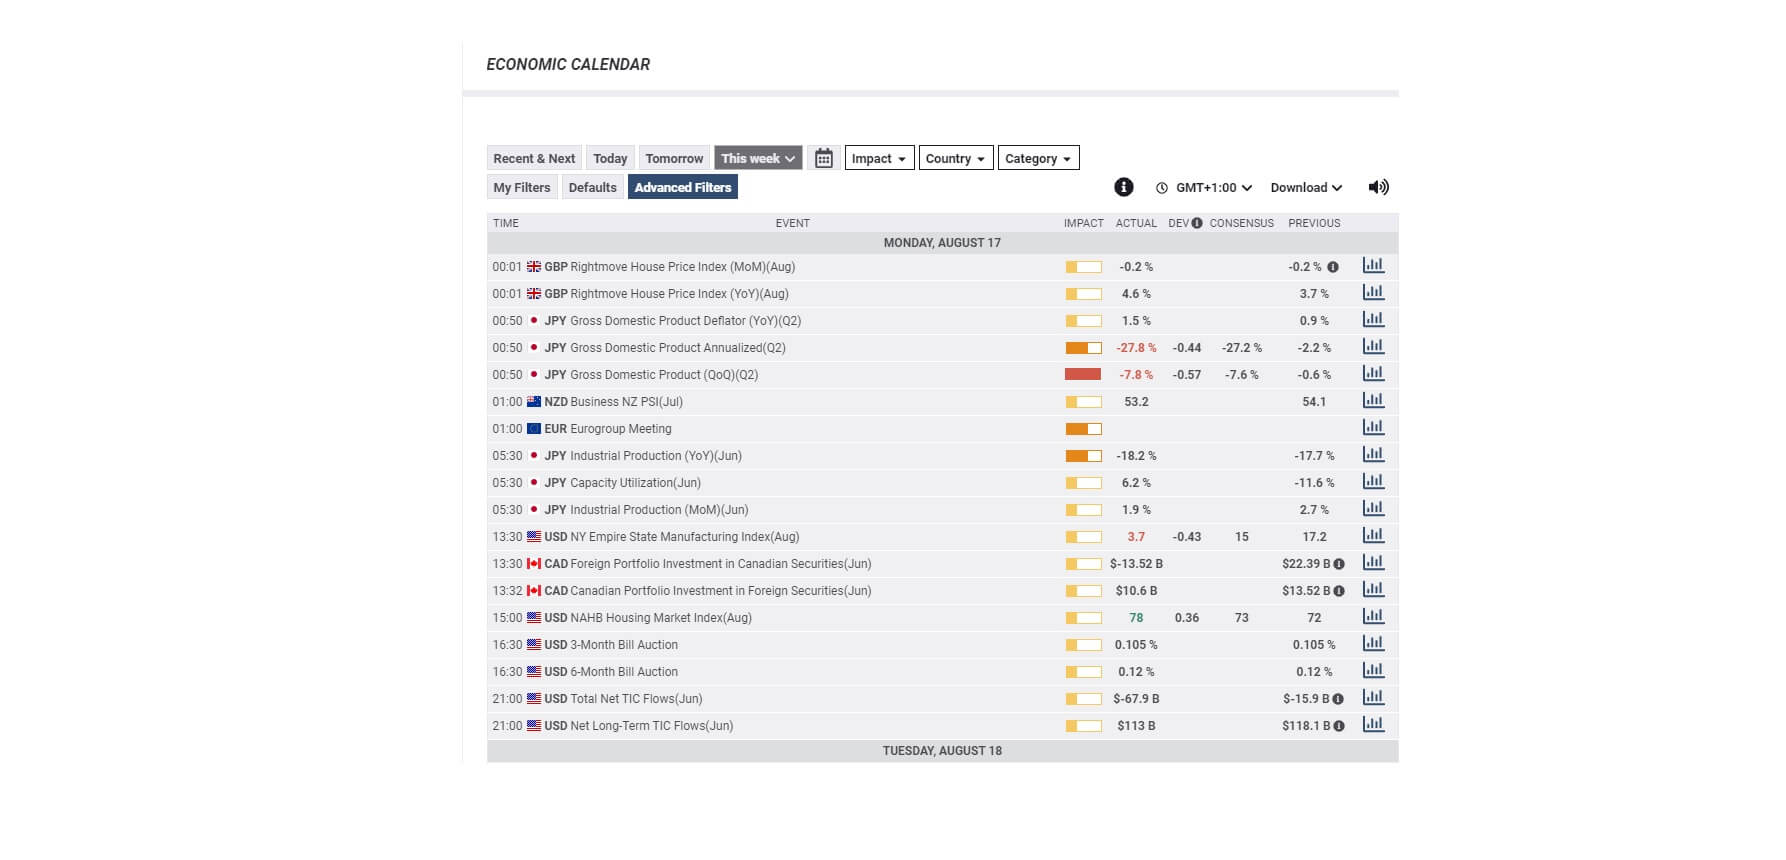
The key components of any economic calendar are the time of the release, the day and date, the type of event, and the impact that any such data release will likely have on the market, which is typically low, medium, and high. And where we can see an impact bar here displaying various levels of impact from low, which is in light orange, to medium shown in a darker orange and taking up a third of the box, to the full red impact box, which means that any data release is likely to cause extra volatility on its release.
Most economic calendars will also show you the previous period’s data release, which might be weekly monthly, quarterly, or annually, and also a general consensus of where market analysts believe the data statistics will be upon its release. And then we have the actual release data, which will be populated upon the release of the data. Most brokers will provide this information almost instantaneously to help your trading decision making.


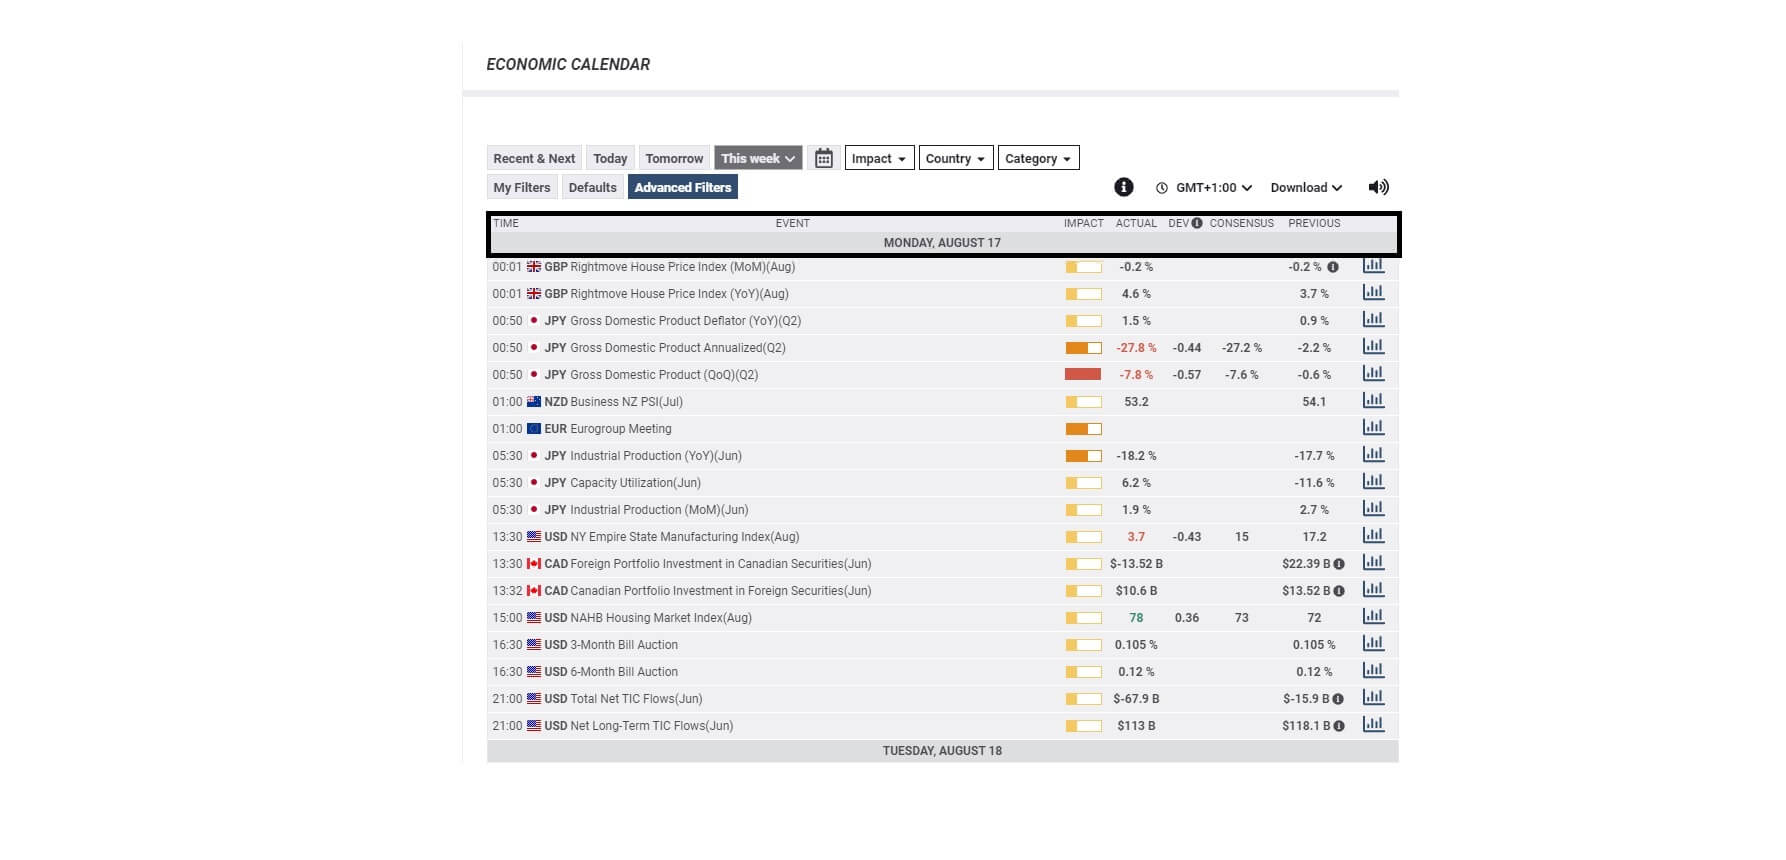
Here we can see an example of the US JOLTS job openings for June 2020, which was released on Monday the 10th of August and came out at 3 p.m. BST and we can see the various data details including May’s release, the forecast or consensus, and the actual number of 5.89 million, which was higher than the consensus and higher than the previous for May.
Although the impact bar for this particular news release was set at low, because of the implications of the virus fallout, especially within the United States, which has suffered a huge economic collapse and massive unemployment, the market will be looking for any signs that jobs are rebounding, and this is a positive sign that job openings are appearing on the market.
This means that United States companies are confidence that they are recovering from the pandemic and that they are growing to a certain extent and need extra labour manpower to fill those vacancies which have been created within those organisations.

Typically, any increase in job openings is good for the United States economy, and therefore you might expect that United States stock indices to increase and where this is also good for the US dollar. However, when we see that job openings are lower, this would be bad for the United States economy and also bad for the US stock markets and the United States dollar.

Therefore, in these unprecedented times, we should not take for granted even US data releases, or from any economy, such low-impact status data, which at any normal time in history be met by a neutered response from the marketplace. Sometimes even low impact releases can cause extra volatility, and you should bear that in mind, especially until such time as the pandemic as gone away and things returned to some kind of normality.

Categories
Forex Videos

Forex Fundamental & Economic Indicators Part 3 – Mastering Macro Economics

Fundamental Analysis – Economic Indicators – Part 3

The study of a country’s economy is called macroeconomics. Financial policy makers within a country – and also a group of countries in the case of the European Union – look at areas such as price levels, rates of economic growth, gross domestic product, employment and inflation levels. Macroeconomics looks at how a country is performing overall, and whereby policymakers will make adjustments in areas such as interest rates and may use quantitative easing or asset purchasing, should an economy require some extra stimulus.


The areas within an economy broken down into sectors including, exchange rates, interest rates, gross domestic product, government debt., unemployment, balance of trade, gross national product, and rate of inflation. Policy makers, and traders and investors want to see if a country’s economy is growing or in recession. And this can be judged by its income as a whole – or gross domestic product, its spending, debt ratio and its output.

In all there are over 20 divisions where economic indicators are released on a weekly or monthly basis. The most important is gross domestic product. Other significant economic indicators include interest rate decisions, labour and inflation reports. One of the biggest monthly economic releases in the United States is the Non Farm Payrolls, which shows the state of employment outside of the farming sector and has a tendency to cause huge volatility in the Forex market when it is released on the first Friday of each month.


Traders and analysts also keep a close eye on on production indicators including consumer goods, construction and services. As well as commodity output for things such as crude petroleum and natural gas and motor vehicles within manufacturing.

And just as important it is to you and I to control our household economies, markets also keep a keen eye out for our earnings under Wages, our consumer prices under Producer Prices, in areas such as food and energy and Retail Sales, because these tell the markets about our spending habits and if we have more disposable income. Therefore this is also a measure of the health of an economy.


Therefore it is vital that retail traders have a reliable economic calendar to refer to on a daily basis and keep a close eye out for economic data releases pertaining to the particular currency pair which you are trading, or plan to trade, on that particular day. Remember that the non-farm payroll monthly release from the United States can cause an awful lot of volatility in the marketplace and therefore any particular currency pair that you are trading, especially if it is one of the major pairs, should only be traded with extreme caution upon the release of this data.

Please remember that the more you put into learning about the Forex market, and in particular economics, under fundamental analysis, the more you will understand how these markets moves and therefore become a more profitable trader. We have all your educational needs right here at Forex.Academy. And it is all freely available.

Categories
Forex Videos

Forex Fundamental & Economic Indicators Part 2 – How Institutional Traders Read Into News

Fundamental Analysis – Economic Indicators – Part 2

Professional traders plan ahead, and so should you too. Whether you are an institutional trader with a long-term view you or an intraday retail Forex trader looking to scalp a few pics here and there. It is absolutely necessary that you plan in advance by looking at your economic calendar in order that you do not inadvertently trade at times of potential increased volatility.

Example A


In example A, on Monday 13th January 2020, we can see from our economic calendar that there is a slew of data pertaining to the British economy, which due to be released into the market at 9:30 a.m. GMT. The data is considered to be low to medium in importance and covers things such as total business investment year on year, the trade balance and industrial production month on month, which is of medium important and gross domestic product, month on month, which is also of medium importance.

Example B


In example B, which is a 1-hour chart of the GBPUSD pair, we can see that there has been a sell-off in the pair in the run-up to these figures being released. This is somewhat due to the fact that in the last few days, the Bank of England has been quite dovish regarding future growth for the British economy this year, plus strong hints that they may reduce interest rates by a half a point by the end of the year. Therefore traders are on the back foot while expecting that the British economy will continue to slow down and they will be sensitive to any data releases that point too to a weakening in the economy, which will provide further ammunition for policymakers in the Bank of England to reduce interest rates in the United Kingdom.

Example C


In example C, of our economic calendar, just a moment after the data has been released, we can see that the figures across the board are largely worse than expected, with the most important figure; which is the gross domestic product – month-on-month – showing a worse than expected decline of – 0.3%.

Example D


In example D, we have returned to our 1-hour chart of the GBPUSD, and we can see that there was a further spike lower in the pair post announcement of the economic data release.
However, we often find in the forex market, that institutional traders will have anticipated that the market data may have been worse than expected. And in some circumstances, even though the economic data release is bad for the economy, it might be perceived by traders as not being as bad as expected.
If we stick with this example for one moment, we can see that the overall trend has been to the downside with this pair. Therefore, new traders should be on their guard, because the pair may have bottomed out, even though there was bad data, and set for a reversal in price action. And this is one of the dangers when it comes to trading around economic data releases.

Example E


In example E, we return just 4 hours later to our hourly chart of the GBPUSD pair, and we can see that indeed price action had bottomed out because traders had anticipated that all the bad news was already in the price, and they decided to buy the pair.

In part 3, we will be looking at different types of economic indicators and their importance to the financial markets.

Categories
Forex Course Guides

Forex Course 2.0 – Complete Guide

Hello there,

We hope you guys are following the course well. We have done with Course 2.0, and we quickly want to sum up the concepts we have discussed in this course. Also, this article will act as a guide for you in finding any particular articles or for a quick overall revision. Basically, this is a quick navigation guide of Forex Course 2.0.

We have started this course by understanding one of the most important parts of the Forex Industry – Brokers. We also learned the different types of brokers, tips to pick the right broker, and whom to stay away from. We have also understood the different types of analysis that are used by retail traders like us to forecast the price of a currency in the Forex Market. Below is the link for each of the lessons we have published.

Brief History and Introduction to The Forex Brokers – Link

Types 0f Brokers in the Foreign Exchange Market – Link 

Two Types of ‘No Dealing Desk’ Brokers – Link

Understanding the Concept of Spreads in Forex – Link

Two Different Types Of Spreads In The Forex Market – Link

Picking A Genuine Forex Broker 101 – Link

How to stay away from the Forex Bucket Shops – Link

Steps Involved In Opening A Forex Trading Account – Link

Analyzing The Forex Market – Fundamental Analysis – Link

Analyzing the Forex Market – Technical Analysis – Link

Analyzing the Forex Market – Sentimental Analysis – Link

Which is the best way to analyze the market? – Link

So with that, we have ended our course 2.0. The upcoming course 3.0 is the most valuable course we will be providing at Forex Academy. The entire course is going to deal with the Technical Analysis right from the fundamentals. This course is designed by the top price action traders in the industry, and we are super excited to start rolling out this course for our readers. Are you excited too? Stay tuned!

We hope you find this comprehensive guide useful. Let us know if you have any questions regarding Course 2.0 in the comments below. Cheers!

Categories
Forex Course

47. Which is the best way to analyze the market?

Introduction

Now with the knowledge of three type analysis, let us determine the best type of analysis suitable for you.

Before that, let’s brush up through the previous lessons.

✨ Fundamental Analysis – This is a technique to analyze the market by considering the factors which affect the supply and demand of security (currency). Some of the fundamental indicators include interest rates, inflation, GDP, money supply, manufacturing PMI, etc.

✨ Technical Analysis – It is the analysis of the market by understanding the historical price movements of the currency. In other words, it is the study of price movements using technical tools like candlestick patterns and indicators.

✨ Sentimental Analysis – This type of analysis involves understanding the real essence of trading. Here, we get into the shoes of the bug players and determine if they’re buying or selling.

Out of these three, which do you think can help you find success in trading? Well, as a matter of fact, once can succeed in trading only if they have the knowledge of all these three types of analysis. Let us understand with an example of the hurdles that can come your way if you focus only on one type of analysis.

Let’s say a trader named Tim trade only on technical analysis, and he found a good buying opportunity on EUR/USD. But, after he hits the buy, he sees the market falling straight down 100 pips against him due to some news he wasn’t unaware of. This situation brings in emotions in him by which he ends up closing the trade. However, later in the day, he observes that the market ends up going in the direction he predicted.

Here, though his analysis was right, the obstacles like news and emotions took over the technical analysis and put him in a loss. Hence, from this, we can conclude that technical analysis, fundamental analysis, and sentimental analysis are interdependent on each other.

How to structure your analysis?

Above, we have discussed how crucial and dependent all three types of analysis are. However, there are traders in the industry who have expertise only in a kind of analysis but still manage to grow their accounts significantly. Below are some of the tips on how one must structure their analysis, considering they specialize in technical analysis.

  • Before you begin to analyze the market, determine if there is any upcoming news on the currency, you’re looking to trade. And it is recommended to stay away from the currency pairs which have fundamental news coming in.
  • Once you determine the currency pair you’re going to trade, you can begin your technical analysis on that pair.
  • And most importantly, before you place the trade, you must have a complete plan on all the situations that can possibly occur when you’re in the trade, including position sizing, stop-loss levels, and profit-taking levels.  Because, once you enter the trade, emotions take over technical analysis which can make you take incorrect trading decisions.

Therefore, following these three simple steps can drastically bring a change in the way you analyze the markets. Cheers.

[wp_quiz id=”57535″]
Categories
Forex Assets

Knowing The Fundamentals Of NZD/USD Currency Pair

Introduction

New Zealand dollar versus the US dollar, in short, is referred to as NZD/USD or NZDUSD. This currency pair is classified as a major currency pair. In NZDUSD, NZD is the base currency, and USD is the quote currency. Trading the NZDUSD is as good as saying, trading the New Zealand dollar, as NZD is the base currency.

Understanding NZD/USD

The value (currency market price) of NZDUSD represents units of USD equivalent to 1 NZD. In layman terms, it is the number of US dollars required to purchase one New Zealand dollar. For example, if the value of NZDUSD is 0.6867, then 0.6867 USD is required to buy one NZD.

NZD/USD Specification

Spread 

The algebraic difference between the bid price and the ask price is called the spread. It depends on the type of execution model provided by the broker.

Spread on ECN: 1

Spread on STP: 1.9

Fees

Similar to spreads, fees also depend on the type of execution model. Usually, there is no fee on the STP model, but there is a small fee on the ECN model. In our analysis, we shall fix the fee to 1 pip.

Slippage

Slippage is the difference between the price asked by the trader for execution and the actual price the trader was executed. Slippage occurs on market orders. It is dependent on the volatility of the market as well as the broker’s execution speed. Slippage has a decent weight on the cost of each trade. More about it shall be discussed in the coming sections.

Trading Range in NZD/USD

The volatility of a currency pair plays a vital role in trading. It is a variable that differs from timeframe to timeframe. Understanding the range (min, avg, max) is essential for a trader, as it is helpful for reducing the cost of each trade.

The volatility gives the measure of how many pips the pair has moved on a particular timeframe. This, in turn, gives the approximate profit or loss on each timeframe. For example, if the volatility of NZDUSD on the 1H timeframe is 10 pips, then one can expect to gain or lose $100 (10 pips x $10 [pip value]) within an hour or two.

Below is a table that depicts the minimum, average, and maximum volatility (pip movement) on different timeframes.

AUD/USD PIP RANGES 

Procedure to assess Pip Ranges

  1. Add the ATR indicator to your chart
  2. Set the period to 1
  3. Add a 200-period SMA to this indicator
  4. Shrink the chart so you can assess a large time period
  5. Select your desired timeframe
  6. Measure the floor level and set this value as the min
  7. Measure the level of the 200-period SMA and set this as the average
  8. Measure the peak levels and set this as Max.

NZD/USD Cost as a Percent of the Trading Range

With the volatility values obtained in the above table, the total cost of each trade is calculated on each timeframe. These values are represented in terms of a percentage. And these percentages will determine during what values of volatility it is ideal to trade with low costs.

The total cost is calculated by adding up the spread, slippage, and trading fee. As a default, we shall keep the slippage at 2 and the trading fee for the ECN model at 1.

ECN Model Account

Spread = 1 | Slippage = 2 | Trading fee = 1

Total cost = Slippage + Spread + Trading Fee = 2 + 1 + 1 = 4

STP Model Account

Spread = 1.9 | Slippage = 2 | Trading fee = 0

Total cost = Slippage + Spread + Trading Fee = 2 + 1.9 + 0 = 3.9

The Ideal Timeframe to Trade NZD/USD

The very first observation that can be made from the above two tables is that the total costs in both the model types are more or less the same. So trading on any one of the two accounts is a fine choice.

From the minimum, average, and maximum column, it can be ascertained that percentages (costs) are the highest on the minimum column of all the timeframes. In simpler terms, when the volatility of the currency pair is very low, the costs are usually on the higher side. Conversely, when the volatility is high, the costs are pretty low. Hence, it is ideal to trade during those times of the day when the volatility of the pair is at or above average. For example, a day trader can trade the 1H timeframe when the volatility of the currency pair is above 8.8 pips. This will hence assure that the costs are pretty low.

Another way to reduce the costs is by nullifying the slippage. This can be done by placing a limit order instead of executing them by a market order. This shall reduce the total costs by a significant percentage. An example of the same is given below.

Total cost = Slippage + Spread + Trading fee = 0 + 1 + 1 = 2

From the above table with nil slippage, it is evident that the costs have reduced by about 50%. Hence, to sum it up, to optimize the cost, it is ideal to trade when the volatility is above average and also enter & exit trades using limit orders rather than market orders.

Categories
Forex Courses on Demand Forex Videos

Everything You Need To Know About Assessing The Forex Market – Qualitative VS Quantitative


The following presentation is brought to you as a courtesy of forex Academy! This is part of our service courses on demand, if you find this interesting and wish to be updated on new releases, please subscribe to our YouTube channel! Or join our community at forex dot Academy and receive all of our services for free, you’re like is also highly appreciated.

As we assess fundamental analysis on decision-making, we must look at quantitative versus qualitative data. Now considering the distinction between the two types of data, we typically define them by referring to data as quantitative, if it is numerical in form, and qualitative when the data has a more theoretical basis. Now, why is that the case? Well, qualitative data is more concerned with understanding human behaviour, from the informants perspective, and the informant is simply ourselves. As economic agents and traders, it assumes a dynamic and negotiated reality, so there’s a level of discretion to understanding. Our qualitative approach, in contrast, quantitative data, is concerned with discovering facts about social phenomena. It assumes a fixed and measurable reality; in other words, the fixed and measurable reality is the raw data, the numbers that we try to derive a social phenomena and extract thought from that.

With the methods data is collected through Participation, observation in interviews, Data are analysed by themes from descriptions by informants. Again that’s simply us and reported in the language of the informant.

In contrast their quantitative data, or collective, through measuring things. Data is analysed through numerical comparisons, statistical inferences, and data is reported through that statistical analysis. So we use with quantitative data, the raw data to formulate charts and graphs, to give us an overall picture statistically, and to look for social phenomena which obviously help trading decisions. Fundamental trading is considered to be more a qualitative approach! Qualitative research is multi-method in focus involving an interpretive naturalistic approach! This means qualitative researchers study things in their natural settings, attempting to make sense of or interpret phenomena in terms of the meanings. People bring to them research following a qualitative approaches, exploit exploratory, and seek to explain how and why a particular market is behaving. Therefore, fundamental traders often based their trade decisions on a question of value, what does that mean for our trade decisions? Well if research shows that an asset is undervalued, these traders will look for buying opportunities, if on the other hand, research suggests an asset is overvalued, these traders will look for selling opportunities.

Technical trading, on the other hand, is considered to be more a quantitative approach! Quantitative research collects data in numerical form, which is then subjected to statistical analysis. The data is then measured to construct graphs and charts, to physically represent patterns or ideas that provide statistical reasoning. As the research is used to test a theory, it aims to ultimately support or reject the hypothesis! So as this approach tests raw data, it can be applied to many different environments, and that’s a huge advantage to using this quantitative approach. Actually deriving reasoning from the raw data across many different fields, or industries data analysis, helps us turn statistical data into useful information to help with decision making. Therefore quantitative research is more focused on our objectivity, and that would certainly be the main reason why we would say quantitative approach or quantitative trading, it has more of an essence of technical trading. As technical traders, we want to become very objective, if we look towards our technical indicators, take Bollinger Bands as an example, it uses a statistical model across a variation from the mean. It follows price action to look for objective trading decisions as such. Technical trading is considered to be much more of a quantitative approach.


Categories
Forex Market Analysis

Markets’ Attention On Summer


Weekly Update (July 9th – 13th)


Macroeconomic Outlook

Summer is in focus now, and with it, the attention on the multiple factors that will condition whether it will be a good summer for the markets or a bad one.

Nevertheless, all these factors that unnerve investors are reaching a final outcome.

  • Last week, the markets performed better as the matters that block them improved slightly.
    • European policy and German politics have reached an outcome.
    • Then oil, which is still a problem.
    • And protectionism which is something more bilateral between China and USA rather than global.
      • When the market realises that, it will care less about it.

We were expecting a hard summer, however, the markets are starting to react in a positive way sooner than expected.

This week has three main references:

  • On Tuesday, the German ZEW Economic Sentiment which is expected to be negative again for the fourth month in a row.
    • It is relevant enough to watch out for but nothing especially important as the overall German economy has been increasing recently at 2.5% in the last trimester, which is really good.
  • On Thursday, there is US Core CPI which is forecasted to rebound from 2,2 to 2,3. This issue depends mostly on oil prices.
    • Over-inflated data may hurt bonds, nevertheless structurally it will not be a real matter which could be solved in 2 or 3 months.
  • And the third reference is American corporate results which start, among the big ones, on Tuesday with Pepsi Co.
    • And on Friday, three big banks publish results
      • Citi / +23%
      • JP Morgan / +30%
      • Wells Fargo / +11% and with some legal problems
    • They are expected to be really solid which will support markets.

Hence, this week looks like where a more positive sentiment towards markets can be consolidated.

  • German political turmoil looks clearer than before.
    • Even though it will come back in October with the elections.
  • Regarding oil, American pressures regarding an increase in production are graspable which will lead to Saudi Arabia producing more, and reducing oil prices.
    • This will reduce inflation related concerns.
  • Then, there is the protectionism which is mostly between the USA and China, being something more local rather than something global.
    • So that, when the market realises that along with strong corporate results, a good economic growth and a lot of liquidity, it will lead to an overall favourable economic cycle which will support the markets.
Categories
Forex Market Analysis

Markets Going Through Short-term Obstacles

Weekly Update – July (2nd– 6th)

  • Macroeconomic Outlook

The overall context for this week is not all bad, but also not at all good. However, the possible absence of bad news in the upcoming weeks will allow markets to rebound from the recent sell-off. As it as has been seen last Friday, markets do not need too much news to rebound and improve. This means that in the end, the fundamentals of the market are still solid and short-term obstacles are what’s blocking them to move forward.

  • Last Friday, as soon as there was a principle of agreement about immigration within the Eurozone, this has allowed us to see a more constructive future and release pressure over Germany and its immigration policy.
    • Indeed, one of the three short-term obstacles of the markets is the German policy over immigration which in reality, if the policy of the European Union, as with many other countries like Spain, Italy or Austria are also facing similar problems.
    • Second factor is oil prices, which increase the concerns of inflation.
    • Third factor is protectionism.

1.- Hence, there should not be any bad news this week. Indeed, the government coalition in Germany, after the semi-agreement about immigration in the Eurozone and the stronger sense of state by political forces, can take more shape.

  • At the end, the sense of state will be imposed in Germany and this variable will be disappearing, reducing the threat of instability of the markets.

2.- Regarding oil, there is always new news that will lead to an increase in prices. This increase in price is affecting inflation and is providing a strong support to bonds, making them overvalued.

  • At first, this is bad for the markets since the cash flow of money always goes to safe havens, feeling more secure in bonds ahead of these types of events.
  • It gives the impression that concerns over oil prices will not be possible to solve during the upcoming weeks, however, it will not also get worse.

3.- Then, we have protectionism. It is in a similar situation to oil, it does not have a better outlook towards the future. However, we already know it is something mostly bilateral between the United States and China rather than global.

  • Over time, more controversial news will be released because the import will rise to 50bn to 200bn for example but will not happen immediately.

This week, with this improvement in the fundamental background of the markets due to the apparent absence of bad news, it is necessary to bear in mind that:

  • This Wednesday is a holiday in the United States, which lowers the activity in the markets.
  • On Thursday and Friday, there will be a convention meeting of Central Banks in Austria where the most hawkish bankers will probably have the word.
    • This will probably lead to bonds not being that comfortable and retrace slightly, and in the absence of bad news, the markets should perform better.
  • The third reference of the week is the American wages and unemployment rate.
    • The Unemployment Rate should not weight as much as everyone know it is going really well.
      • The rate is forecasted to remain at 3.8% and creation of employment probably would be under 200k.
      • Regarding wages, the indicator can reach 2.8% coming from a previous 2.7%. Any figure close to 3% can increase the concerns on inflation.
      • Nevertheless, at the same time, concerns of inflation can affect bonds, and whatever influences bond gives some breath to the markets.

Therefore, considering the current context with all these factors and references, it appears to be good for the markets in absences of bad news and strong fundamentals.

  • Short-term will remain hard and nothing will be solved quickly, nonetheless, looking to the medium-term, investors should remain calm and follow the triple P rule:
    • Positioning
    • Perseverance
    • Patience