Fundamental Analysis – Economic Indicators – Part 2
Professional traders plan ahead, and so should you too. Whether you are an institutional trader with a long-term view you or an intraday retail Forex trader looking to scalp a few pics here and there. It is absolutely necessary that you plan in advance by looking at your economic calendar in order that you do not inadvertently trade at times of potential increased volatility.
Example A
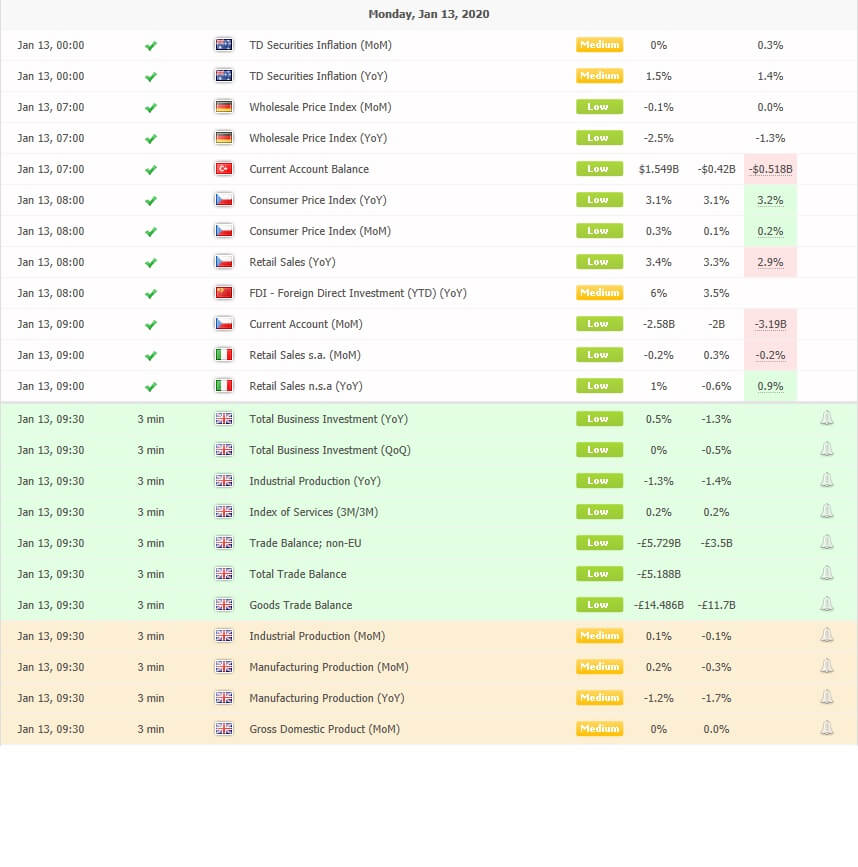
In example A, on Monday 13th January 2020, we can see from our economic calendar that there is a slew of data pertaining to the British economy, which due to be released into the market at 9:30 a.m. GMT. The data is considered to be low to medium in importance and covers things such as total business investment year on year, the trade balance and industrial production month on month, which is of medium important and gross domestic product, month on month, which is also of medium importance.
Example B
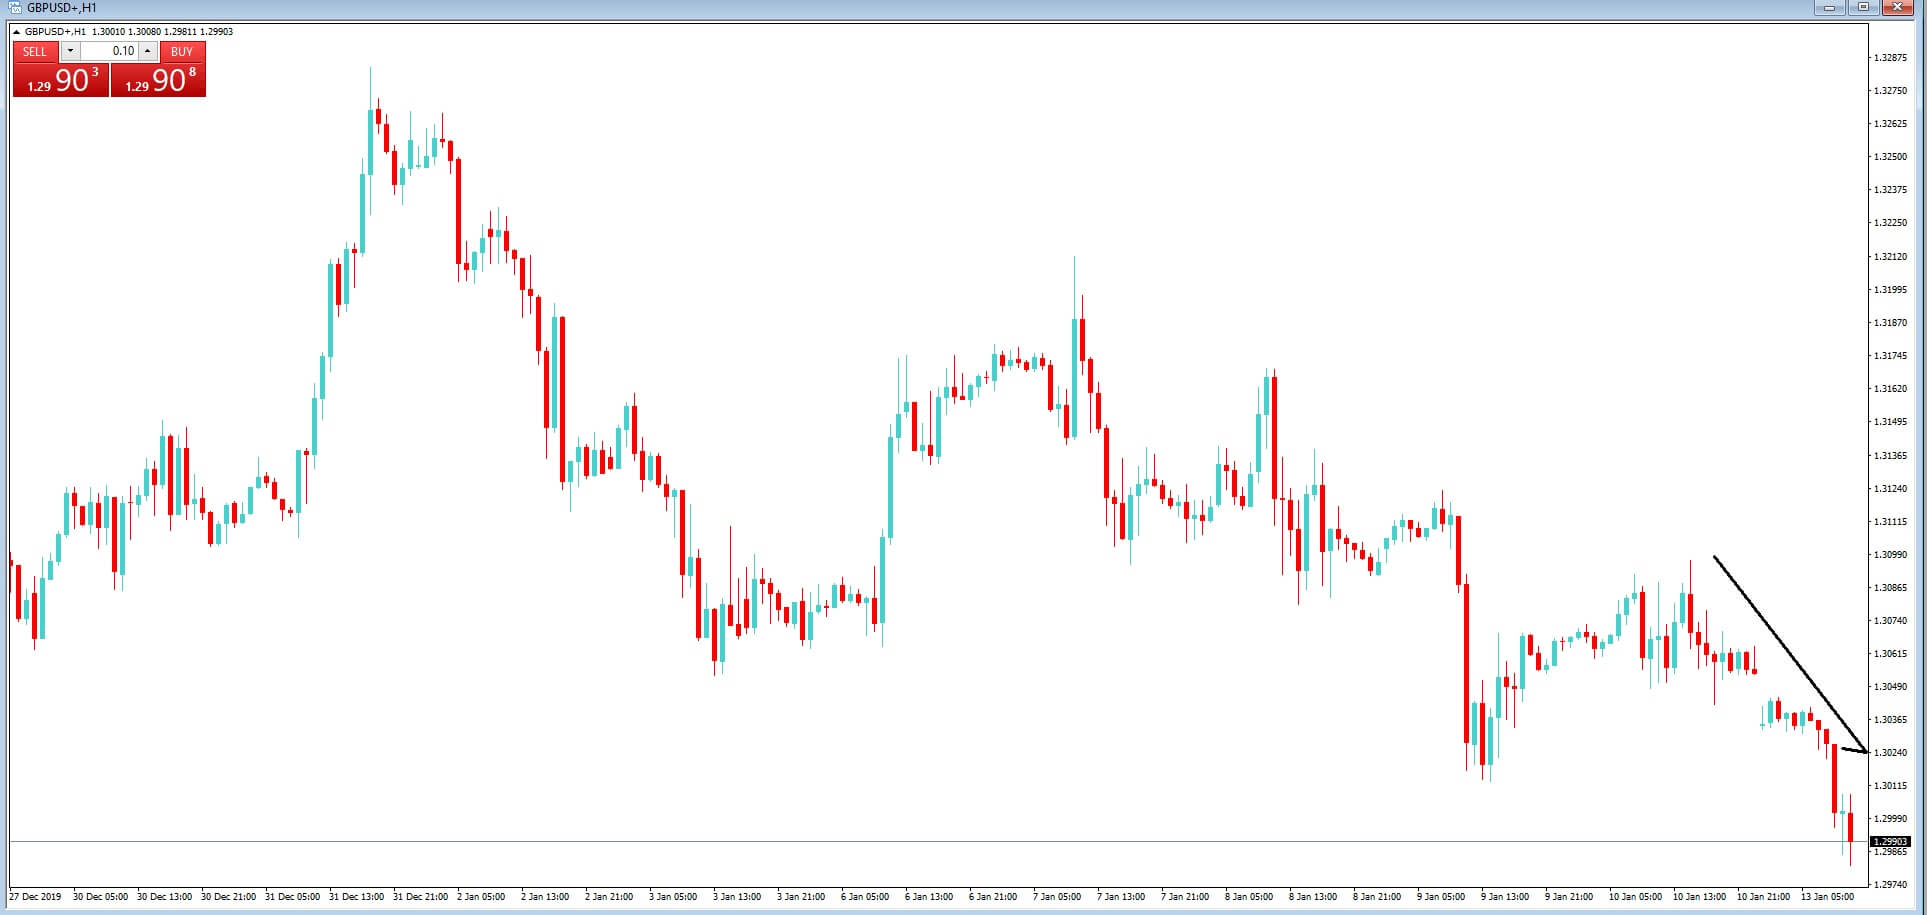
In example B, which is a 1-hour chart of the GBPUSD pair, we can see that there has been a sell-off in the pair in the run-up to these figures being released. This is somewhat due to the fact that in the last few days, the Bank of England has been quite dovish regarding future growth for the British economy this year, plus strong hints that they may reduce interest rates by a half a point by the end of the year. Therefore traders are on the back foot while expecting that the British economy will continue to slow down and they will be sensitive to any data releases that point too to a weakening in the economy, which will provide further ammunition for policymakers in the Bank of England to reduce interest rates in the United Kingdom.
Example C
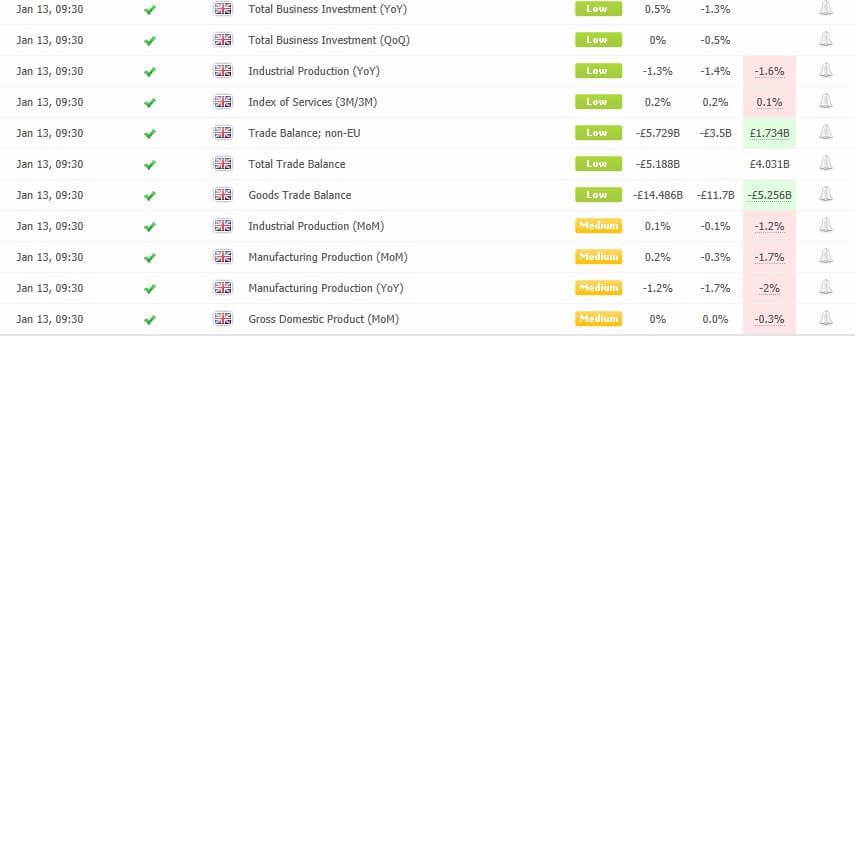
In example C, of our economic calendar, just a moment after the data has been released, we can see that the figures across the board are largely worse than expected, with the most important figure; which is the gross domestic product – month-on-month – showing a worse than expected decline of – 0.3%.
Example D
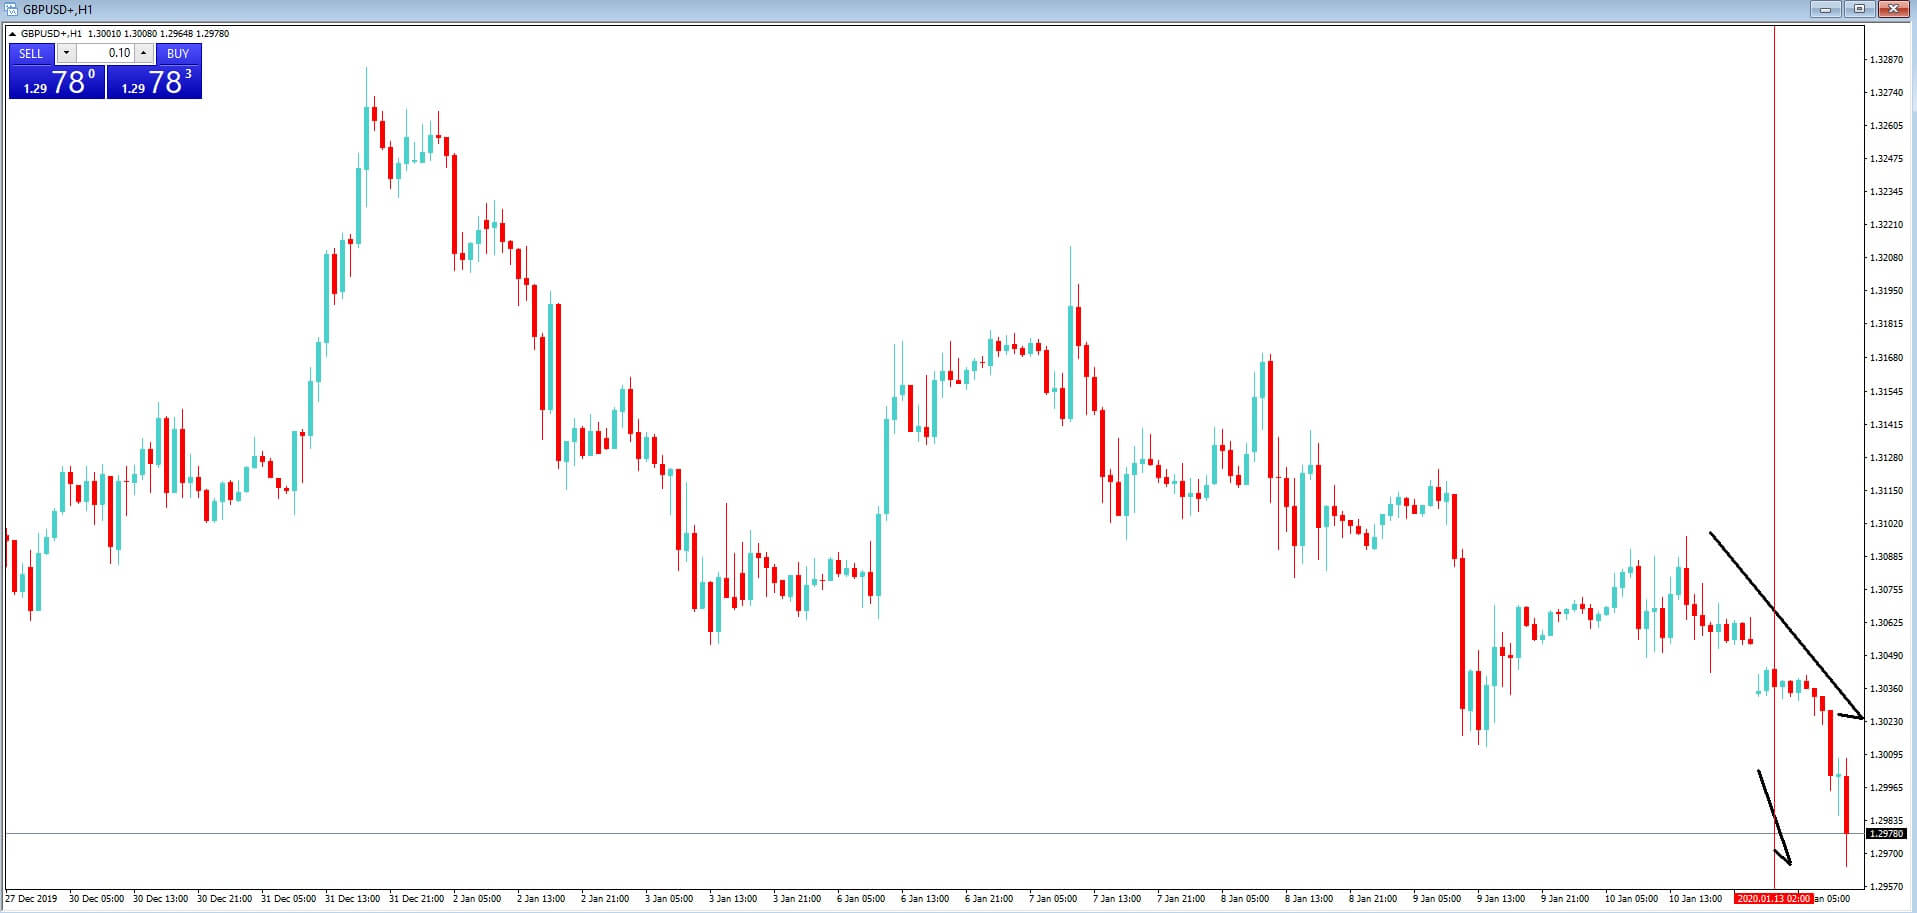
In example D, we have returned to our 1-hour chart of the GBPUSD, and we can see that there was a further spike lower in the pair post announcement of the economic data release.
However, we often find in the forex market, that institutional traders will have anticipated that the market data may have been worse than expected. And in some circumstances, even though the economic data release is bad for the economy, it might be perceived by traders as not being as bad as expected.
If we stick with this example for one moment, we can see that the overall trend has been to the downside with this pair. Therefore, new traders should be on their guard, because the pair may have bottomed out, even though there was bad data, and set for a reversal in price action. And this is one of the dangers when it comes to trading around economic data releases.
Example E
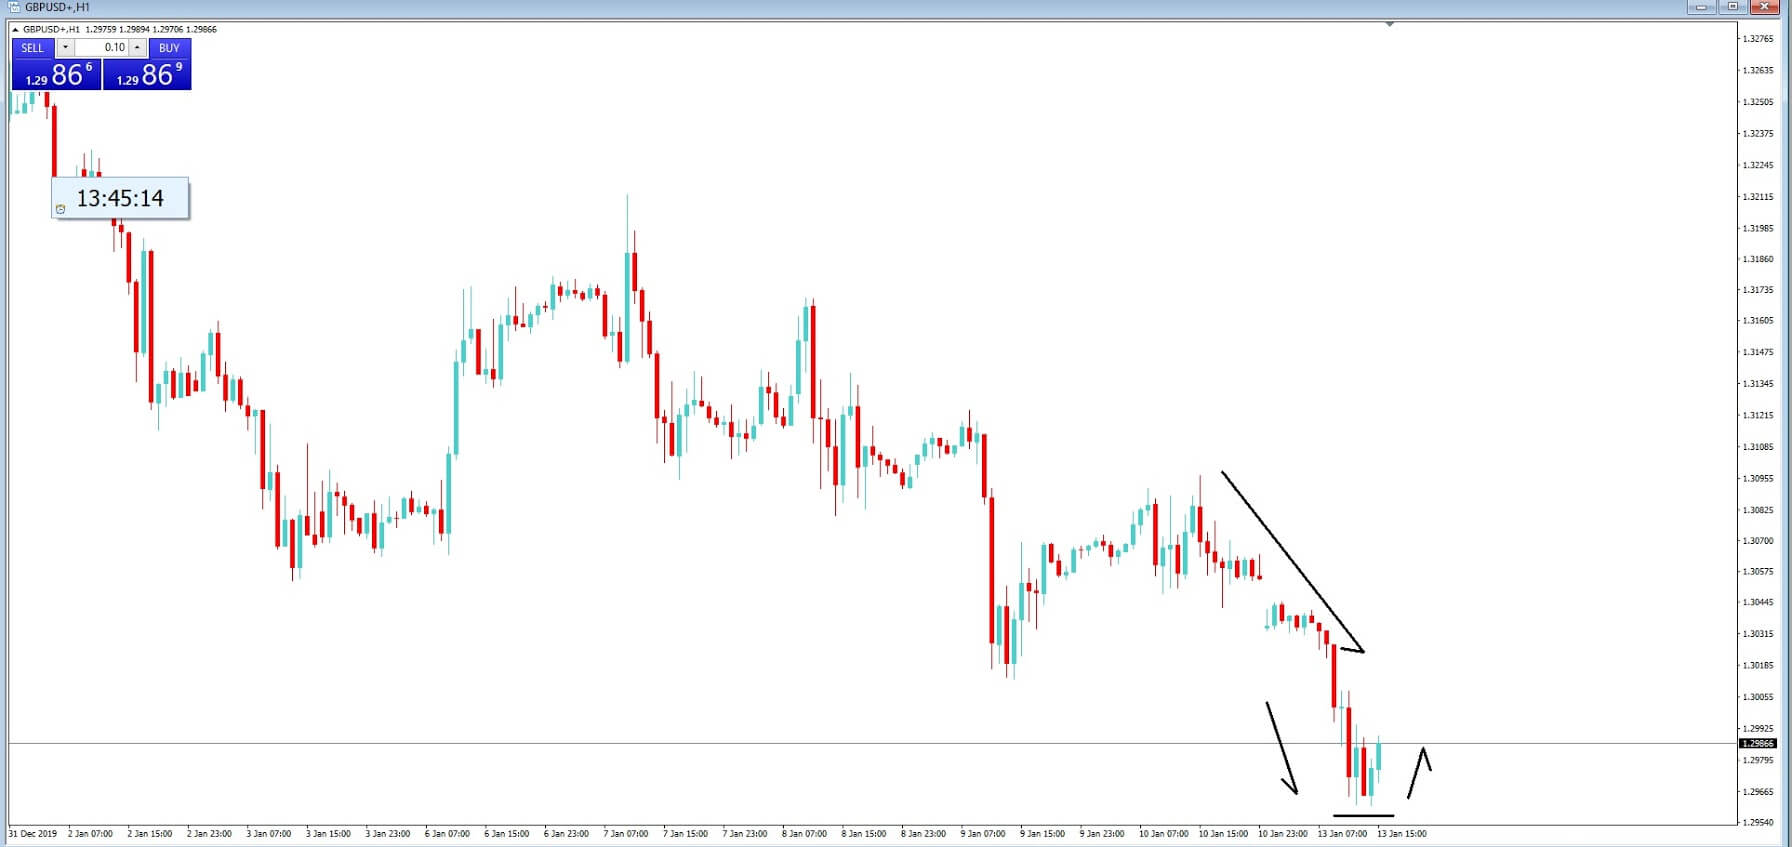
In example E, we return just 4 hours later to our hourly chart of the GBPUSD pair, and we can see that indeed price action had bottomed out because traders had anticipated that all the bad news was already in the price, and they decided to buy the pair.
In part 3, we will be looking at different types of economic indicators and their importance to the financial markets.