Introduction
The Shooting Star is one of the most popular bearish candlestick patterns in the industry. This pattern appears in an uptrend most of the time, and it indicates bearish reversals in the price action of any underlying currency. So basically, when this pattern appears on the charts, it implies that the buyers are exhausted, and its sellers turn to lead the market. Once we have identified the Shooting Star pattern in an uptrend and confirm the trend reversal with any other credible indicator, we should look to open a short position.

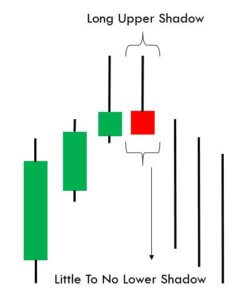
This pattern has a unique structure as it consists of a small body and a high upper wick, as shown in the image below. This image accurately represents the trend reversal because we can clearly see the buyers losing momentum and sellers taking over the market.
Trading strategies with the Shooting Star pattern
Shooting Star + Stochastic Indicator
In this strategy, we have paired the Shooting Star pattern with the Stochastic Indicator to identify the trading opportunities. Just like RSI and MACD, the Stochastic Indicator also belongs to the oscillator group. It is developed in the 1950s, and it is still widely used by the traders. The Stochastic indicator oscillates between 0 & 100 levels. When the indicator goes below 20, it means that the currency pair is oversold. Similarly, when the indicator goes above the 100 level, it indicates that the currency pair is overbought.
STEP 1 – First of all, find the Shooting Star pattern in an uptrend.
STEP 2 – Check the Stochastic indicator
Once you find the Shooting Star pattern, the next step is to check the Stochastic Indicator. If the indicator is giving a reversal at the oversold area, it indicates the overbought market conditions.
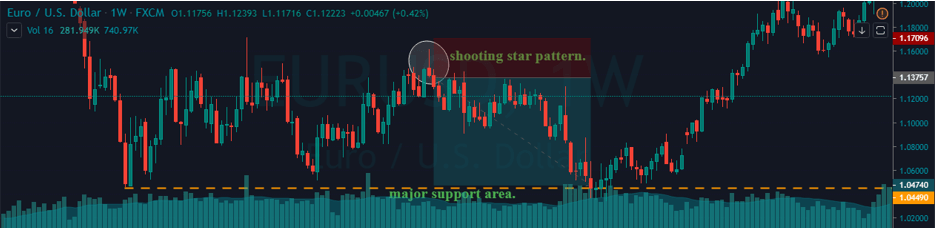
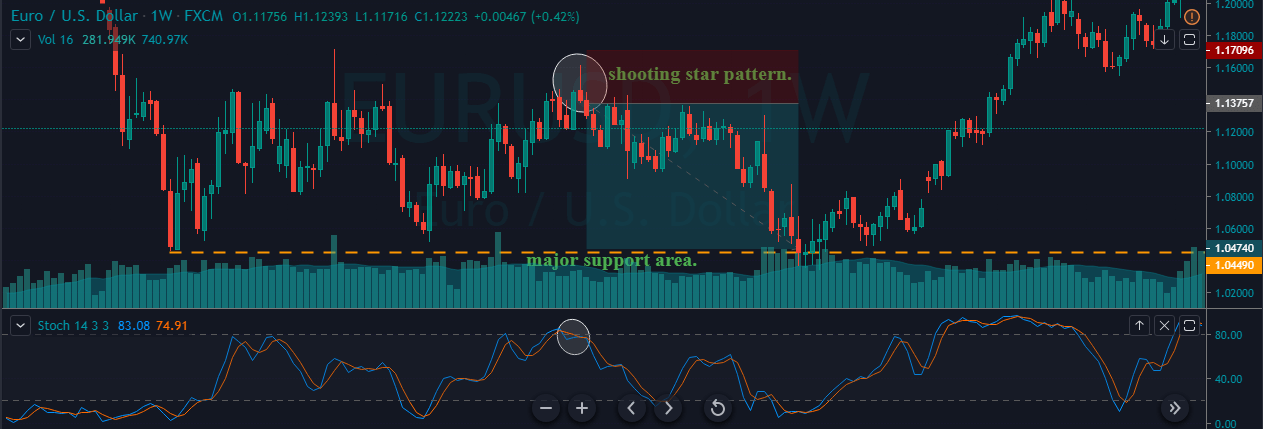
The image below represents the EUR/USD weekly Forex chart. In this pair, price action was held at a significant resistance area, and it prints the Shooting Star pattern. Also, the Stochastic indicates the overbought conditions. These three clues clearly say that this pair is all set to change its direction. The Stochastic pattern on a higher timeframe has very higher chances to perform. So whenever you find this pattern, and if it supports the rules of this strategy, always trade big.
Step 3 – Stop-loss and Take Profit
A stop loss is specially designed to limit the loss of the trader. So before activating your trade, it is essential to decide where you are going to place the stop loss. In the example above, we put the stop loss just above the Shooting Star candle.
Shooting Star pattern indicates the reversal in price action. This means that we are catching the top of the trend. As the end goal of every trader is to maximize their profits and minimize losses, always try to hold the positions for more extended targets.
In the example, we have closed our position at a higher timeframe support area. We can use the higher timeframe support or look for the Stochastic Indicator to reach the oversold area. Another way to close the position is when the market reaches the major support area while the Stochastic is in the oversold area.
As we can see in the image below, we closed our full position at a significant support area. You can use the Stochastic or any other trading tool to exit your position, but we always suggest to use the considerable support/resistance area to book profits.

Shooting Star Pattern + Awesome Oscillator
In this strategy, we have paired the Shooting Star pattern with the Awesome Oscillator to identify the trading opportunities. The Awesome Oscillator is a boundless indicator. When the Awesome Oscillator reverses below the zero-level, it indicates the buying pressure. When it reverses above the zero-level, it means sellers are ready to lead the market. Furthermore, some traders use this indicator to confirm the strength of the trend. When the indicator goes above zero-level, it means the buying trend is quite strong, and when it goes below the zero-level, it shows the sellers dominating the market.
Step 1 – First of all, find the Shooting Star pattern in an uptrend.
Step 2 – Look for the Awesome oscillator reversal
Once we find the Shooting Star pattern, the next step is to take a sell-entry when the Awesome Oscillator reverses at overbought market conditions.
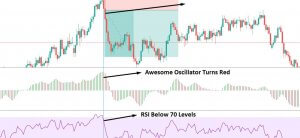
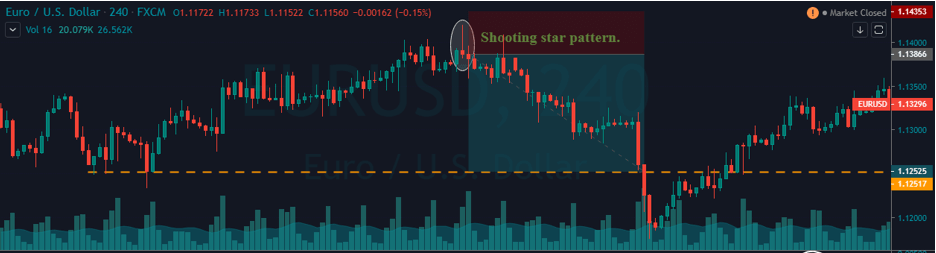
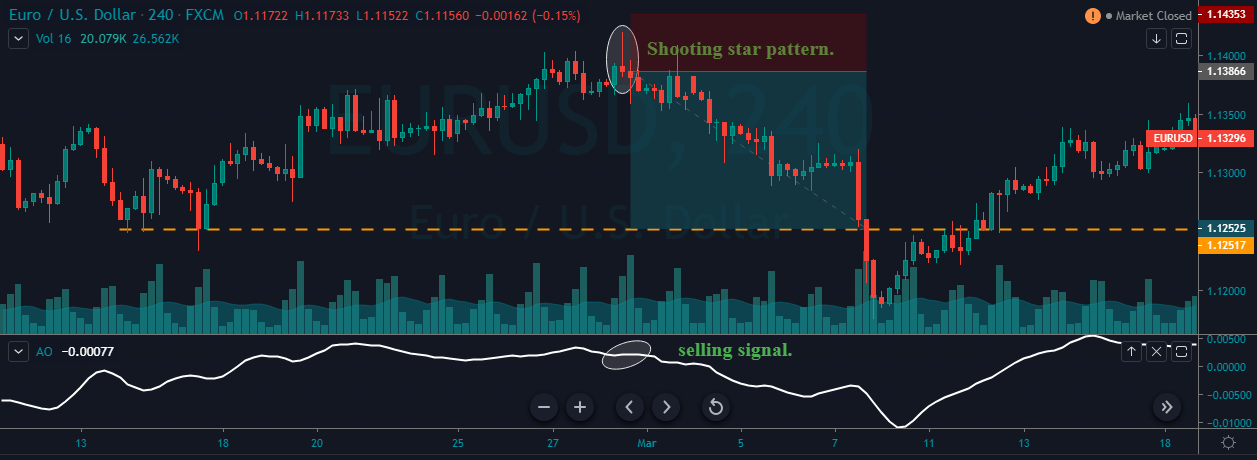
The image below is the EURUSD 240 chart. On this pair, at first, the buyers were quite weak, and they started holding at the resistance area. Furthermore, in that small range, price action turned sideways, and it printed the Shooting Star pattern. The Awesome Oscillator even reversed at the overbought conditions. Both of the trading tools are indicating the exhaustion of the buyers. And sellers are ready to take over the market.
Step 3 – Take Profit and Stop loss
Every trader has different expectations from the market, some like to trade short term trends, and some like to trade longer-term moves. If you are an intraday trader, then we suggest you close your position when the Awesome Oscillator reverses at the oversold area. But, if you are a swing trader or investor, wait for the opposite pattern (Hammer Pattern) to appear to close all of your positions. We can even use the higher timeframe support/resistance area to close our positions.
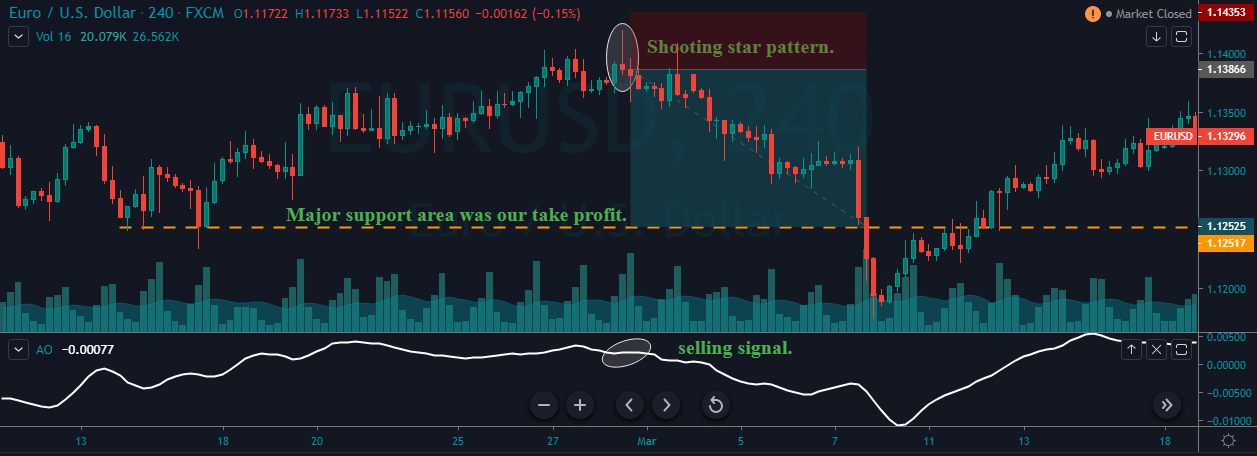
We advise you to place the stop-loss order above the Shooting Star pattern. As you can see in the image below, we booked full profits at the major support area. After that, the price action dropped a bit more but reversed immediately to follow the buy direction. It is important not to ignore the higher timeframe support/resistance areas.
The psychology behind the Shooting Star Pattern
At first, we see the buyers enjoying the uptrend as the price of the currency keeps printing brand new higher high. As this euphoric moment begins to set in, the sellers start to sell their positions at higher prices. Now the buyers get panicked, and even they start to sell their positions. Now that the buyers and sellers are both selling their positions, panic is created in the market, which leads to a sharp reversal in price action. Thus a long wicked small body candle appears on the trading charts.
Keep in mind that the Shooting Star pattern is more reliable when it is formed after the three consecutive bullish candles. It creates strong bullish pressure on the price chart, and in such cases, the upper wick of Shooting Star is even longer. It indicates that the price is about to reverse with even more strength.
Bottom line
The Shooting Star is a single candle pattern, and it is the most popular trend reversal pattern in the industry. There is a strong psychological pattern that exists beyond the Shooting Star pattern. When the market is in an uptrend, and when buyers gain exponential strength, most of the traders book the profit, and as a result, the bullish trend loses its strength. This results in sellers sending the price down. Most of the time, the Shooting Star pattern provides the 3:1 risk-reward ratio trades.
We hope you find this article informative. Please let us know if you have any questions regarding the same in the comments below. Cheers!