In this article, we paired the Bullish Pennant trading pattern with Awesome Indicator to identify the trading signals.
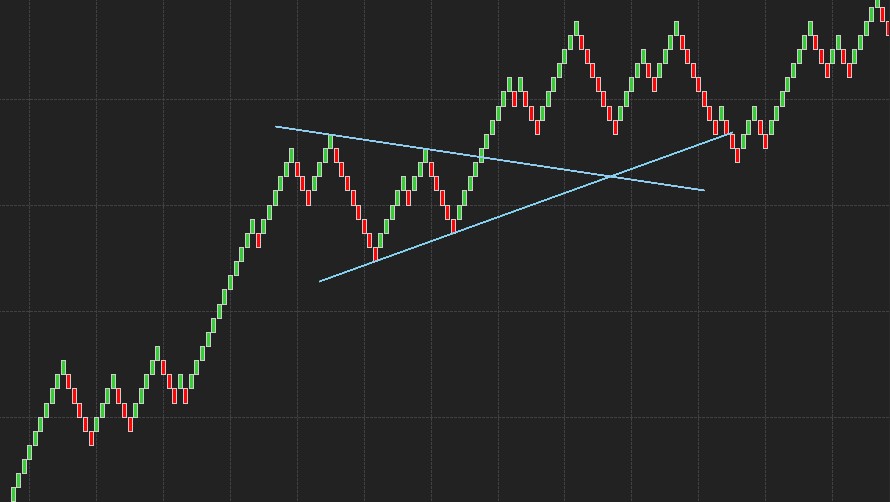
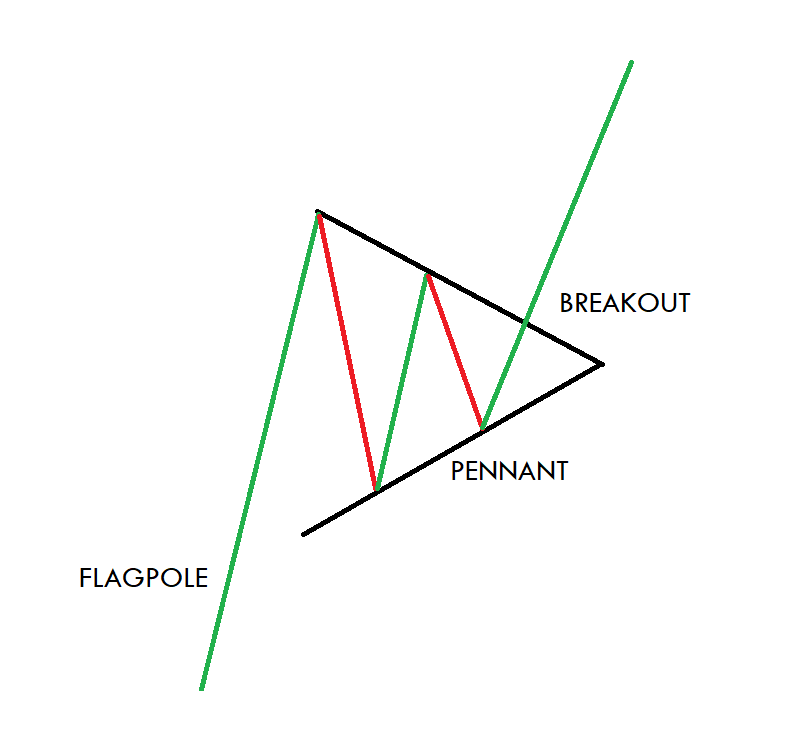
BULLISH PENNANT PATTERN
Bullish Pennant is a continuation trading pattern that appears in an ongoing uptrend which used by the traders to predict the upcoming market movements. The pattern is seen when the asset experiences large upward moves followed by a brief consolidation, before continuing to move in the direction of the ongoing trend.
Key Characteristics of the Bullish Pennant Pattern
A FLAGPOLE – The pattern always begins with a flagpole which is an indicator of a strong uptrend.
BREAKOUT LEVELS – You will witness the two breakouts level on the pattern, the first one is at the end of the flagpole and another one after the consolidation phase.
PENNANT ITSELF – It is a triangular pattern that appears when the market consolidates between the flagpole and the breakout.
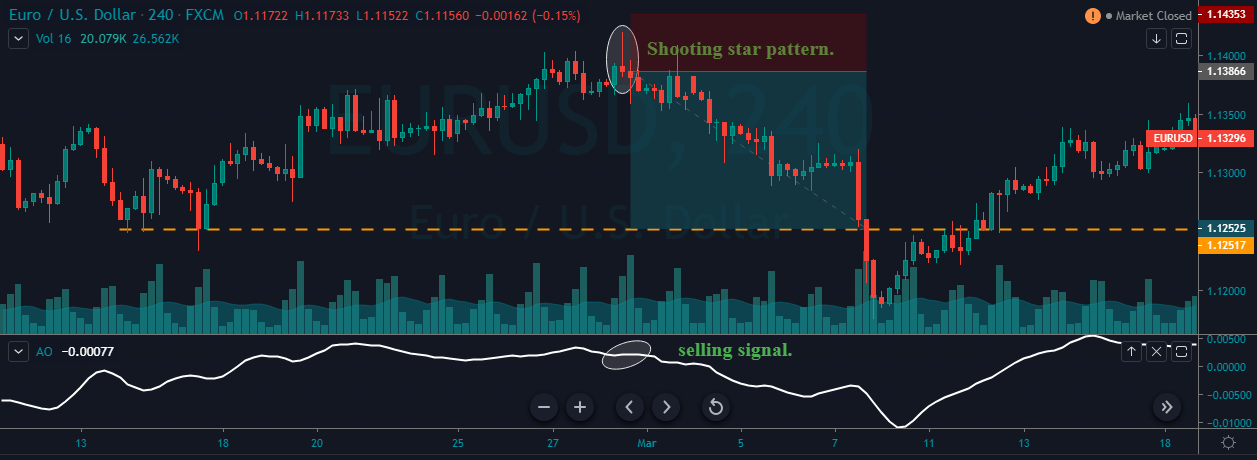
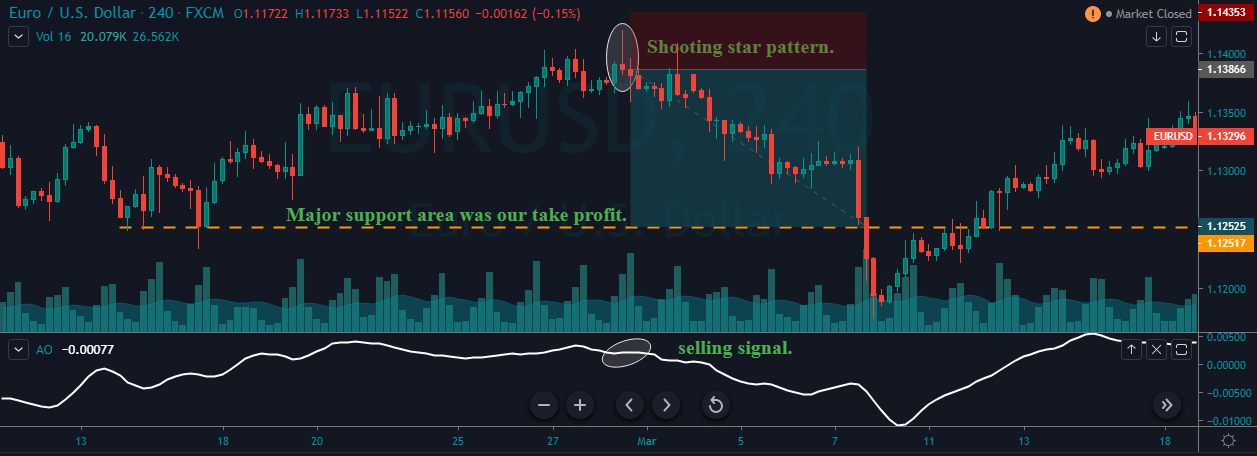
AWESOME OSCILLATOR
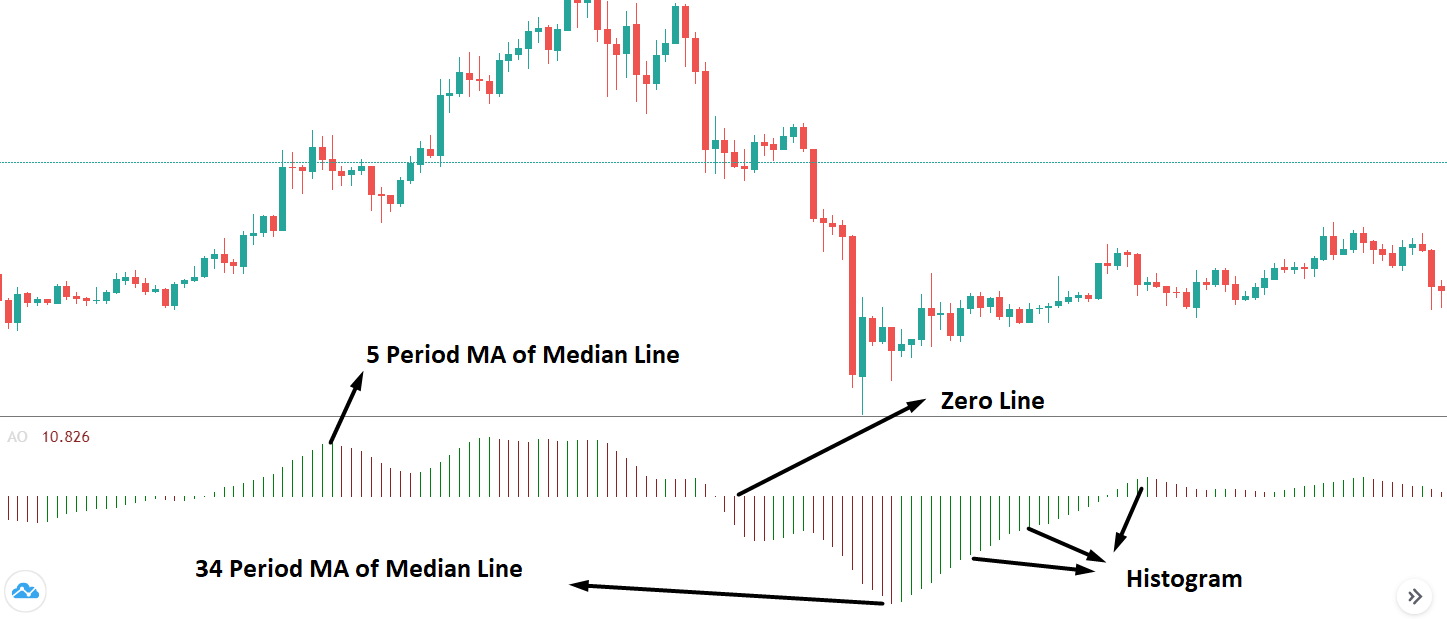
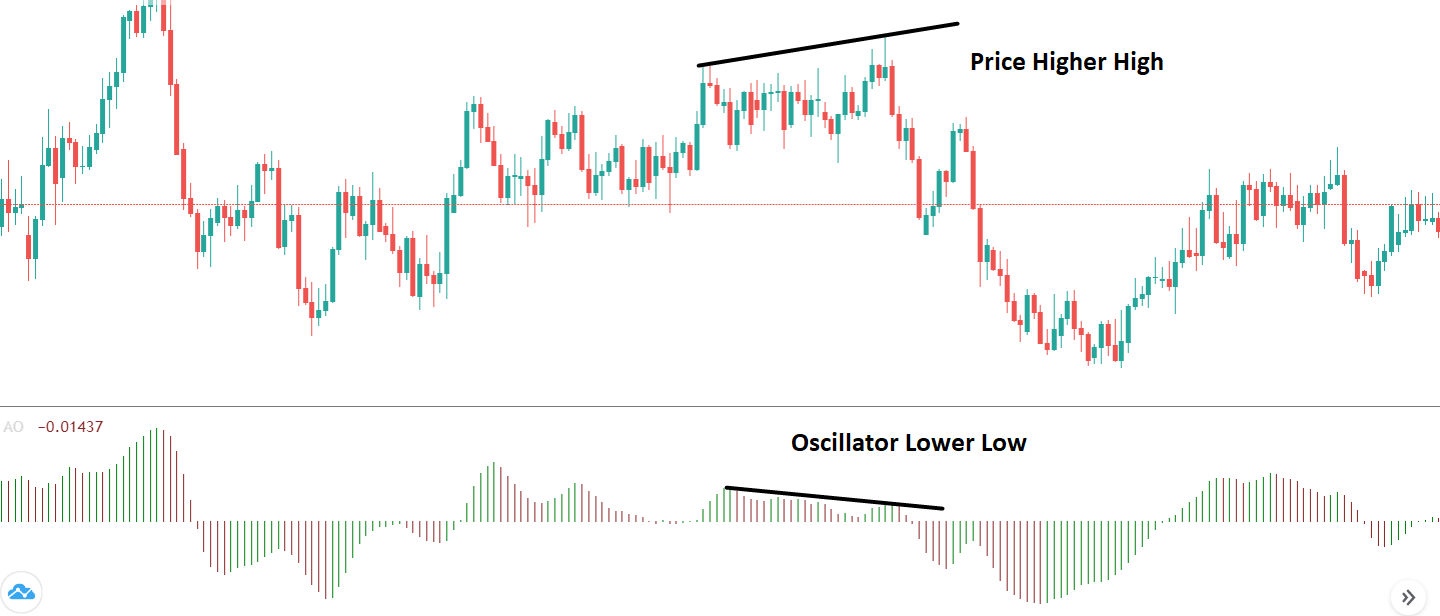
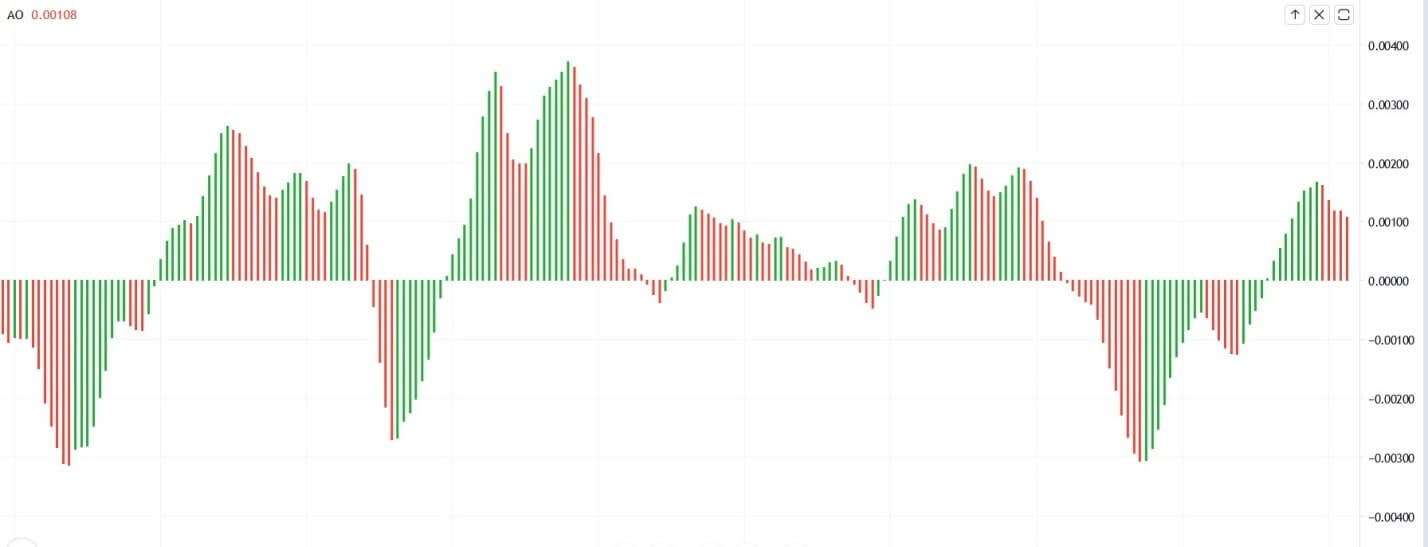
Awesome is a momentum oscillator developed by the technical analyst Bill Williams to determine whether the buyers or bears are dominating the market. The indicator is used to gauge the market momentum and to affirm the ongoing trend; also, it is used to anticipate the upcoming reversals. Depending on your charting platform, the indicator most often appears in many different formats, but the most common format is the histogram. The indicator fluctuates between the positive and negative territory; A positive reading means the faster period is greater than, the slower ones, and the negative reading the fast is less than the slow.
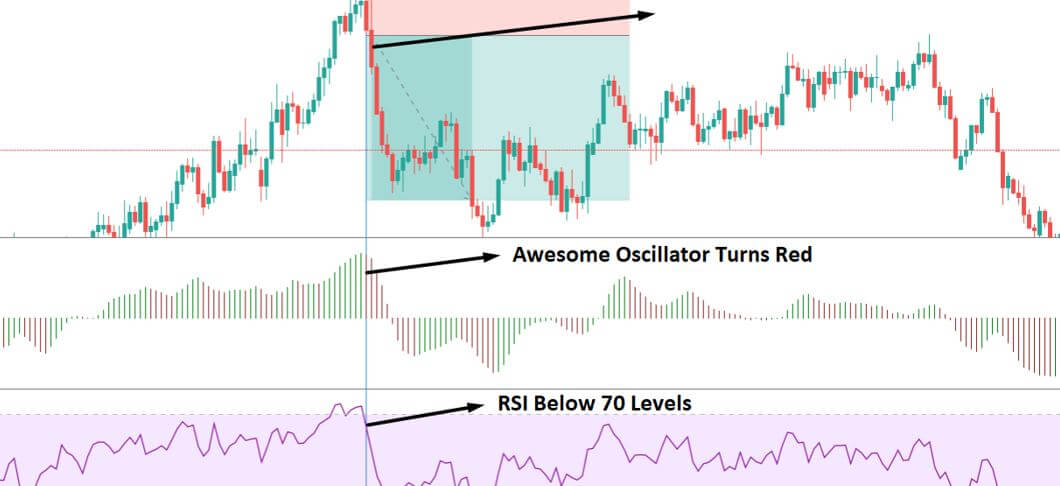
The image below represents the Awesome oscillator on the price chart.
TRADING STRATEGIES
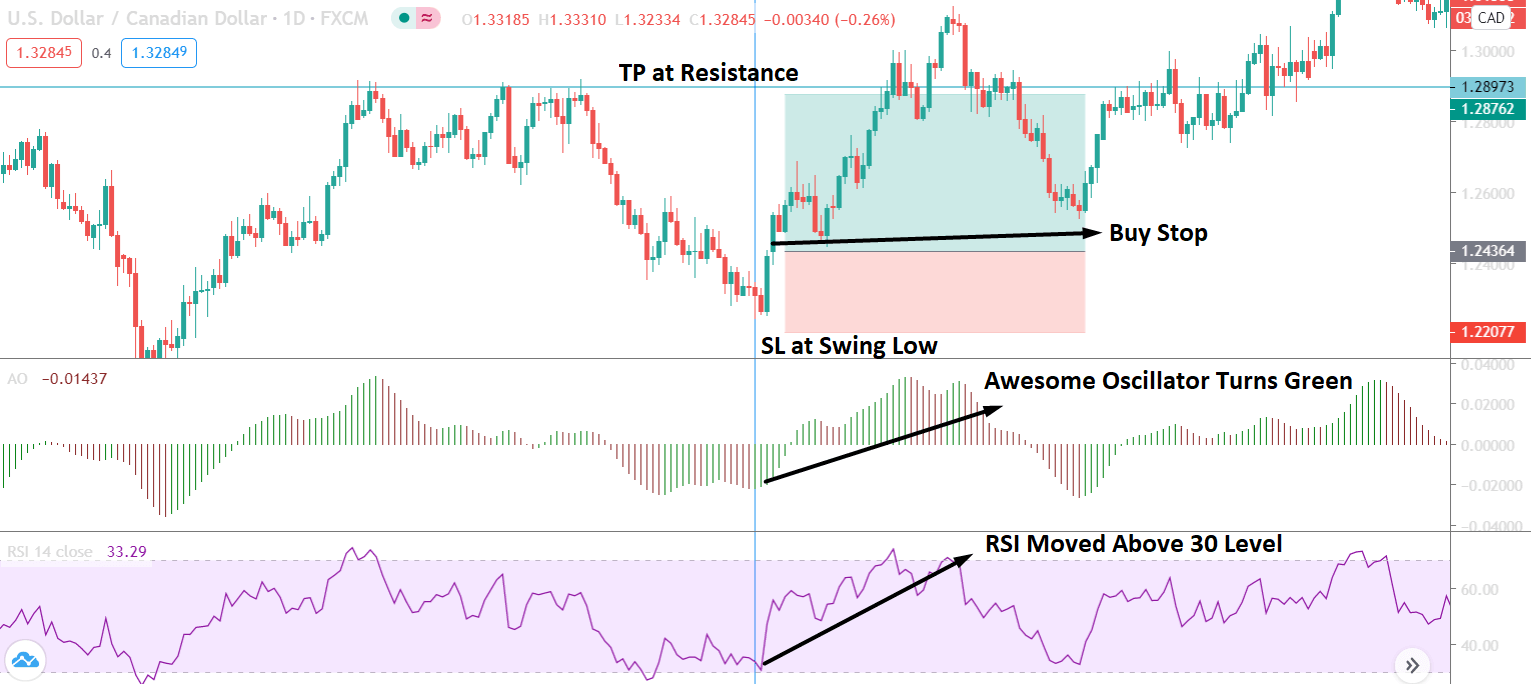
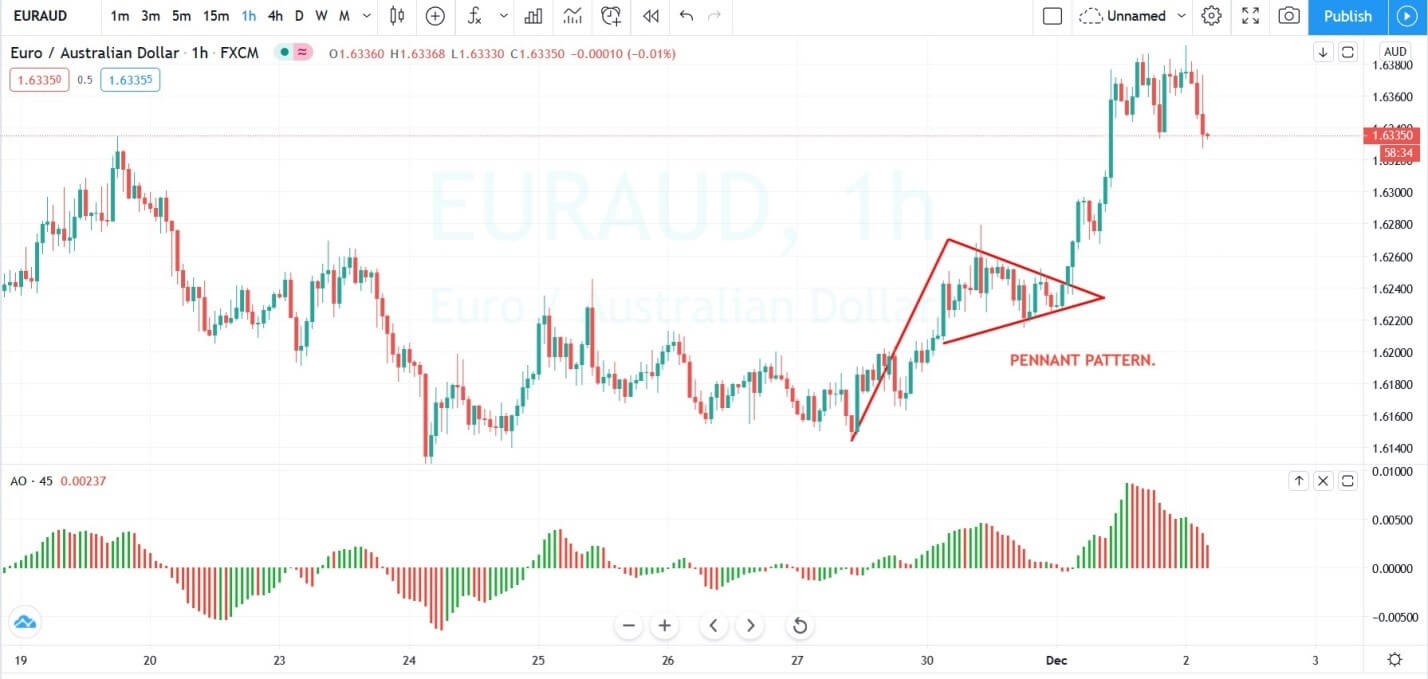
The image below represents the bullish trend and pennant pattern on the AUDUSD chart. This formation appears on the sixty-minute chart, which mostly used by traders for intraday trading. The awesome oscillator was already above the zero lines, which means the buying momentum is stronger, and the breakout of the pennant pattern was a sign to go long.

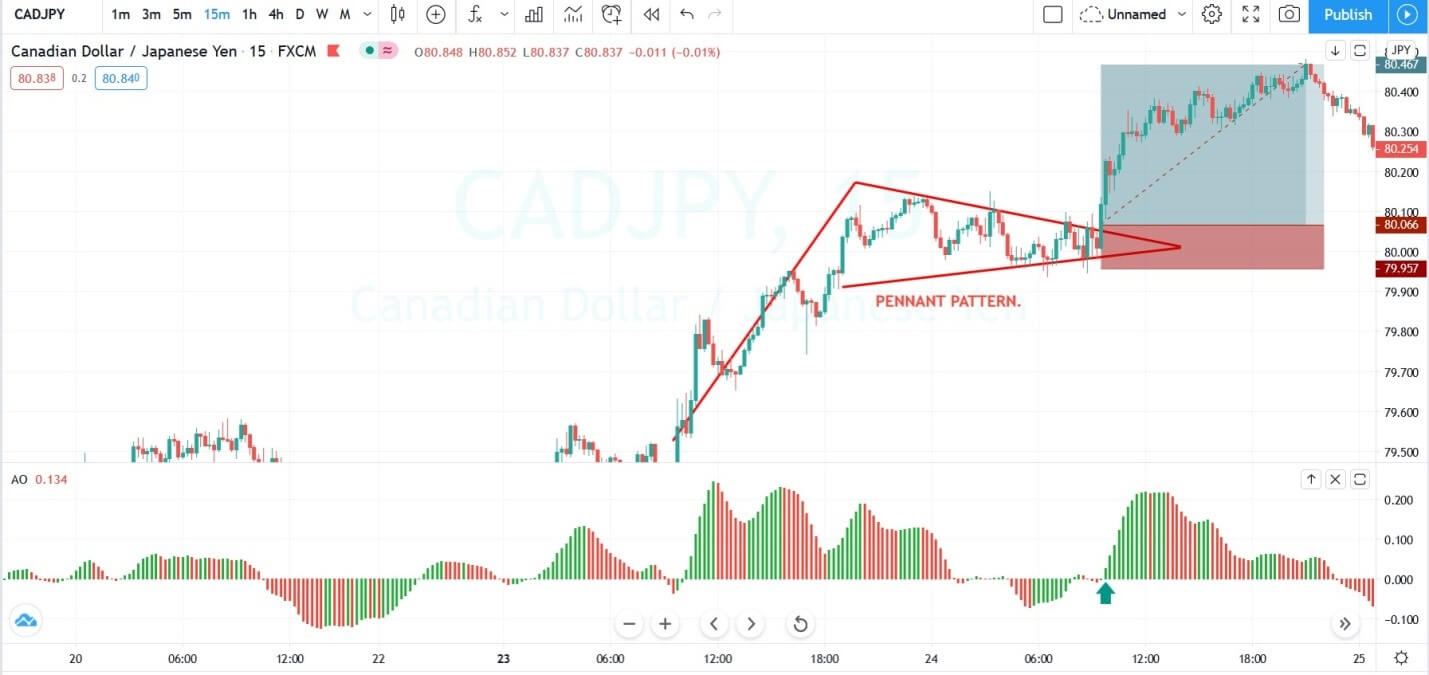
The image below represents the pennant pattern on the CADJPY 15 minute chart. This timeframe is also used by traders for intraday trading, in an ongoing uptrend the formation of Pennant and reversal of histogram lines above the zero line was an indication to go long.
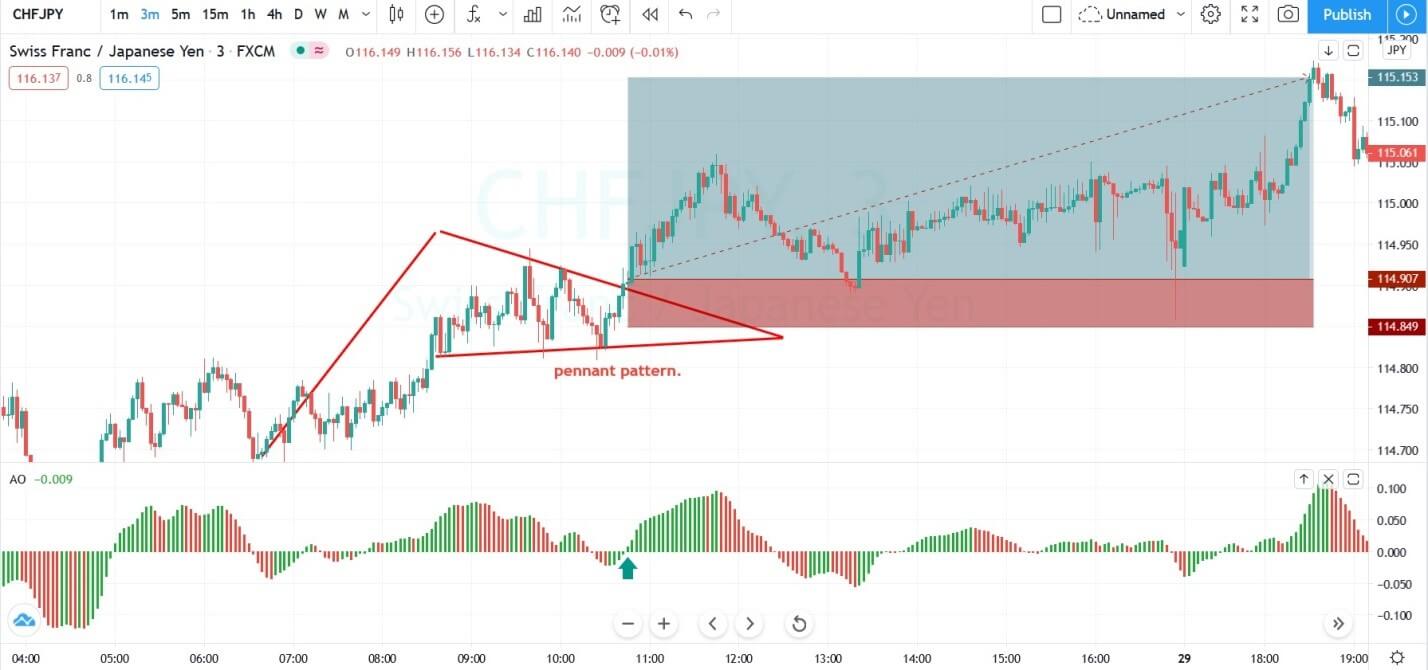
Mostly scalpers book the profits with the small price movements, but if they can use the proper trading strategies for scalping, then they can hold their trades for the longer targets. In the image below on a three-minute chart, the prices were in an uptrend, and during the pullback phase we witnessed the pennant formation, and the reversal on the Awesome oscillator confirmed that the breakout is real. Here we book the profits of around the 30 pips in this pair, by just taking the proper trades on the three-minute chart. Sometimes scalpers have no trades in the market, so in these conditions, it is always advisable to follow the proper trading strategies to milk the market.
ENTERING IN A TRADE PRIOR TO THE FORMATION OF THE PENNANT PATTERN
The image below represents the pennant pattern on the sixty-minute chart.
Here in this strategy, we are using the lower line of the pennant pattern to time the market. The lower pennant line is an ascending line, so when the price action touches that line, it never came back to the same price again. In this way, if we bought at every touch of the lower pennant line, we can easily ilk the bigger profits.
In the image below, we mark the pattern on the sixty-minute chart and choose to take the entry on the 15-minute chart. The pair was in an uptrend, and when the price approaches the lower pennant line, at that stage of the market the awesome indicator lines were also declining which is a sign of sellers are no more interested in selling, and going long will be a good idea. Keep in mind in the first trade always risk less money; this is because the sellers are still the dominating force. When the prices failed to break below the pennant line, it means buyers are there, and going big on the second trade will be beneficial. When the second time prices approached the pennant line, the awesome oscillator showing no sign of any sellers even buyers were stepping in, this was the sign for us to go long in this currency. After our entry, we choose to go for a brand new high with the stops just below the first entry.

The image below represents the pennant pattern in the EURNZD forex pair.

The image below represents the buying trade in the EURNZD pair on the daily chart. As you can the currency was in an uptrend and during the pennant formation prices dropped below the lower pennant line with the declining histogram bars. The next green candle immediately came back, which means it was a faker, and there were buyers who exists in the game. We took the entry after the fakeout and were waiting for the prices to go higher once again to take another buying trade, but the price action holds at the lower line which means the buyers were building the order. This consolidation phase at the support level and the green histogram bars on the indicator motivated us to take another long trade. The very next day price action takes off, and we witnessed the brand new higher high.

CONCLUSION
Trading the markets in today’s world is an easy game for those who properly follow the rules and master the well-proven trading strategy. The Pennant is a leading trading tool that appears on all the trading timeframe, you can use the pattern alone but if you desired good risk-to-reward ratio trades then pairing this pattern with another indicator is always beneficial. Keep in mind, the Pennant is a continuation pattern, and it only appears in an uptrend, don’t try to trade the pattern everywhere in this way you will be not able to scale your trades, Instead trade the pattern only in the trending market and when the formation appears to scale your trades every time.