Categories
Forex Basic Strategies

Pairing Stochastic With The ‘Double Bottom’ Forex Chart Pattern

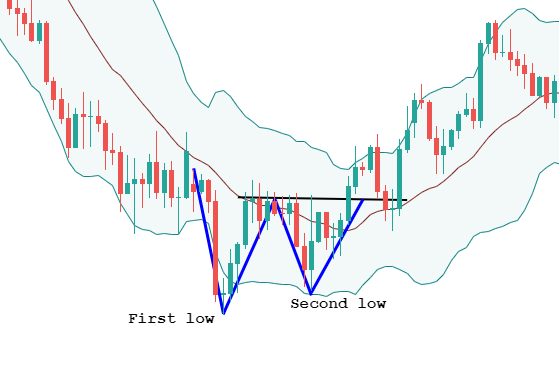
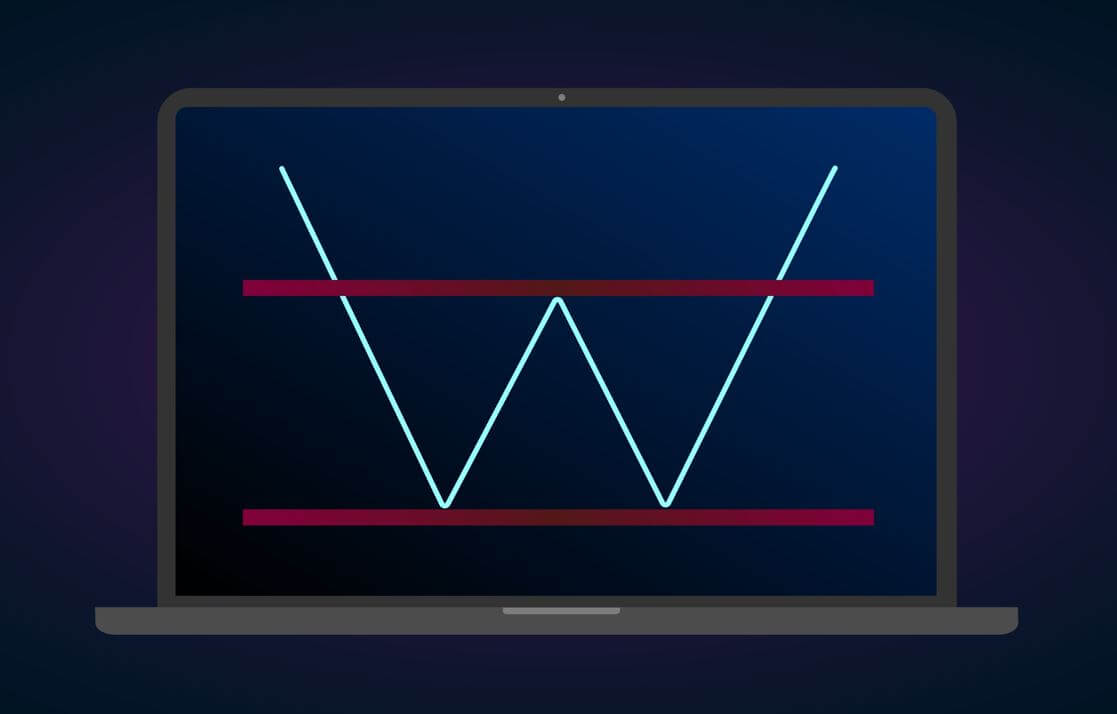
The double Bottom is a technical chart pattern, which helps to identify the change in the direction of the selling trend. The pattern looks like W in shape and it is quite a popular pattern among technical traders. In other words, double Bottom is a bullish reversal pattern. Most of the time double bottom reversals usually mark the long-term trend change in an instrument. In an ongoing downtrend, the price action drops to a floor, a significant support level before beginning the new uptrend. The pattern forms by two consecutive rounding bottoms with approx. Same heights. Most of the time, the momentum of the second Bottom is quite weak, which indicates that the weak selling momentum. Both of the round bottoms retrace until it finds the major resistance area that we call the Neckline. Overall, the pattern indicates that the professional traders, market movers booking the profits, and now the market are ready to print brand new higher high.

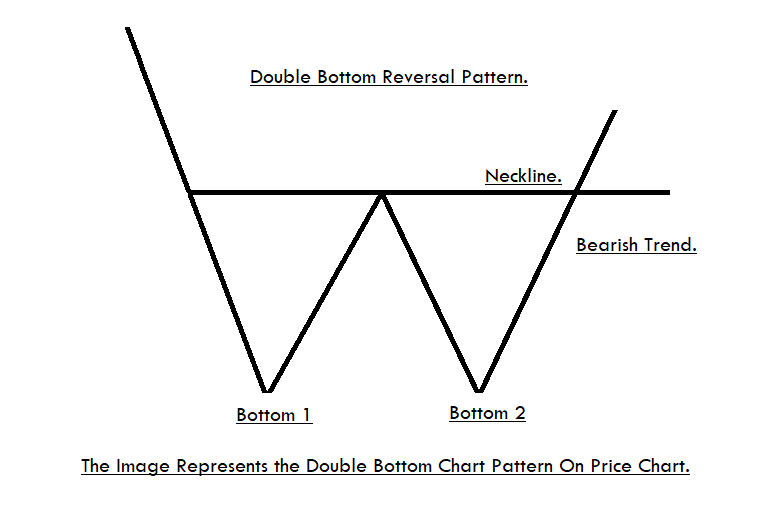
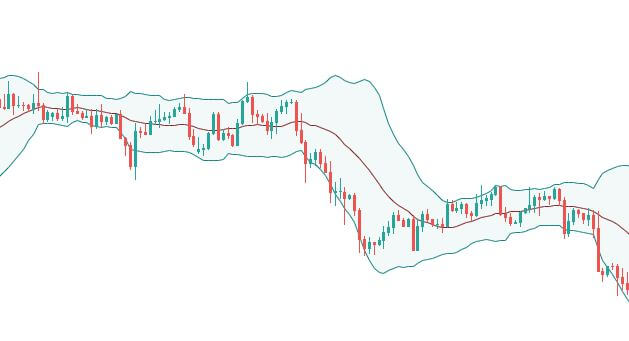
The image above represents the Double Bottom Chart Pattern on Price Chart.

Psychology Behind This Pattern

As by now you know that the double Bottom pattern occurs at the major support area, the pattern suggests that when the price action reaches the major support area, it means that the sellers are now afraid of the major support zone so they are booking their profits and as a result, the momentum of the market keeps dying. When price action prints the first Bottom, it indicates that some buyers try to buy; as a result, price action approaches the Neckline, and now at the Neckline, some sellers again try to hit the sell in order to print a brand new lower low. When price action reaches the major support area again, they failed to print a new lower low, and as a result, they booked the profit. Now the markets are entirely under the control of the buyers, and they are ready to print the brand new higher high.

Trading Strategies Using Double Bottom Pattern

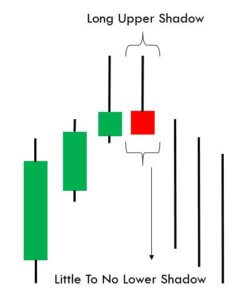
Double Bottom Pattern + Bullish Candlestick Patterns

There are several bullish candlestick patterns that are widely used by technical traders in the market. You can use any bullish candlestick pattern to trade the market, some of the popular bullish candlestick patterns are Bullish Engulfing, Morning star, Gravestone Doji, Dragonfly Doji, Three white soldiers. These are widely used, and the most common candlestick patterns exist in the market.

The idea is to find out any bullish candlestick pattern at the second Bottom, when you find out any bullish pattern at the bottom area go long, put the stop loss below the support line, and the first take profit must be at the Neckline, second one should be double than the size of the pattern.

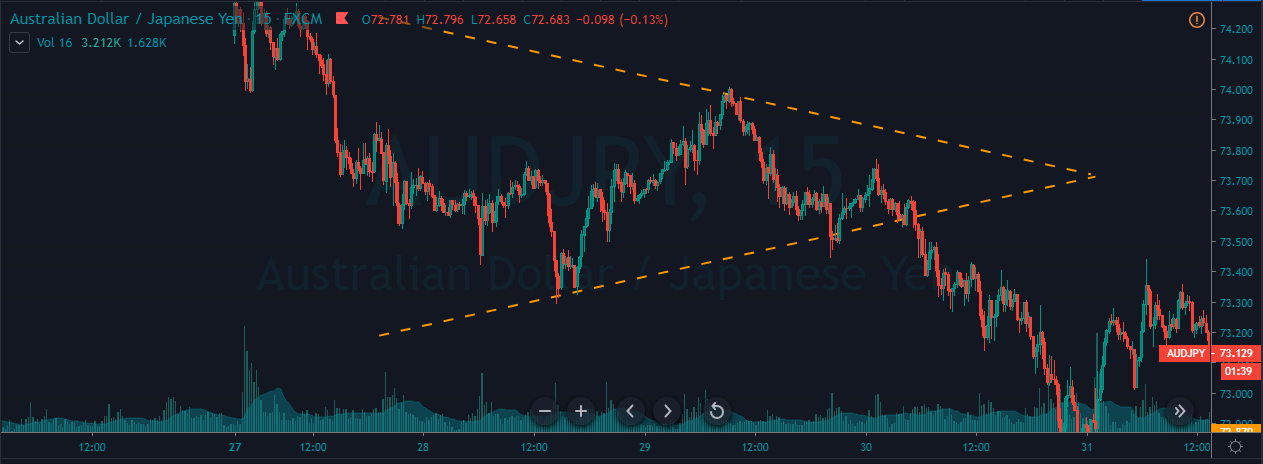
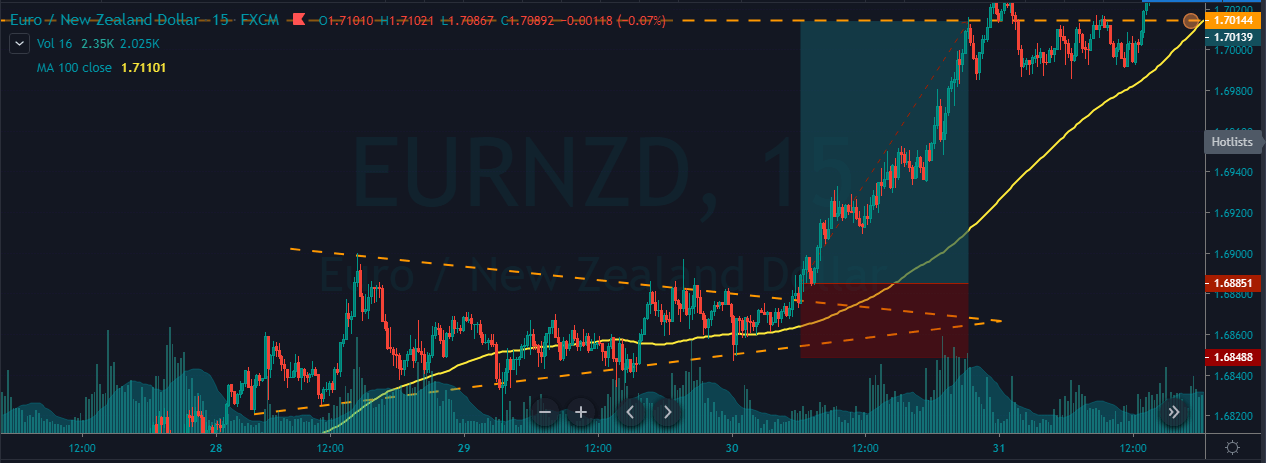
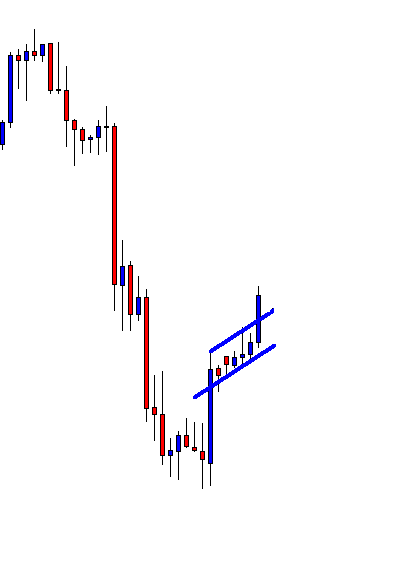
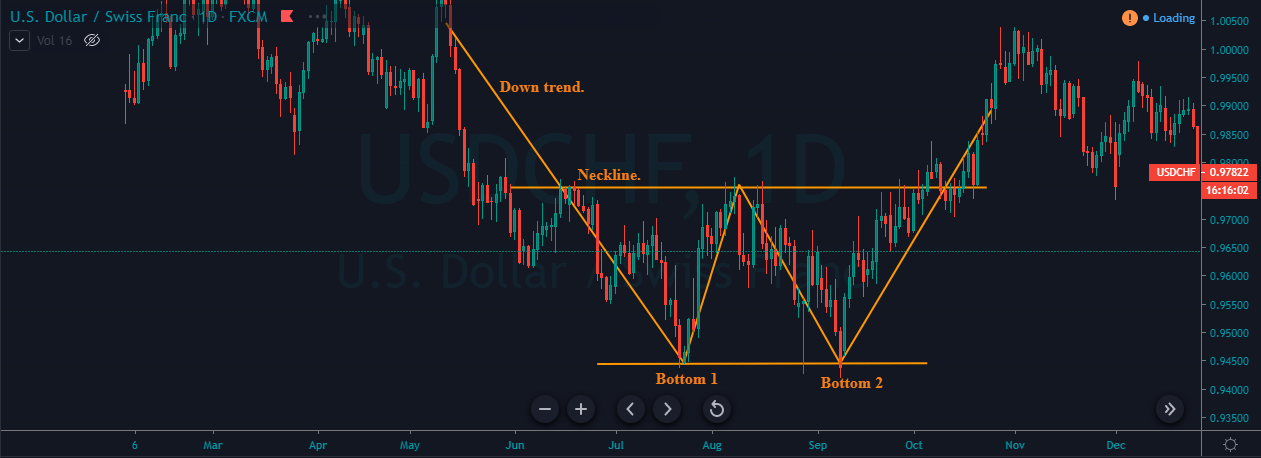
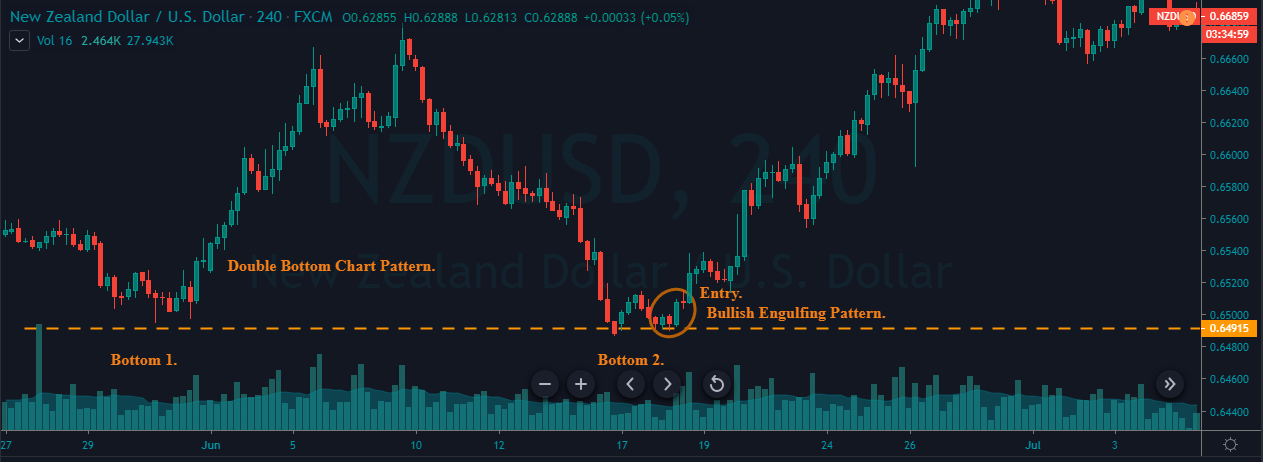
The below Image represents the double bottom pattern on the NZDUSD Forex pair.

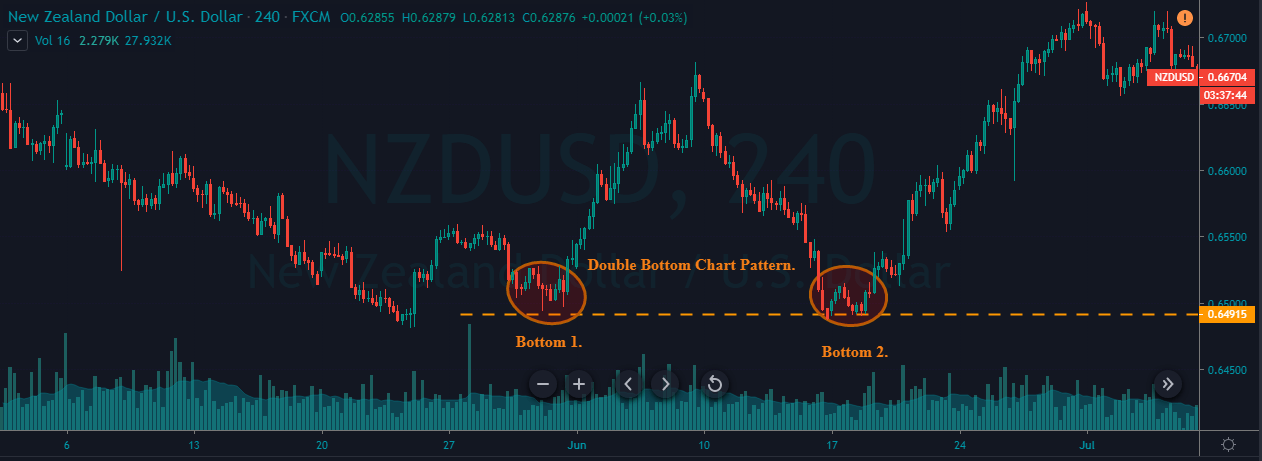
As you can see in the below Image, the market prints the Double Bottom chart pattern, which indicates that the buying trade in this pair. Initially, when the price action approached the support area, at that time, the momentum of the downtrend was really weak, but after the first retracement to the Neckline, the sellers try hard to print brand new lower, but they failed to do it. When price action hits the Bottom second time, the market prints the bullish engulfing pattern, which indicates the buying trade in this pair.

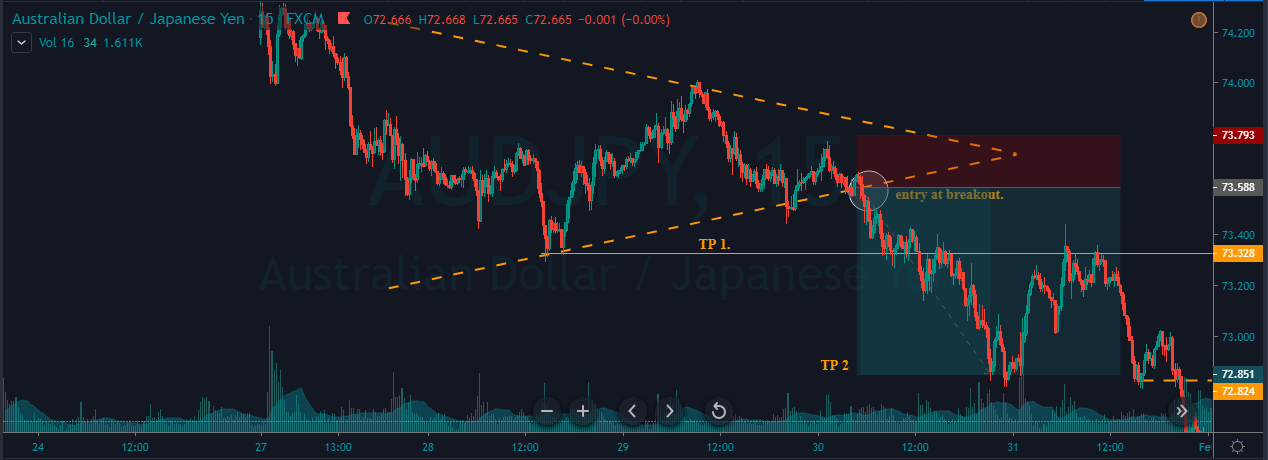
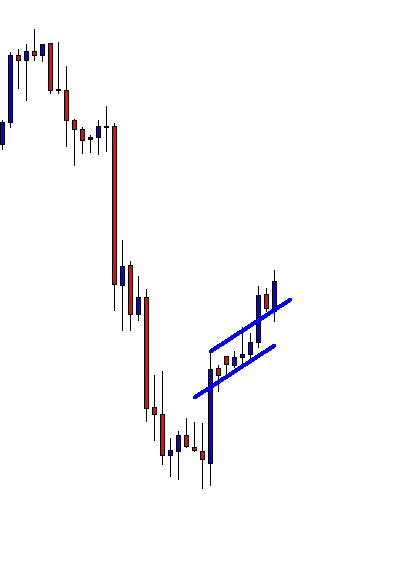
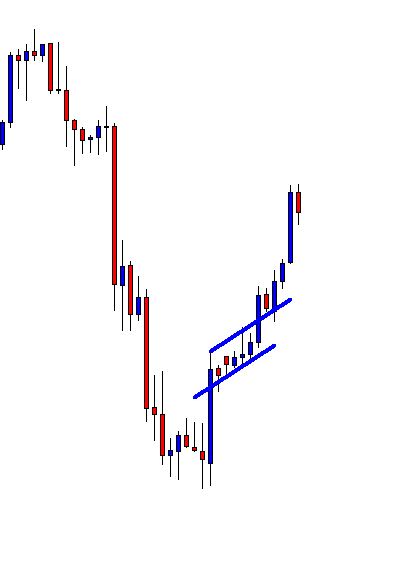
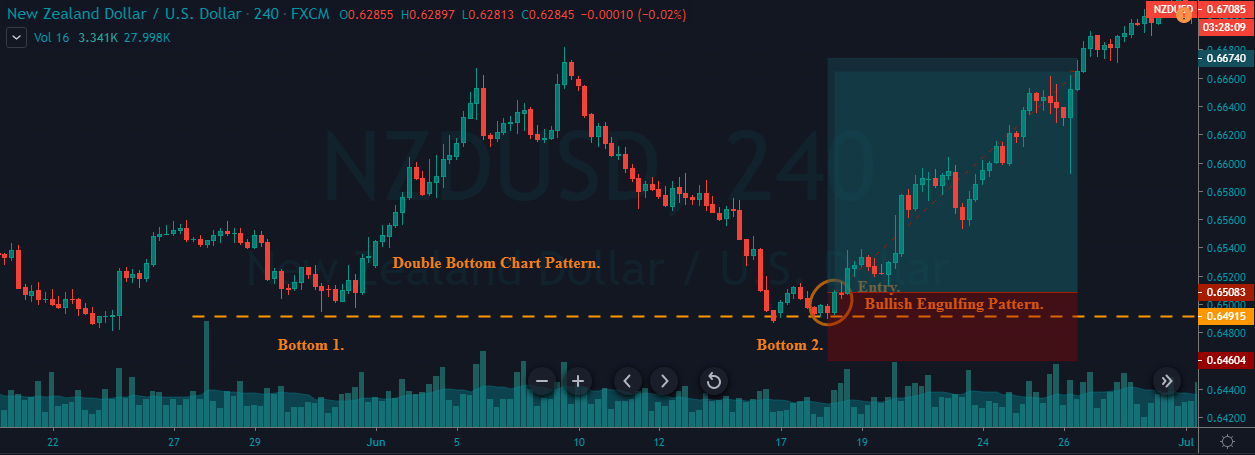
The below Image represents our entry and exits in this forex pair. We took long when the market prints the bullish engulfing pattern, and the take profit was below the second Bottom, the major support line below acts as dynamic support to the price action. You can even go with a smaller stop loss because the line below is so strong that it stops the strong selling trend and even reverse it completely. So you can imagine how strong this line is. The take profit was at the Neckline, you can close your position at the Neckline, or you can hold it for the further target. It is advisable to book half of the profit at the Neckline.

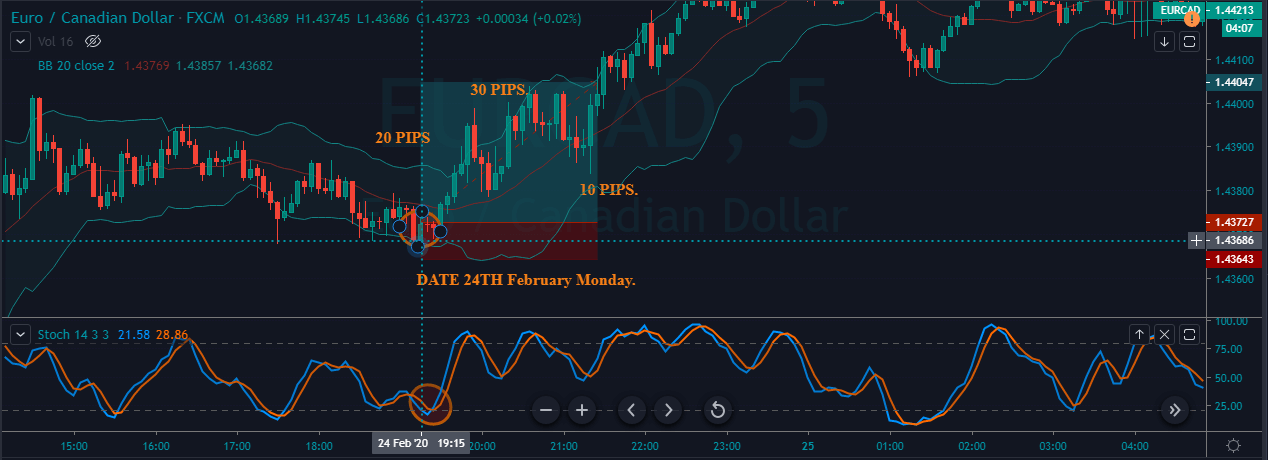
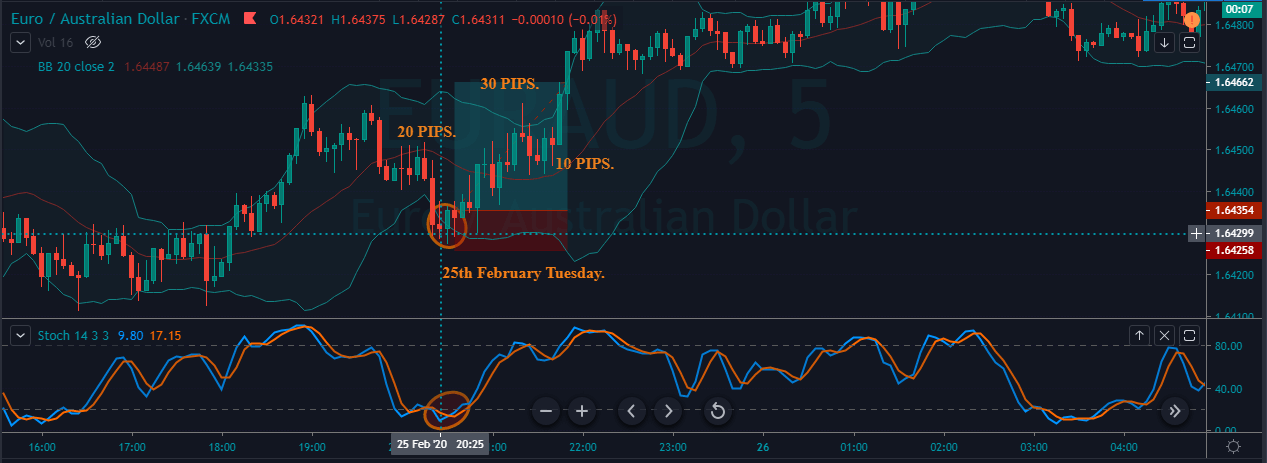
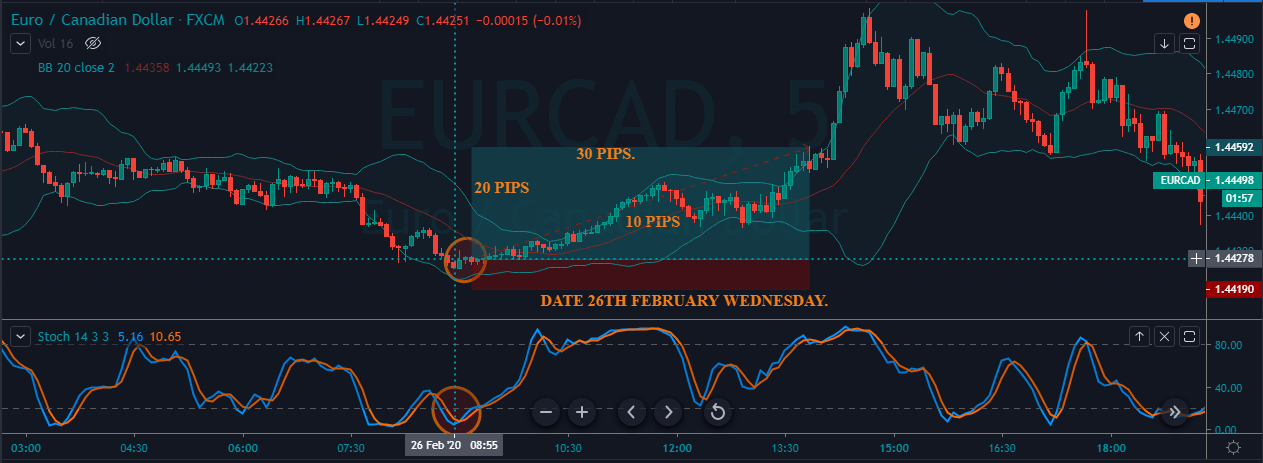
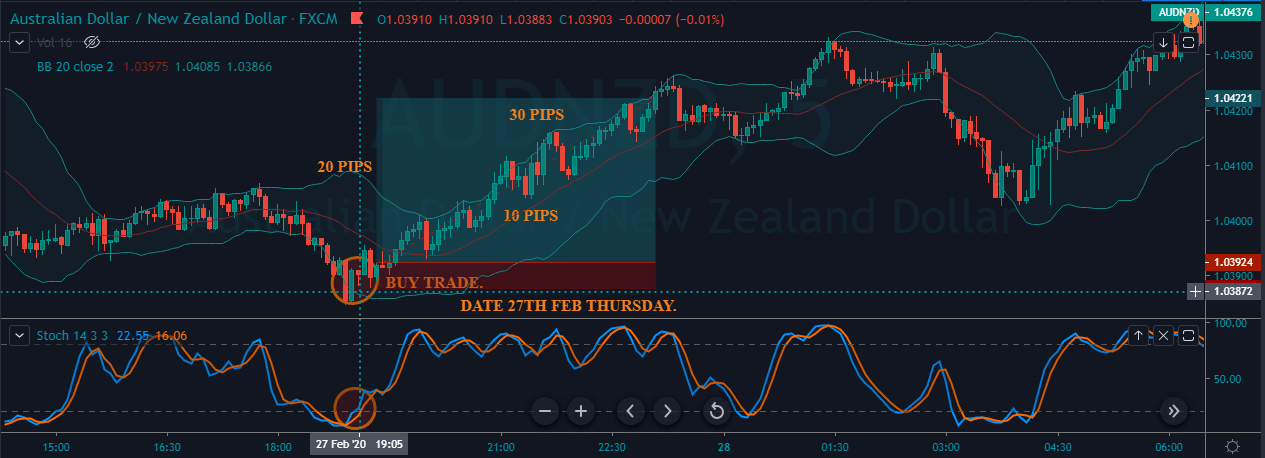
Double Bottom Chart Pattern + Stochastic Indicator

In this strategy, we paired the Double Bottom pattern with the stochastic indicator to identify the trading signals. Stochastic is a quite popular oscillator that is developed by George C. Lane in the 1950s. Most of the traders think that just like other indicators, stochastic also follow the price and volume, but it is not true. In fact, stochastic follows the momentum and speed of price action. The stochastic indicator is used to identify the oversold and overbought buying conditions, and traders use overbought/oversold conditions to trade the market. The indicator also identifies the divergence, which helps the traders to identify the major market reversals.

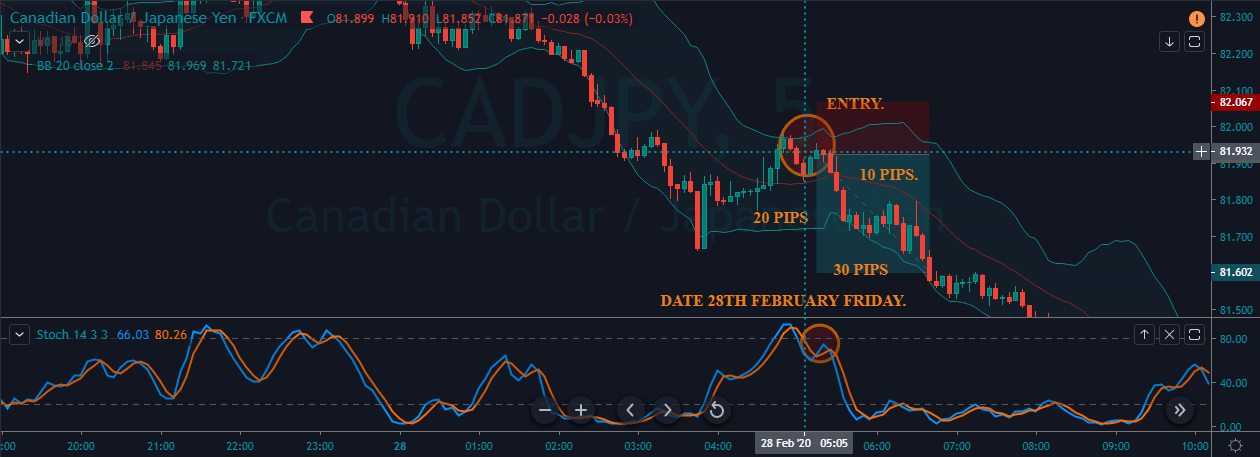
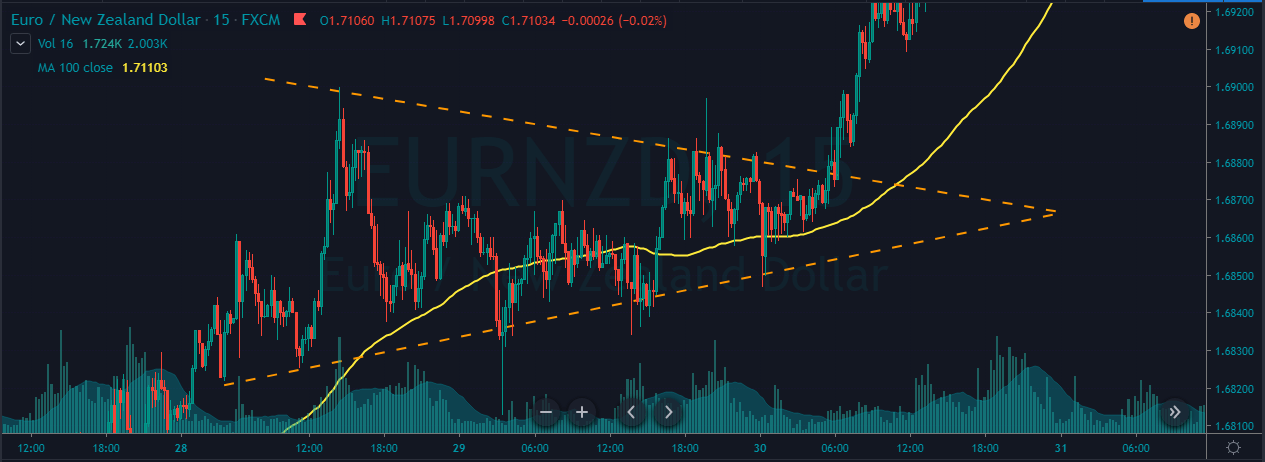
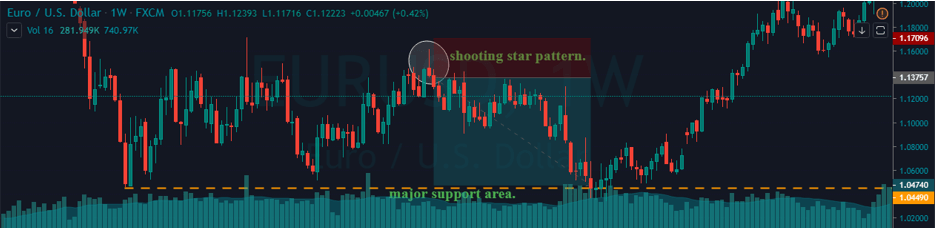
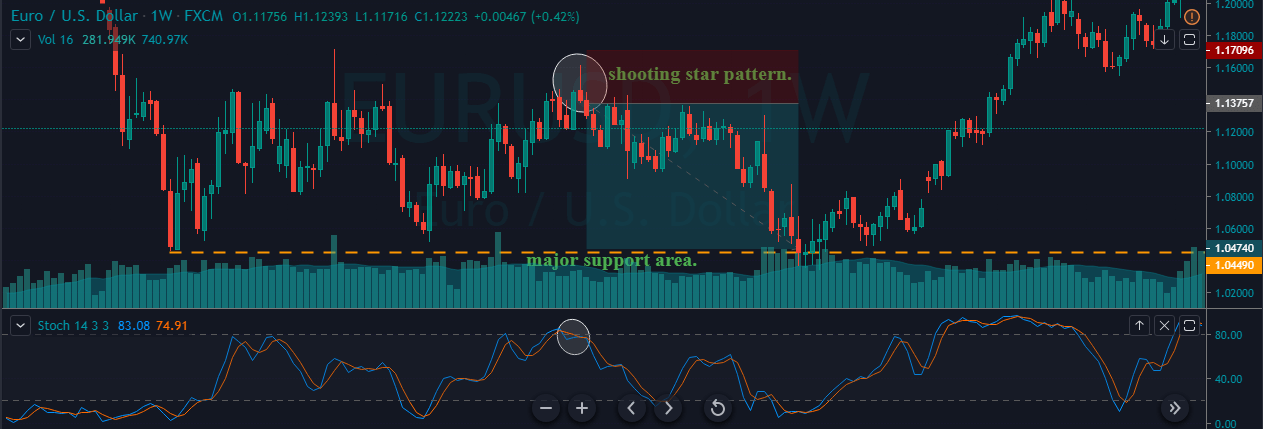
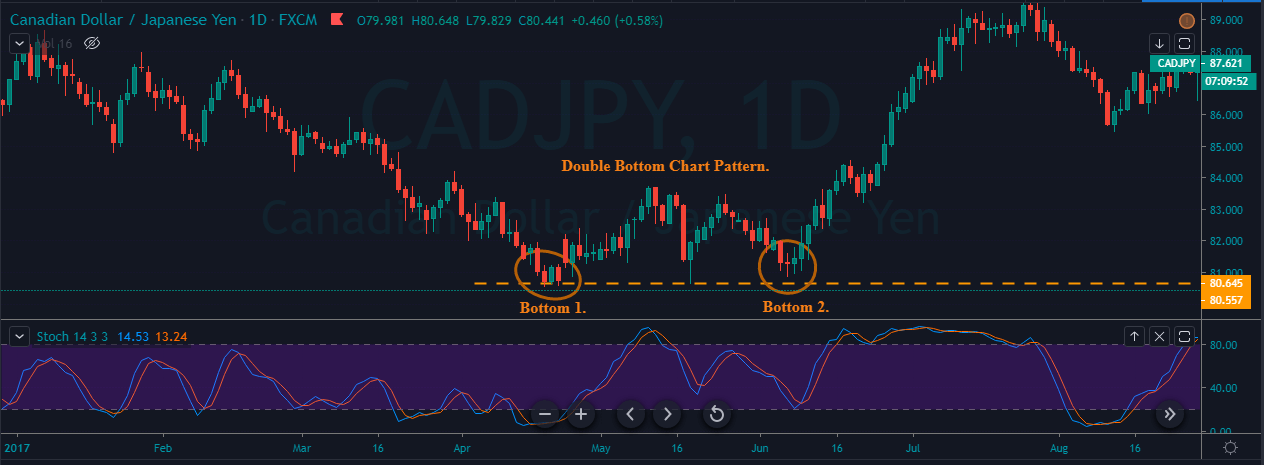
The below Image represents the Double Bottom chart pattern on the Daily chart of the CADJPY forex pair.

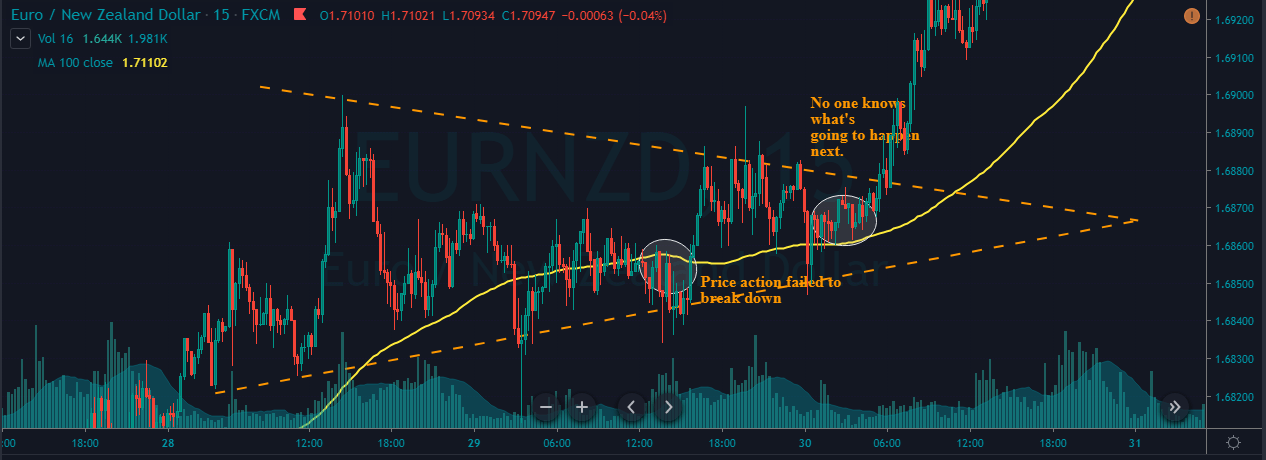
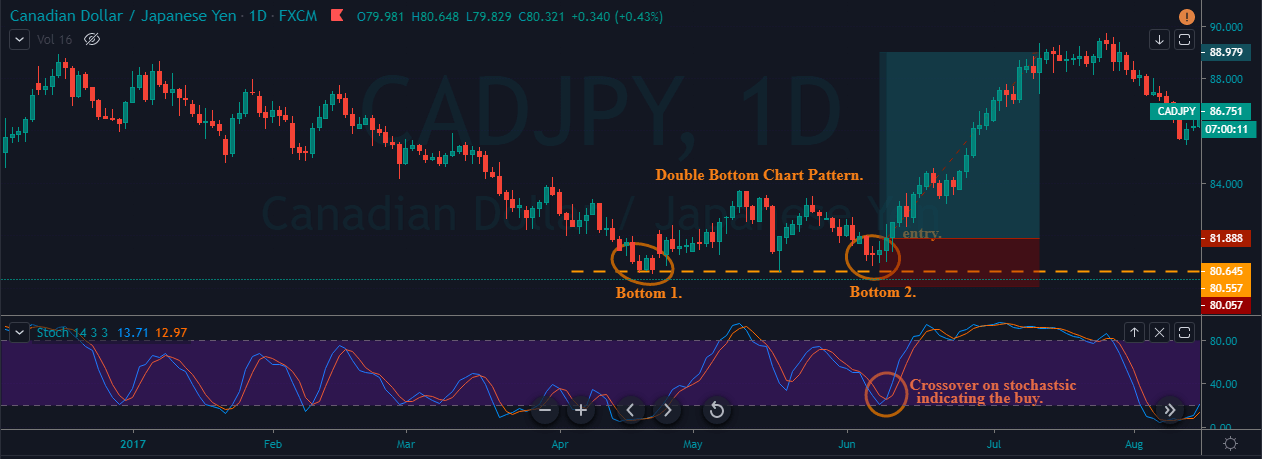
The below Image represents our entry in this pair by using the stochastic indicator and double Bottom chart pattern.  As you can see that we took a long position when prices failed to go below the major support line. Most of the traders what they do is activate the buy trades when the price action hits the support line the second time. This is the wrong approach. Instead, let the price action holds and then activate your trade. As you can see, when prices hit the second Bottom at that time, crossover happened on the stochastic indicator, which indicates that the market is oversold and it is time to go long.

The below Image represents our entry and exits in this pair. We took long when the price action hits the second Bottom, also when the crossover happened on the stochastic indicator. Stop below the recent low, and the take profit was at the higher timeframe major resistance area.

Conclusion

The double Bottom is an extremely powerful chart pattern when it is interpreted correctly. If you interpret it incorrectly then it can damage your trading account. You can activate your trades when price action hits the second Bottom, or you can activate trades when price action crosses the Neckline and retests as support. It doesn’t matter where you activate your trade; both of the locations provide a good risk to reward ratio.

Categories
Forex Basic Strategies

Making Consistent Profits with ’10 Pips A Day’ Forex Strategy

Introduction

There is a lot of buzz in the Forex industry about the ten-pip a day strategy. We have seen both experienced and novice traders getting excited about this strategy. So we decided to talk in detail about this topic in today’s article. Some expert traders believe that it’s not possible to make ten-pip consistently in the market, while many others say it is possible.

In reality, it entirely depends on the person’s trading skills, mindset, and experience. Traders need to adapt themselves to the market situations to be successful. Making ten-pip a day is a great way to accumulate wealth in the Forex market, and it is easily possible. All we need is to master our skills to the point where we exactly know when to take a trade and when not to.

Statistics say that it’s not easy to make consistent money in the Forex market, and the losses are a part of the game. This is true to an extent, but if we practice this strategy enough on a simulator, we can easily make ten pips a day no matter what. In this article, let’s understand how to make ten pips per day in the Forex market by using five different buy and sell examples of five trading days in a week.

Trading Strategy For Making 10 Pips A Day

’10 Pips A Day’ – The idea behind this term is to stop trading for the day right after making ten pips that day. Also, it is up to you to follow this idea or not. You can stop trading after making ten pips, or you can ignore that and go for 20, 30, or even 100 pips a day according to the market situation.

But only go ahead if you are 100% confident about the markets. In case of any tiny bit of uncertainty, make sure to exit right after you make ten pips. One critical aspect of this strategy is selecting the currency pairs. One must be professional enough to understand the market situations and pick the pairs where there is a minimum potential of making ten pip profits.

Pairing The Bollinger Bands With The Stochastic Indicator

Rules For Going Long
  1. The market must be in a strong uptrend.
  2. Wait for the price action to slowdown at the lower Bollinger Band.
  3. Let the Stochastic Indicator reverse at the oversold area.
  4. Only go long if the above two rules are satisfied. Also, consider the momentum of the price.
  5. Place the stop-loss just below the lower Bollinger Bands.

Now, to understand how this works, we have taken five different trades for five trading days in the last week of Feb 2020 and have generated 10, 20, and 30 pips in the market successfully. According to this strategy, conservative traders must stop trading after making ten pips for that trading day. But, if you are an aggressive trader, go ahead for bigger targets. Let’s get into the examples.

Monday Trade

The below chart represents a buy trade in EUR/CAD Forex pair. When all the rules mentioned above are met, we took a long position in the New York Session on 24th Feb 2020. Our stop-loss is placed right below the lower Bollinger Band.

We have gone for three different targets according to the market situations and predominant S&R levels. As mentioned, exit the trade as soon as you make ten pips if you are a conservative trader.

Tuesday Trade

For the second day, we have picked the EUR/AUD Forex pair as we identified some potential market moves. We have gone long on this pair in the New York session on 25TH Feb 2020. We can clearly see both the indicators indicating a clear buy signal.

Here, we have gone for the third target and exited the trade as soon as we made 30 pips.

Wednesday Trade

Our third trade was in the EUR/CAD Forex currency pair in the Asian session on 26th Feb 2020. When prices hit the lower Bollinger bands, and the Stochastic indicated the oversold market conditions, we went long on this currency pair.

We would have exited the trade at ten pips, but the market started printing continuous bullish candles, which made us wait for the prices to hit the third target.

Thursday Trade

On the 4th day (27th Feb 2020), we took a long position in the AUD/NZD Forex pair. The entry was at the point where the prices touched the lower Bollinger Band, and the stop-loss is placed just below the recent low.

Since the higher highs were getting continuously printed, we went for the third target and exited the trade as soon as we made 30 pips.

Friday Trade

For the Friday trade, we chose the AUD/NZD Forex pair. We went long in the Asian session on 28th Feb 2020. When both the indicators lined up in one direction, it is a clear indication that the sellers have given up, and now it’s time for buyers to lead the market.

We had exited at the third target even when the market was moving up north.

 Rules For Going Short
  1. The market must be in a strong downtrend.
  2. Wait for the price action to slowdown at the upper Bollinger Band.
  3. Let the Stochastic Indicator reverse at the overbought area.
  4. Only go short if the above two rules are satisfied. Also, consider the momentum of the price.
  5. Place the stop-loss just above the upper Bollinger Band.

Monday Trade

The below chart represents the first sell trade we took in the NZD/JPY Forex pair on the 24th Feb 2020. We went short when the price action hit the upper Bollinger band, and the Stochastic indicated the overbought conditions.

The stop-loss is placed just above the upper Bollinger Band. We have gone for the third target, and the market printed a brand new lower low.

Tuesday Trade

The below image represents the USD/CHF Forex pair. This pair was in an overall downtrend, and on 25th Feb 2020, we have activated the sell trade right after our sell criteria is met.

We can see the market reaching all of our targets in just a couple of hours.

Wednesday Trade

For the third day, we have chosen the USD/CHF Forex pair to identify the sell opportunities on 26th Feb 2020. The entry was at the point where the price action touched the upper Bollinger band, and the stop-loss was just above the upper band.

The reason we place the stop-loss there is because of the bands of the indicator act as a dynamic support resistance level to the price action.

Thursday Trade

The 4th trade belongs to the CAD/JPY Forex pair, and we have activated our sell trades on 27th Feb 2020. We took sell when both of the indicators lined up in one direction, and we booked profit at the third target.

Friday Trade

For the last sell trade, we chose CAD/JPY currency pair. Sell trade was activated on Friday, 28th Feb, in the Asian session. When the Stochastic reached the overbought area and gave a sharp reversal, we saw the price action hitting the upper Bollinger band. This essentially means that the market is ready to go down.

Bottom Line

In almost all of the cases, we have gone for the third target only and make 30 pips profits. The reason behind this is to show you how reliable is the Bollinger Band and Stochastic combination. We are saying this time, and again, please stop trading after making ten pips per day if you are a conservative novice trader. But if you are experienced enough to predict the market, milk as much as you can depending on the market conditions. All the best.

Categories
Forex Basic Strategies

Trading The ‘Symmetrical Triangle’ Chart Pattern Using SMA

Introduction

A Symmetrical Triangle is one of the most reliable chart patterns in the market. This pattern is characterized by converging two trend lines, which are drawn by connecting a series of peaks and troughs. The Symmetrical Triangle pattern is made up of price fluctuations where each swings high and swing low makes lower highs and higher lows. Essentially, the coiling movement of price action creates the structure of a Symmetrical Triangle. When the triangle is forming on the price chart, it indicates that neither the sellers nor the buyers are pushing the price far enough to create a clear uptrend or downtrend.

This pattern is also known as the ‘coil’ because, most of the time, it forms in a continuation phase. Symmetrical Triangle pattern consists of at least two lower highs and two lower lows. So when these points are connected, the lines converge, and the Symmetrical Triangle takes shape. A part of the trading community believes that if this pattern is formed in an uptrend, the price will break upward. Likewise, if the pattern forms in a downtrend, the price action will break downward. However, these are just assumptions and are not entirely true.

The reason for the formation of the Symmetrical Triangle on the price chart is because of the lack of volume and price movement in any underlying currency pair. This eventually results in the formation of a coiling pattern. Hence it is merely impossible to find out which side of the pattern will breakout.  The only way to trade this pattern is to let the breakout happen on any of the sides and take the trade only after confirmations.

Symmetrical Triangle Chart Pattern – Trading Strategies

Conventional Way – Buy Example

Step 1 - Identifying The Pattern

We can see the formation of a Symmetrical Triangle pattern in the below GBP/NZD Forex pair. We can observe the market coiling and not moving in any certain direction, which eventually resulted in this pattern.

Step 2 - Entry, Stop-Loss & Take-Profit

In the below chart, we had taken the entry when the price action broke the upper trend line. This pattern is pretty reliable but needs a lot of patience as the only way to trade is by stalking the charts. We can notice the market blasting to the north immediately after the breakout of the upper trend line. The stop-loss is placed just below the lower trend line, and the take-profit is placed at the higher timeframe’s resistance area.

Conventional Way – Sell Example

Step 1 - Identifying The Pattern

The formation of the Symmetrical Triangle pattern can be seen in the below AUD/JPY Forex pair. The market was in an overall downtrend, but from 28th – 30th January, it turned into a consolidation phase, which resulted in the formation of this pattern.

Step 2 - Entry, Stop-Loss & Take-Profit

However, on 30th Jan, the lower trend line was broken, indicating a sell signal in the AUD/JPY Forex pair. The entry can be right after the breakage of the lower trend line if you are an aggressive trader. But for conservative traders, it is recommended to watch for the bearish confirmation candles and then take the trade.

Here, we have gone for two targets. The first one was at the recent low, and the second target was a bit deeper, which is at the higher timeframe’s support area. If you are an intraday trader, then the TP1 is a good location for you to close your position. But if you are a swing trader, TP2 is the best match. Most of the time, the breakout trades do perform, and that is the reason for us to use the recent higher low as an appropriate stop-loss placement.

Symmetrical triangle + Simple Moving Average

In this strategy, we have paired the Symmetrical Triangle pattern with Simple Moving Average to identify accurate trading signals. SMA is a technical indicator used by almost every technical trader to identify the market trend. A smaller period average reacts more to the price action, whereas the larger period tends to respond less. If the SMA is below the price action, it means that the trend is up, and if it is above the price action, it indicates a bearish trend.

Step 1 - Identifying The Pattern & Plotting SMA On To The Price Chart

We can observe the formation of a Symmetrical triangle pattern on the EUR/NZD Forex chart.

Step 2 - Knowing What Not To Do

One of the most common ways of trading the Symmetrical Triangle and SMA is to let the price action go above or below the MA line to take an entry. But that approach is riskier, and let’s see why. In the below image, we have marked two circles where the MA generates both buy & sell signal. It is clear that the selling signal failed to perform, and the price action goes above the SMA. When the price broke the SMA, some traders might have taken buy entries, but that’s an immature way to trade this pattern. The reason for the formation of the Symmetrical Triangle is due to the lack of volume or price movement. So there is no way to know which side of this pattern will break.

Step 3 - Entry, Stop-Loss & Take-Profit

The correct way to trade the Symmetrical Triangle pattern is to use both of the trading tools in conjunction with each other. When the SMA goes below the price action, it confirms that the prices are more likely to break upside. When strong buyers break the Symmetrical Triangle with strong power, it’s a clear indication for us to go long. So we have entered the market right after the price broke above the upper trend line of the pattern.

If you are a confirmation trader, we recommend you wait for the price action to hold above the Symmetrical Triangle to take a ‘buy’ entry. For this particular strategy, we placed the stop-loss below the SMA, and take-profit was at the higher timeframe’s resistance area. After our entry, we can see the buyers blasting to the north, and we end up milking 100+ pips in this Forex pair.

Conclusion

The Symmetrical Triangle pattern is widely used among traders. The difficult part of trading this pattern is predicting the direction of the breakout. All we can do is to watch the charts until the breakout happens and anticipate the trade. The traditional way to book the profit is at the beginning of the triangle itself. However, we can use some other approaches such as higher timeframe’s S&R areas, supply-demand zones, or exiting the position when the market turns into a consolidation phase.

We hope you had a good read. Let us know if you have any questions in the comments below, and we would love to answer them. Happy Trading.

Categories
Forex Basic Strategies

Pairing The Shooting Star With Stochastic & Awesome Oscillators

Introduction

The Shooting Star is one of the most popular bearish candlestick patterns in the industry. This pattern appears in an uptrend most of the time, and it indicates bearish reversals in the price action of any underlying currency. So basically, when this pattern appears on the charts, it implies that the buyers are exhausted, and its sellers turn to lead the market. Once we have identified the Shooting Star pattern in an uptrend and confirm the trend reversal with any other credible indicator, we should look to open a short position.

This pattern has a unique structure as it consists of a small body and a high upper wick, as shown in the image below. This image accurately represents the trend reversal because we can clearly see the buyers losing momentum and sellers taking over the market.

Trading strategies with the Shooting Star pattern

Shooting Star + Stochastic Indicator

In this strategy, we have paired the Shooting Star pattern with the Stochastic Indicator to identify the trading opportunities. Just like RSI and MACD, the Stochastic Indicator also belongs to the oscillator group. It is developed in the 1950s, and it is still widely used by the traders. The Stochastic indicator oscillates between 0 & 100 levels. When the indicator goes below 20, it means that the currency pair is oversold. Similarly, when the indicator goes above the 100 level, it indicates that the currency pair is overbought.

STEP 1 – First of all, find the Shooting Star pattern in an uptrend.

STEP 2 – Check the Stochastic indicator

Once you find the Shooting Star pattern, the next step is to check the Stochastic Indicator. If the indicator is giving a reversal at the oversold area, it indicates the overbought market conditions.

The image below represents the EUR/USD weekly Forex chart. In this pair, price action was held at a significant resistance area, and it prints the Shooting Star pattern. Also, the Stochastic indicates the overbought conditions. These three clues clearly say that this pair is all set to change its direction. The Stochastic pattern on a higher timeframe has very higher chances to perform. So whenever you find this pattern, and if it supports the rules of this strategy, always trade big.

Step 3 – Stop-loss and Take Profit

A stop loss is specially designed to limit the loss of the trader. So before activating your trade, it is essential to decide where you are going to place the stop loss. In the example above, we put the stop loss just above the Shooting Star candle.

Shooting Star pattern indicates the reversal in price action. This means that we are catching the top of the trend. As the end goal of every trader is to maximize their profits and minimize losses, always try to hold the positions for more extended targets.

In the example, we have closed our position at a higher timeframe support area. We can use the higher timeframe support or look for the Stochastic Indicator to reach the oversold area. Another way to close the position is when the market reaches the major support area while the Stochastic is in the oversold area.

As we can see in the image below, we closed our full position at a significant support area. You can use the Stochastic or any other trading tool to exit your position, but we always suggest to use the considerable support/resistance area to book profits.

Shooting Star Pattern + Awesome Oscillator

In this strategy, we have paired the Shooting Star pattern with the Awesome Oscillator to identify the trading opportunities. The Awesome Oscillator is a boundless indicator. When the Awesome Oscillator reverses below the zero-level, it indicates the buying pressure. When it reverses above the zero-level, it means sellers are ready to lead the market. Furthermore, some traders use this indicator to confirm the strength of the trend. When the indicator goes above zero-level, it means the buying trend is quite strong, and when it goes below the zero-level, it shows the sellers dominating the market.

Step 1 – First of all, find the Shooting Star pattern in an uptrend.

Step 2 – Look for the Awesome oscillator reversal

Once we find the Shooting Star pattern, the next step is to take a sell-entry when the Awesome Oscillator reverses at overbought market conditions.

The image below is the EURUSD 240 chart. On this pair, at first, the buyers were quite weak, and they started holding at the resistance area. Furthermore, in that small range, price action turned sideways, and it printed the Shooting Star pattern. The Awesome Oscillator even reversed at the overbought conditions. Both of the trading tools are indicating the exhaustion of the buyers. And sellers are ready to take over the market.

Step 3 – Take Profit and Stop loss

Every trader has different expectations from the market, some like to trade short term trends, and some like to trade longer-term moves. If you are an intraday trader, then we suggest you close your position when the Awesome Oscillator reverses at the oversold area. But, if you are a swing trader or investor, wait for the opposite pattern (Hammer Pattern) to appear to close all of your positions. We can even use the higher timeframe support/resistance area to close our positions.

We advise you to place the stop-loss order above the Shooting Star pattern. As you can see in the image below, we booked full profits at the major support area. After that, the price action dropped a bit more but reversed immediately to follow the buy direction. It is important not to ignore the higher timeframe support/resistance areas.

The psychology behind the Shooting Star Pattern

At first, we see the buyers enjoying the uptrend as the price of the currency keeps printing brand new higher high. As this euphoric moment begins to set in, the sellers start to sell their positions at higher prices. Now the buyers get panicked, and even they start to sell their positions. Now that the buyers and sellers are both selling their positions, panic is created in the market, which leads to a sharp reversal in price action. Thus a long wicked small body candle appears on the trading charts.

Keep in mind that the Shooting Star pattern is more reliable when it is formed after the three consecutive bullish candles. It creates strong bullish pressure on the price chart, and in such cases, the upper wick of Shooting Star is even longer. It indicates that the price is about to reverse with even more strength.

Bottom line

The Shooting Star is a single candle pattern, and it is the most popular trend reversal pattern in the industry. There is a strong psychological pattern that exists beyond the Shooting Star pattern. When the market is in an uptrend, and when buyers gain exponential strength, most of the traders book the profit, and as a result, the bullish trend loses its strength. This results in sellers sending the price down. Most of the time, the Shooting Star pattern provides the 3:1 risk-reward ratio trades.

We hope you find this article informative. Please let us know if you have any questions regarding the same in the comments below. Cheers!

Categories
Forex Basics Forex Daily Topic

The Simpler the Better

Financial traders follow many charts, patterns, and trading strategies. Each one has its own advantages and disadvantages. Nevertheless, there is a saying, ‘the simpler, the better.’ In the financial markets, especially in the Forex market, a trader cannot deny this truth.

Let us demonstrate an example of this.

The price heads down with strong bearish momentum. The sellers are to wait for an upside correction and a breakout at the support to make it more bearish. Let us proceed with what happens next.

The price has an upside correction, but it did not make a breakout at the support. It instead produces a huge bullish engulfing candle at Double Bottom support. Things are different now. Traders are to look for a long opportunity on the chart.

The price is bullish, but it gets caught within an ascending channel. A breakout at either side attracts traders to trade in this chart. The chart shows that the price makes an explicit breakout towards the upside. Ideally, the buyers shall flip over to their trigger chart to find a long entry. Let us find out whether they find any on the next candle.

The price does not make a breakout at the highest high of the breakout candle. Thus, the traders do not find an entry on the triggered chart. However, see the second candle (bullish candle). It makes a breakout (horizontally) at the highest high of those two candles. The buyers are to flip over the trigger chart again to find an entry. Do they see an entry this time? Let us find out.


Yes, they do. The price heads towards the North with good bullish momentum, and it does not come down to the support of the breakout candle. By flipping over to the trigger chart for an upside breakout to trigger an entry, a trader makes some green pips.

In this chart, the price makes a breakout at ascending channel’s resistance just a candle earlier. That breakout does not create bullish momentum. However, when it makes a breakout at the horizontal resistance, it creates the momentum that the buyers look for. I am not saying a breakout at ascending channel’s support/resistance does not offer entry at all. It does. A breakout at horizontal support/resistance offers more entries than the channel’s support/resistance breakout. It is because; it is simple and easy to be noticed by most of the traders.

The Bottom Line

Does that mean we stop looking entries on a channel or other pattern breakout? No, we shall eye on those breakouts; flip over to the trigger chart and trigger an entry if the trigger candle makes a new higher high or lower low. It is just the probability that a breakout at horizontal support/resistance offers more than any other chart pattern. After all, it is simple, and we know “the simpler, the better’.

Categories
Forex Psychology

Do Not Change Your Demonstrated Strategy Out of the Blue

Forex market is appealing to the traders. It operates 24/5, and it is the most liquidate financial market. It offers numerous trading opportunities to traders of all sorts. Since it has so much to offer, investors love investing in the market. However, these benefits often work against traders. Statistics suggest that 95% of traders lose their money in the Forex market.

A question may be raised here why most of the investors are unsuccessful in this market. There are quite a few to mention. However, today, I am going to talk about a very common factor that makes many traders unsuccessful.

We know winning trade and losing trade go hand by hand in the financial market. In the Forex market, it goes more frequently than other financial markets. Ideally, if a trader wins his 60% trades even with a 1:1 risk-reward ratio, he is considered a good trader. At the end of the day, he is making profit matters. By losing 40% of trades, he is still able to make money. It is simple math. Let us now dig into this simple math and find out how it could make a trader unsuccessful.

Let us assume a trader has learned or found out a strategy that offers 1:1 risk-reward with a 60% winning rate. He takes six entries in a week, and all of them hit Take Profit. In the following week, he takes four entries, and all of them hit Stop Loss (For the sake of statistics). He starts thinking something must be wrong with his strategy. He forgets the whole picture. Psychologically, he is down. Thus, he would have more problems with the strategy. He abandons his proven approach and starts looking for a new one, though, there is not anything wrong with the strategy.

As far as statistics are concerned, if on average a trade strategy gets us 40% losers, it means that 16% of the time (one every three losing streaks) a trader will encounter two losers in a row, 7% of the time he will get 3 consecutive losers, 3% of the occasions he will experience four losers. Are you already pondering? Here is the last data to be presented in front of you; about 1 in 100 trades, he will encounter five losers in a row. A trader needs to accept the fact because it is inherent to the statistical properties of his game.

We know a trader needs to do a lot of back-testing, study, demo trading before using it in live trading. This process consumes time. Moreover, a good strategy does not mean that it would suit every single trader. The new one may not be his cup of tea. Assume what happens next. He starts looking for another one.

Meanwhile, he starts losing his faith in him and this market. The consequence is obvious. He becomes a member of that ‘95% Club’.

The Bottom Line

It does not matter how good a trader someone is; he is to accept losing trades. The entire result is to be calculated. A trader must not worry about one or two losing trades, but must have faith in his strategy (which he uses after hours of back-testing, study) as long as it brings him consistent profit.

Categories
Forex Basic Strategies

You Must Definitely Try These Most Promising Bollinger Bands Strategies

Understanding Bollinger Bands

Bollinger Bands is one of the most famous indicators out there, developed by a technical analyst named John Bollinger in the 1980s. This indicator primarily identifies the volatility level of a currency pair. Bollinger bands are volatility bands placed below and above a moving average. These bands are designed such that they automatically widen when the market volatility increases and narrow or contract when volatility drops.

One of the important purposes of the Bollinger bands is to determine the relative high and low prices of the market. As simple as it gets, the prices are comprehended to be low at the lower band and high at the higher band. With this definition, we can come up with trading patterns that can help predict the upcoming market trend.

Calculation

Bollinger bands have three bands, namely, the upper band, the middle(mean) band, the lower band. And they are calculated as follows:

Upper Band = Middle band + 20-day Standard deviation x 2

Middle Band = 20-period the moving average (20 SMA)

Lower Band = Middle band – 20-day Standard deviation x 2

Below is a chart that has the Bollinger Bands embedded in it.

Setting up the Bollinger band

Every trading platform will ask you for the length of the Bollinger band. By default, the value is set to 20. And it is highly recommended to keep the default configurations to obtain optimal results from the indicator.

Now, let’s put all of the above information into action by analyzing some great strategies.

Strategy 1: Double Bottom Setup

One of the most popular trading strategies using the Bollinger bands is the double bottom setup. This is because John Bollinger himself said that, “Bollinger bands can be used in pattern recognition to define pure price patterns such as “W” bottoms, “M” tops, momentum, shifts, etc.”.

In this strategy, we will be discussing the “W” bottoms, and “M” tops.

W-Bottoms

This strategy can be applied when the market is coming from a predominant downtrend. There are four stages to consider to trade the W-bottom (double bottom) Bollinger band strategy.

  1. The reaction low must form around the lower band.
  2. From the lower band, there must be a bounce up to the middle band.
  3. Thirdly, there should be a new low, which must hold above the lower band. The hold above the previous low confirms the inability of the sellers to push the prices lower.
  4. Lastly, the price must move off the low and break the previous resistance. This confirms the start of bullishness in the market.

Example

In the below chart, the market was in a downtrend. It made a low at the lower band and went up until the middle band and held. This satisfies the first two considerations in the W-bottom strategy. Moving forward, the price comes down again, but this time, it holds above the lower band. This confirms the third consideration, as well. Finally, the market shoots up and breaks the resistance (black line), indicating a buy signal.

M-top

M-top is the opposite of the W-bottom strategy. But, the working of this strategy remains the same. That is, firstly, the price must try to go above the upper band. Secondly, the price should drop down to the middle band. Thirdly, it must go up again but not higher than the previous high. And finally, the market must drop below the support line. And once all these scenarios take place, we can prepare to go short.

Example

In the below chart, the market went above the upper band, pulled back to the middle band, shot up again, but could not go higher than the upper band, and finally, the price dropped below the support (black line). So, this is when we can confidently hit the sell.

Strategy 2: Return to the Mean or Middle of the band

If you wish to extract only small profits from the market, then this strategy will be apt for you. This strategy mainly focusses only on small movements rather than big swings. An advantage of this strategy is that you will be able to pull off consistent profits and reduce risks significantly.

The principle of this strategy is to go long when the price comes down to the middle line. However, to reduce the risk, there are some factors which are implemented when trading this strategy. Below, we have mentioned some of the techniques to trade this strategy.

In the below chart, we can see that the market shot to the upside, pulled back to the middle line, and again shot up north. Here, if we were buying at the middle line, we would have made a profit out of it. But, not always will this work in your favor.

There are some points you must consider before trading this strategy. Firstly, the initial buyers must be very strong. Secondly, the sellers (pullback) must be weaker than the preceding buyers. Thirdly, the price must hold around the mean line. The occurrence of patterns like doji, hammer, spinning top, etc. around the mean line can give additional confirmation on the trade. Therefore, once all the criteria are satisfied, you can go for the buy.

Bottom line

Bollinger band is an excellent indicator to determine the direction of the market. The bands indicate if the market is at a relatively high or low. And these highs and lows help in predicting if the market is continuing its trend or preparing to reverse. Also, chartists combine this indicator with other indicators to have an extra edge over their trade.

We hope you understood these strategies. It is highly recommended to try these in your daily trading activities. With practice, you can master this indicator and can make consistent profits if used correctly. Let u know if you have any questions in the comments below. Happy Trading!