Categories
Forex Basic Strategies

Four Powerful Above the Market Trading Strategies that Work

Above the market is an order type that executes above the current market prices or we can say order triggers in the future at the desired price we set. For, E.g., EURJPY is in a downtrend, and prices hovering around 132.50. Well, you believe that if the price action goes below the 130 Major level, then the asset is off the races.

Unfortunately, you are doing a 9 to 5 job, and trading is your part-time business and you are unable to watch the market the whole day. Therefore you place the order to automatically sell five lots of EURJPY once the prices can go beyond 130. At this point in the game, one of the two things happened. If the prices go below 130, your order will be a trigger. If the price action failed to cross the 130 major levels, your order is never executed. We have covered the basics here now let’s dig a little further.

TYPE OF ORDERS ABOVE THE MARKET

BUY STOP ORDER

Buy stop order is the order price that you set above the current market price to buy. If you place a buy stop order, then your broker will automatically trigger your order once the price is reached. No one knows at what price your order will fill; it should be close to your buy stop order price. Most traders use the buy stop orders to open a long position on a breakout or to close a short position that is going against you.

SELL LIMIT ORDER

The sell limit order is also above the market order. Here you believe that the market will run to a specific level and then it fails to move further and sooner we going to experience a downtrend. Therefore you are looking to open a short position at a significant level. Assume there is a significant resistance level at 130 levels in the EURJPY pair and you set the sell limit order because you believe when the prices hit this level, we will witness a downtrend.

TRADING STRATEGIES FOR USING THE ABOVE THE MARKET ORDERS

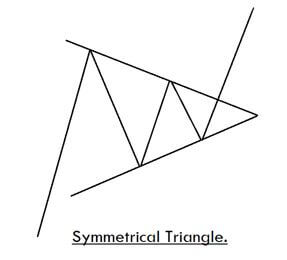
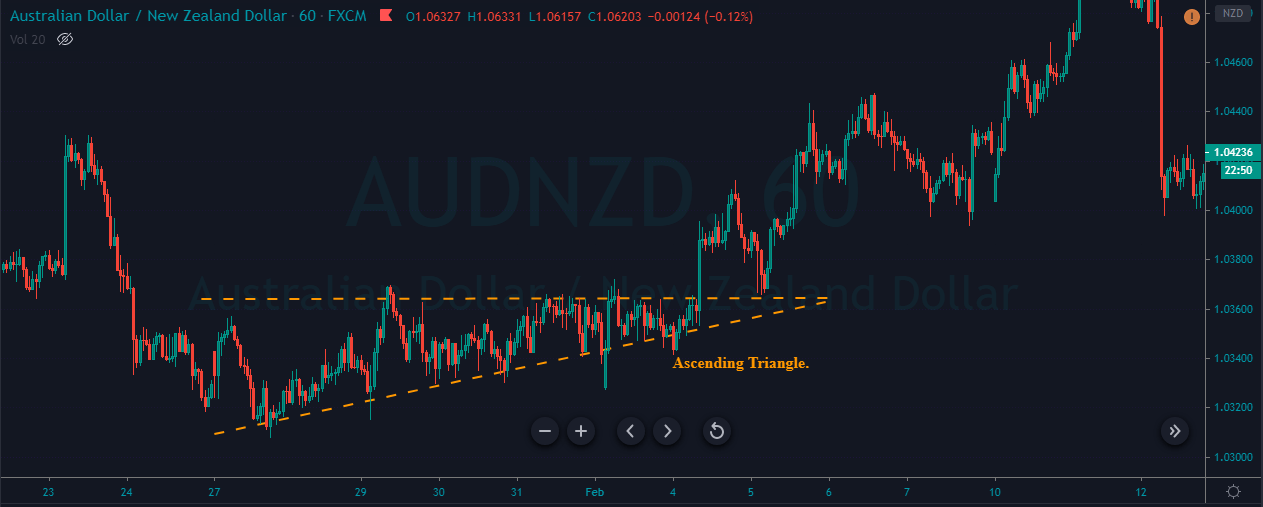
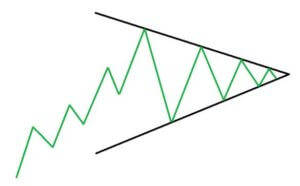
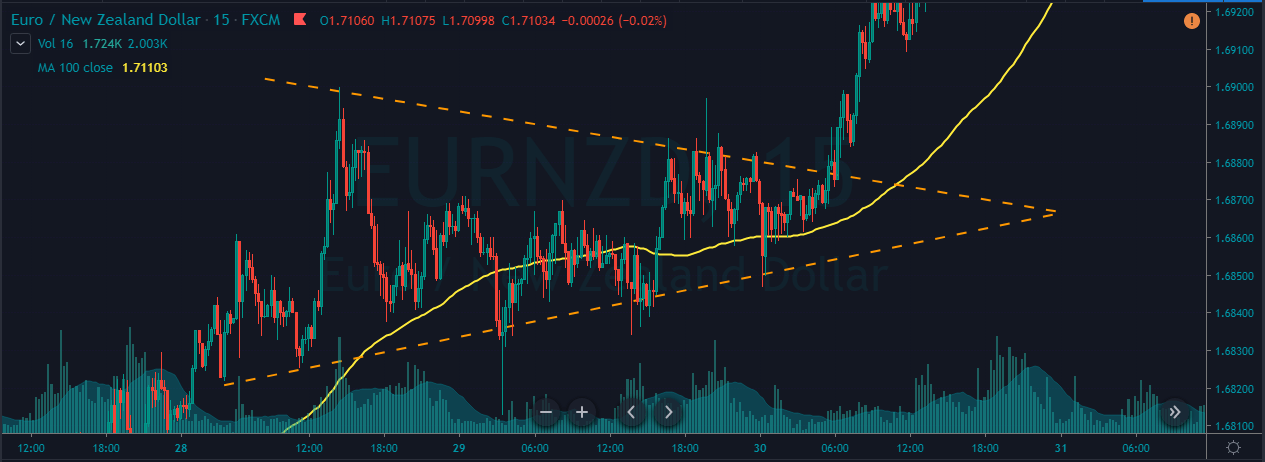
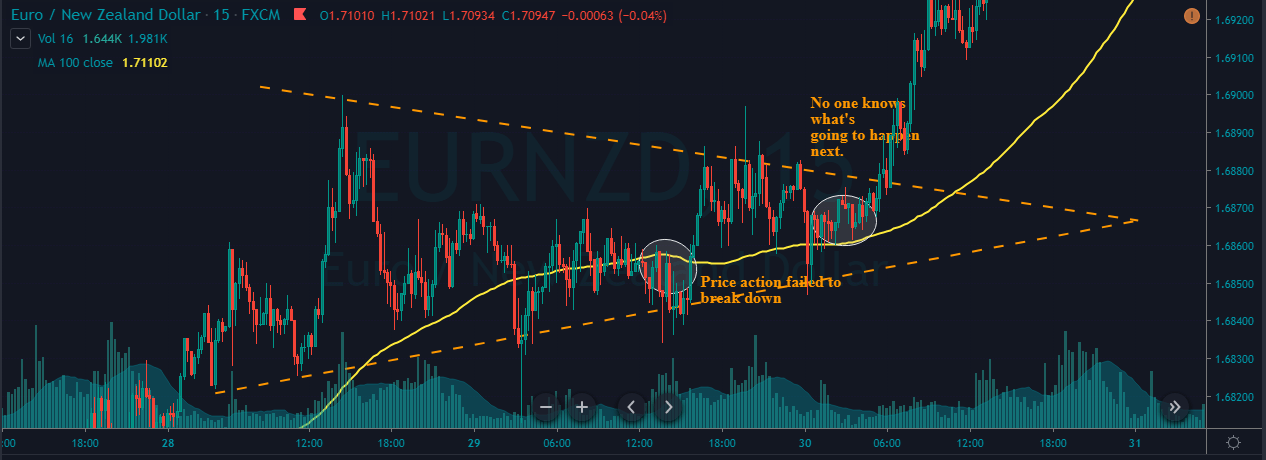
BUY STOP ORDERS AND SYMMETRICAL TRIANGLE

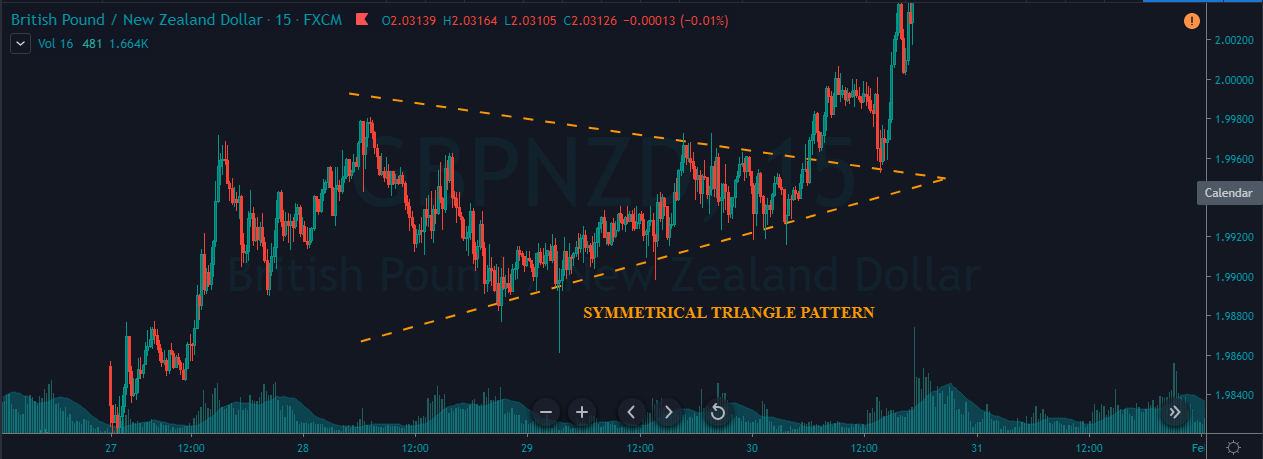
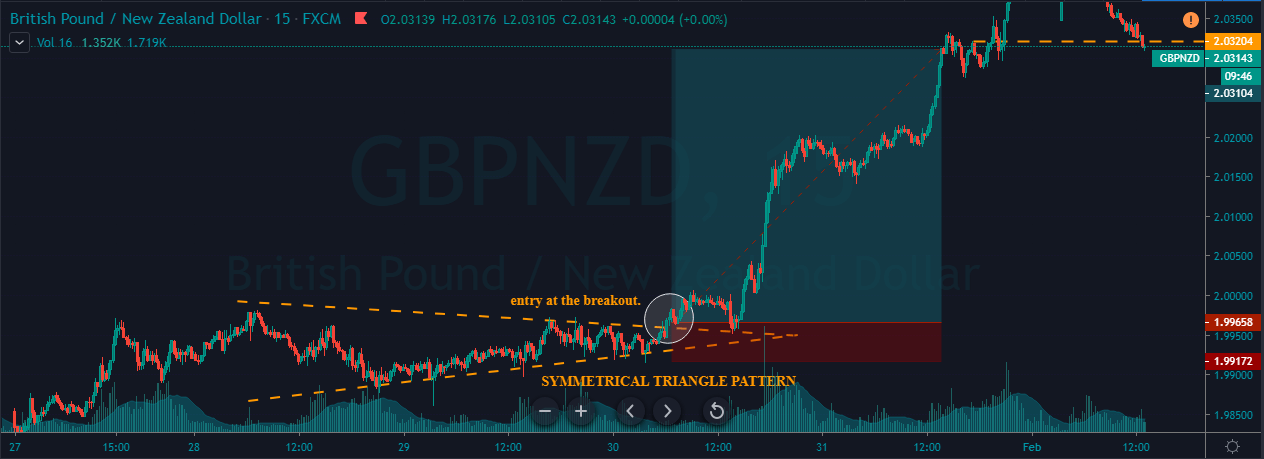
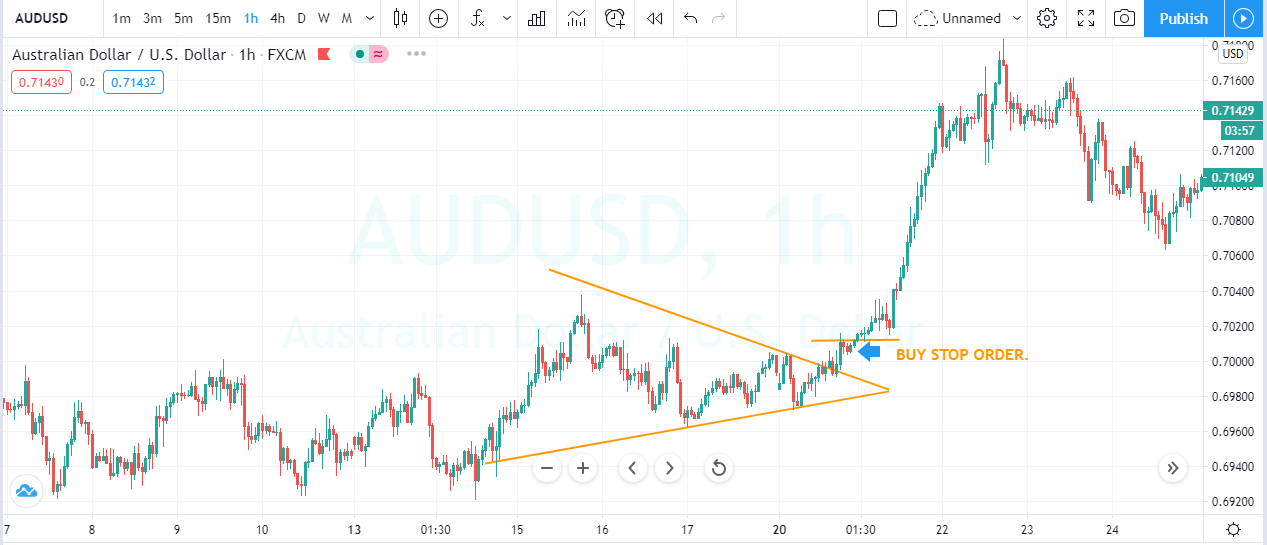
Buy stop order works very well in bullish chart patterns. Here in this strategy, we are using the symmetrical triangle to trigger the buy stop order by connecting two lower high and higher low draw the symmetrical triangle on the price chart, and place the buy stop order outside the symmetrical pattern. Your buy order will be trigger when the price action breaks the pattern. Place the stop loss order below the pattern and go for a brand new higher high.

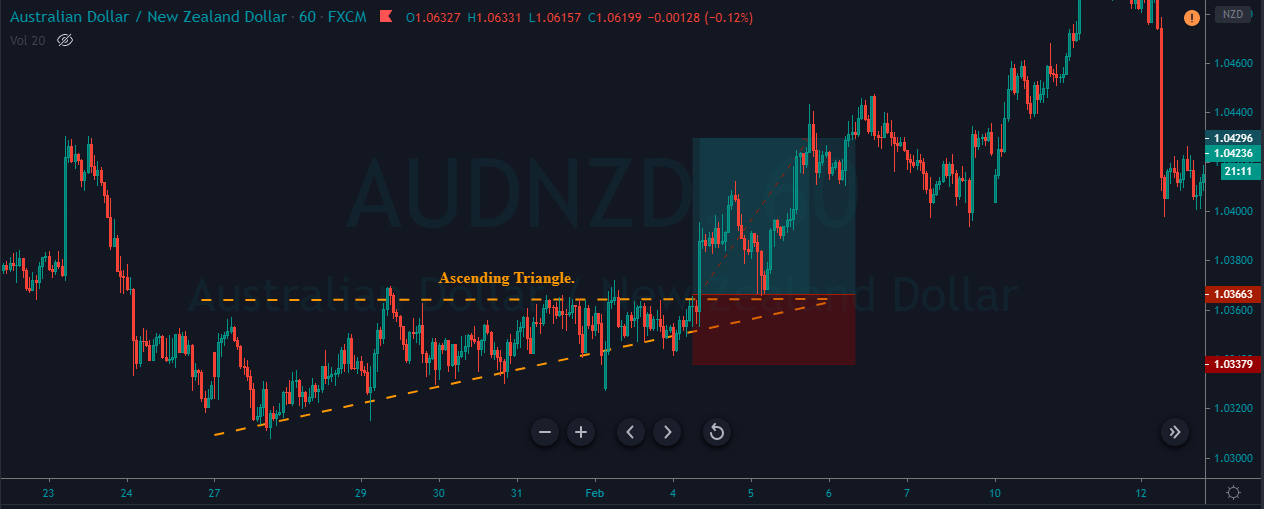
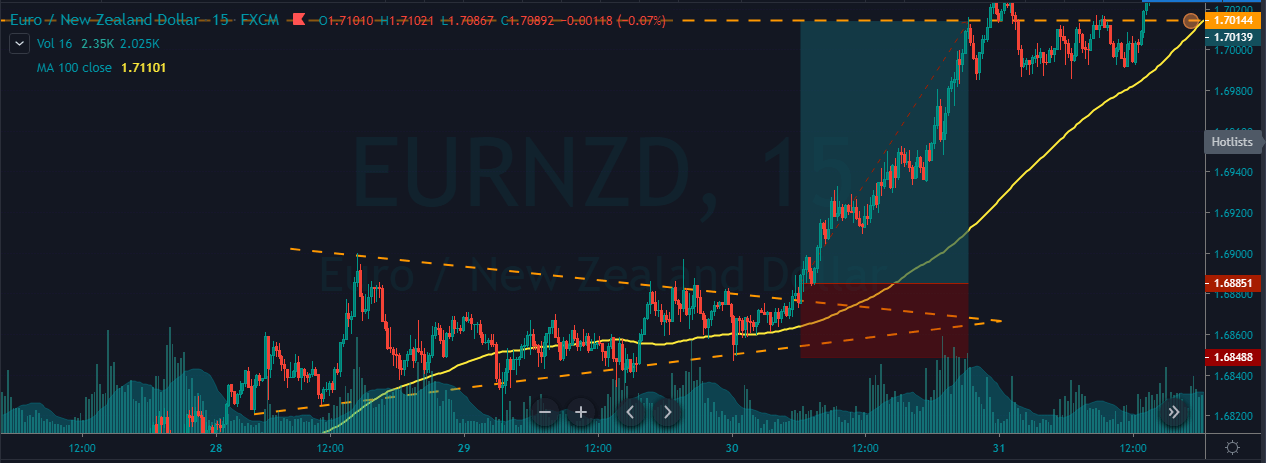
The image below represents the symmetrical triangle chart pattern on the AUDUSD forex pair. The blue arrow was the area where you should place the buy stop order. After the breakout when the price action triggered the buy stop order, the stop loss should be placed below the resistance line of the pattern. The resistance line acts as dynamic support to the price action, which helps the traders to stay in a trade and always choose the brand new higher high for the take profit.

HIGHER HIGH BREAKOUT TRADES

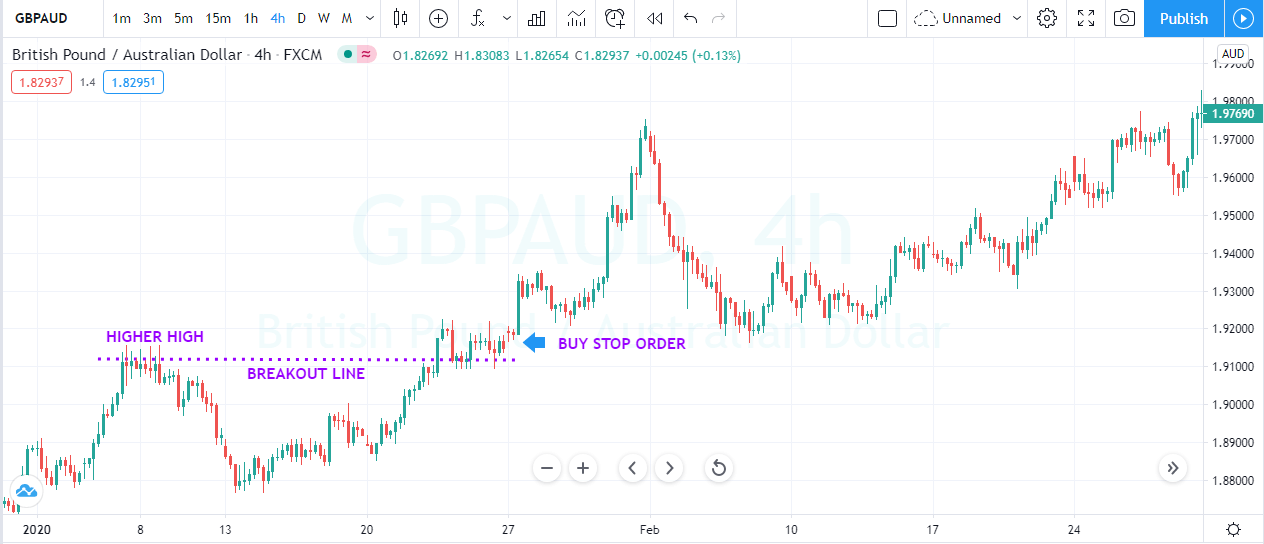
The buy stop order is efficient for trading the trending market conditions. Find out the trending market, wait for the price action to print brand new higher high, after the brand new higher high let the price action to pull back enough and place the buy stop order above the most recent higher high. Wait for the prices to break the most recent higher to trigger your order. Most of the time, when price action breaks the recent higher high, it is a very high likelihood that the prices will continue more elevated in the same direction. No one knows how much the price action goes higher after the breakout, but it is advisable to close your trade when the price action approach to the significant resistance level.

The image below represents the buying trade in the GBPAUD forex pair. The currency was in an uptrend, and after the pullback, it breaks above the most recent higher high. After the breakout, our buy stop order was triggered, and we choose to go for the brand new higher high.

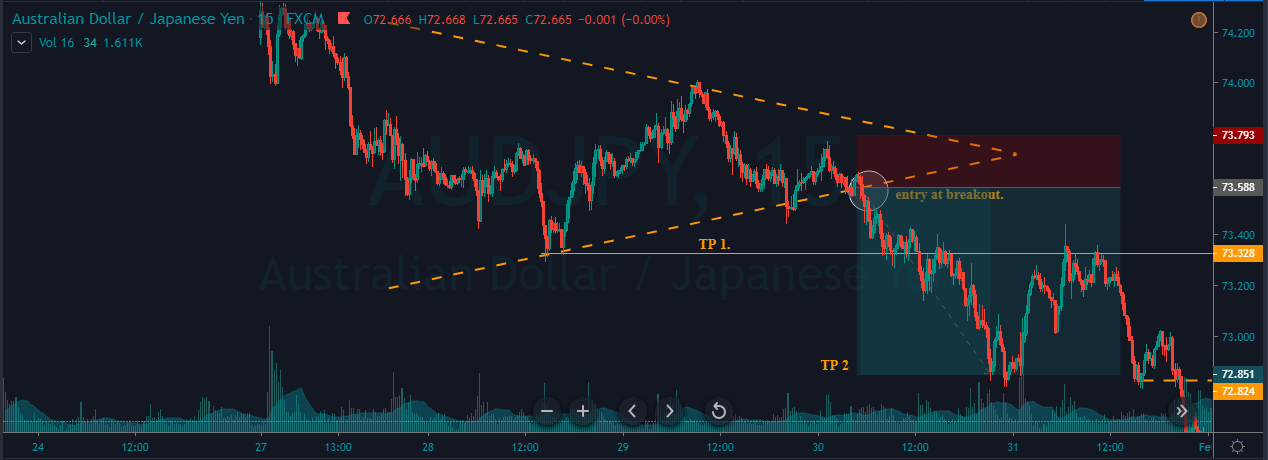
USING THE SELL LIMIT ORDER TO TRADE THE BREAKDOWNS

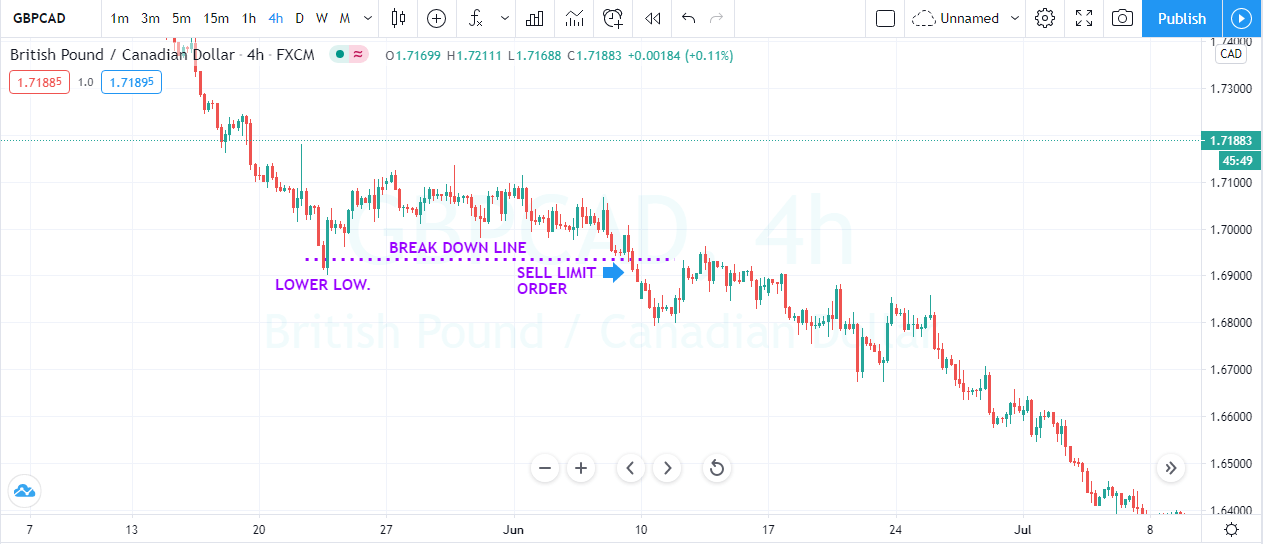
The sell limit order is useful to trade the downtrend markets. Look for the downtrend markets, wait for the pullback to happen, and place the sell limit order below the most recent lower low. Wait for the prices to break the most recent lower low to activate your sell limit order. On the left side of the chart looks for the significant level to close your selling position. The stop-loss order should be above the most recent lower low.

The below image represents the downtrend on a GBPCAD forex pair. As you can see around the 22nd of May, we witnessed the lower low in the pair. As the price action pulled back enough, it starts to roll over again and breaks the most recent lower low. At the break of the lower low, we choose to put the sell limit order and sooner market triggered our order, and we witnessed the brand new lower low.

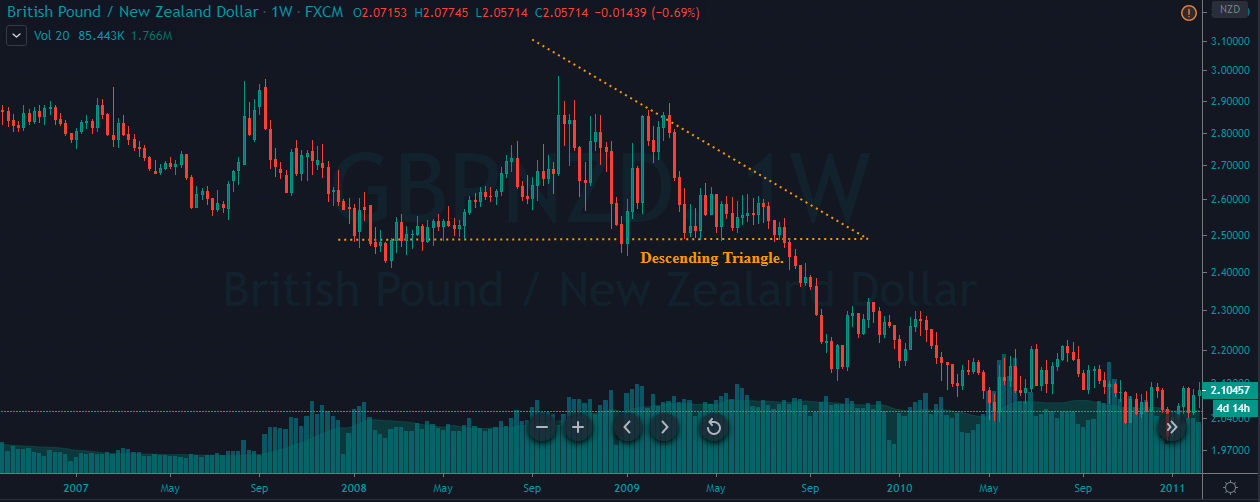
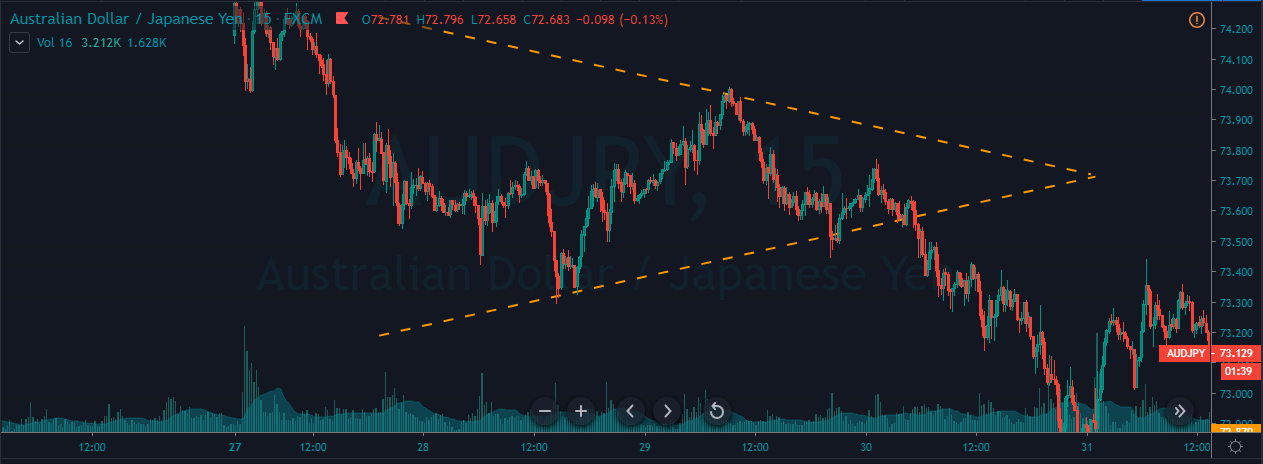
SELL LIMIT ORDER AND BEARISH TREND

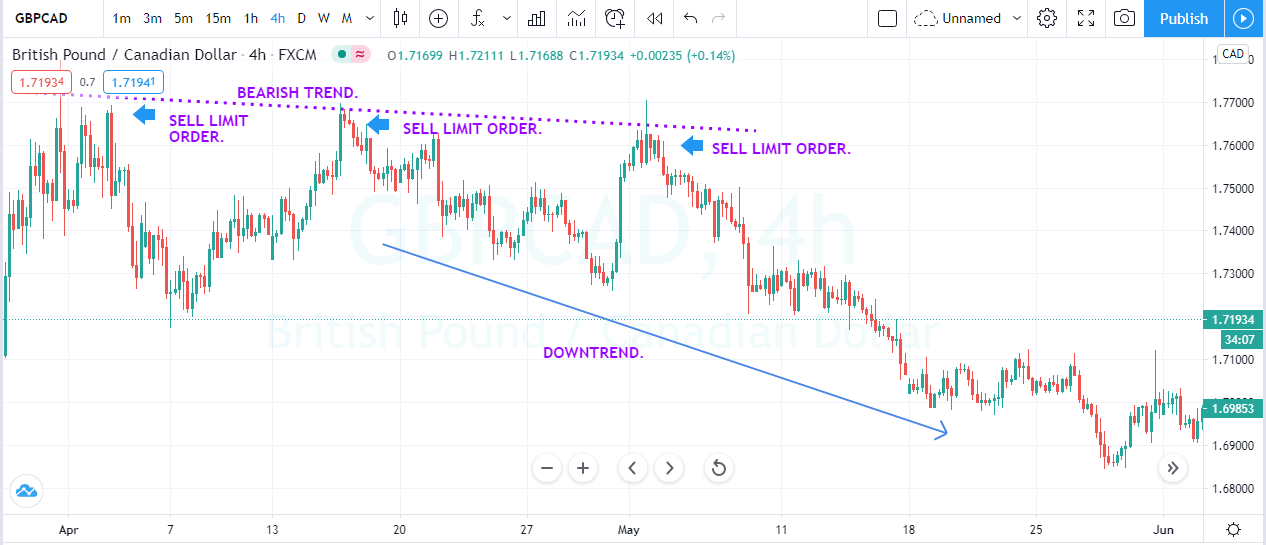
Find out the trending lower asset, which keeps approaches the timeframe support area. At those stages of the market, you will witness that the selling trend has a hard time to print lower low because buying pressure of the main level affecting the prices, but overall sellers are still in control. After the number of corrective moves draws a downtrend line across this resistance line. Place the sell limit order at the downtrend line in anticipation for the price to roll over and continue its downtrend.

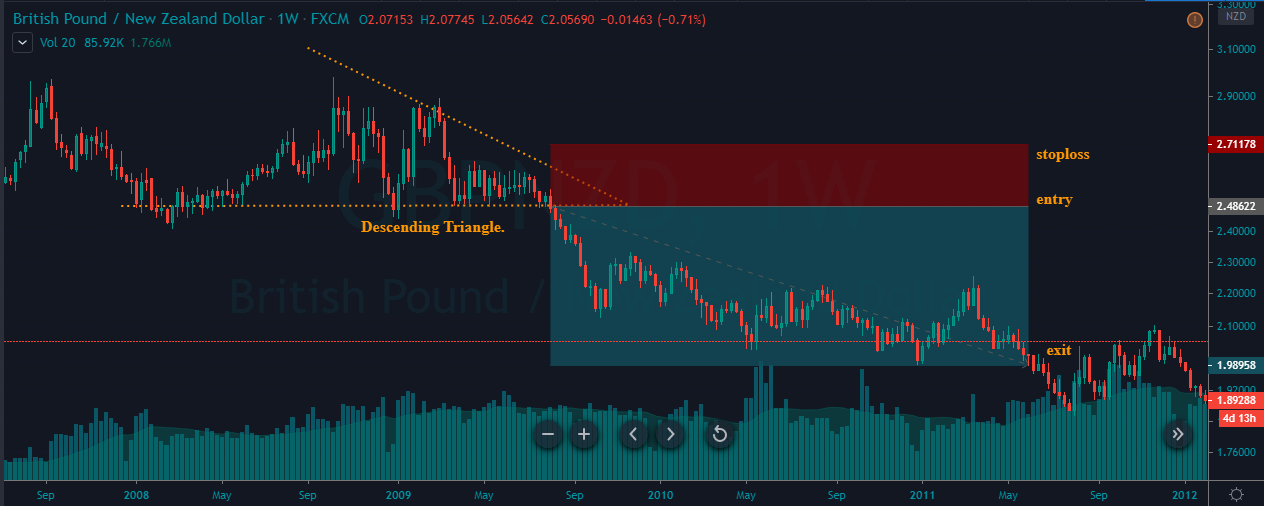
The image below represents the selling trades in the GBPCAD forex pair. The pair was firmly in a downtrend, and when the prices approached the major support area, we witnessed some strong buying moves. Each buying move was printing the lower high, and we used that lower high to activate our sell limit orders. In total, we took three trades with the stop loss above the trend line, and for booking profit, we choose the brand new lower low.

CONCLUSION

To trade above the market means to place the order at the desired price, which will trigger automatically. There are two types of above the market orders.

  1. BUY STOP – Buy the asset when the price action approached your desire price in an uptrend.
    2. SELL LIMIT – Sell the ASSET when the price action approached the desired price in a downtrend.

The above the market orders are beneficial and convenient ways for part and full-time traders. Even part-time traders use these orders to execute their trades. Align your trading strategies with the above the market type orders to make some serious money from the market.

Categories
Forex Course

116. Trading The Ascending & Descending Triangle Chart Patterns

Introduction

The Triangle Chart pattern is one of the most frequently found Forex patterns on the price charts. Technical traders prefer trading this pattern as it provides greater insight into the future price movement and the upcoming resumption of the current trend. This is a consolidation pattern that occurs in the midway of the trend, and it signals the continuation of the existing trend.

The Triangle pattern is formed between the two converging trend lines as the price temporarily moves into a small range. We must wait for the breakout to happen in an existing trend to take a trade. There are three types of Triangle chart patterns, and they are the Ascending Triangle, Descending Triangle, and The Symmetrical Triangle.

Ascending Triangle

It typically appears in a bullish trend. When the price action breaks the upper horizontal trend line with increased volume, it indicates a buy signal.

Descending Triangle

It is a bearish continuation pattern, and it appears in a downtrend. When the price action breaks the lower horizontal trend line with increased volume, it implies that the original sellers are back in the show, and it is an indication for us to go short.

Symmetrical Triangle

It is composed of diagonally falling upper trend line and diagonally rising lower trend line. When the price action reaches the apex, the price can break out from any side. We must be taking our positions depending on the price momentum and strength.

How To Trade The Triangle Chart Pattern?

Trading The Bullish or Ascending Triangle Pattern

The below chart represents the formation of an Ascending Triangle chart pattern in the AUD/NZD forex pair.

In the below Ascending Triangle pattern, we can see that both buyers and sellers are super strong. When the buyers break above the resistance line, it indicates that the game is finally in the hand of buyers. Hence, this is the perfect time to go long. The stop-loss was placed just below the pattern, and we book the profit when price action reached the previous significant high.

Trading The Bearish or Descending Triangle Pattern

The below chart represents the formation of a Descending Triangle chart pattern in the GBP/NZD Forex pair.

As we can see in the below chart, the pair was in an overall downtrend. When the price action reached a significant support area, the market started to move in a range. This range eventually has turned into a Descending Triangle chart pattern. As discussed, this pattern indicates that buyers and sellers are aggressive in taking the lead.

But the breakdown towards the sell side shows that the sellers have finally won the battle. We have placed the sell order right after the breakout, and stop-loss was placed just above the recent higher low. You can observe from the below chart that after going short, the price action started to move smoothly in our direction. We have closed our entire position when the price is started to struggle going down.

That’s about Ascending and Descending Triangle chart patterns. There are many strategies we can use to maximize profits while trading this pattern, and they can be found in the Basic Strategies section. All the best.

[wp_quiz id=”72812″]
Categories
Forex Basic Strategies

Trading The ‘Symmetrical Triangle’ Chart Pattern Using SMA

Introduction

A Symmetrical Triangle is one of the most reliable chart patterns in the market. This pattern is characterized by converging two trend lines, which are drawn by connecting a series of peaks and troughs. The Symmetrical Triangle pattern is made up of price fluctuations where each swings high and swing low makes lower highs and higher lows. Essentially, the coiling movement of price action creates the structure of a Symmetrical Triangle. When the triangle is forming on the price chart, it indicates that neither the sellers nor the buyers are pushing the price far enough to create a clear uptrend or downtrend.

This pattern is also known as the ‘coil’ because, most of the time, it forms in a continuation phase. Symmetrical Triangle pattern consists of at least two lower highs and two lower lows. So when these points are connected, the lines converge, and the Symmetrical Triangle takes shape. A part of the trading community believes that if this pattern is formed in an uptrend, the price will break upward. Likewise, if the pattern forms in a downtrend, the price action will break downward. However, these are just assumptions and are not entirely true.

The reason for the formation of the Symmetrical Triangle on the price chart is because of the lack of volume and price movement in any underlying currency pair. This eventually results in the formation of a coiling pattern. Hence it is merely impossible to find out which side of the pattern will breakout.  The only way to trade this pattern is to let the breakout happen on any of the sides and take the trade only after confirmations.

Symmetrical Triangle Chart Pattern – Trading Strategies

Conventional Way – Buy Example

Step 1 - Identifying The Pattern

We can see the formation of a Symmetrical Triangle pattern in the below GBP/NZD Forex pair. We can observe the market coiling and not moving in any certain direction, which eventually resulted in this pattern.

Step 2 - Entry, Stop-Loss & Take-Profit

In the below chart, we had taken the entry when the price action broke the upper trend line. This pattern is pretty reliable but needs a lot of patience as the only way to trade is by stalking the charts. We can notice the market blasting to the north immediately after the breakout of the upper trend line. The stop-loss is placed just below the lower trend line, and the take-profit is placed at the higher timeframe’s resistance area.

Conventional Way – Sell Example

Step 1 - Identifying The Pattern

The formation of the Symmetrical Triangle pattern can be seen in the below AUD/JPY Forex pair. The market was in an overall downtrend, but from 28th – 30th January, it turned into a consolidation phase, which resulted in the formation of this pattern.

Step 2 - Entry, Stop-Loss & Take-Profit

However, on 30th Jan, the lower trend line was broken, indicating a sell signal in the AUD/JPY Forex pair. The entry can be right after the breakage of the lower trend line if you are an aggressive trader. But for conservative traders, it is recommended to watch for the bearish confirmation candles and then take the trade.

Here, we have gone for two targets. The first one was at the recent low, and the second target was a bit deeper, which is at the higher timeframe’s support area. If you are an intraday trader, then the TP1 is a good location for you to close your position. But if you are a swing trader, TP2 is the best match. Most of the time, the breakout trades do perform, and that is the reason for us to use the recent higher low as an appropriate stop-loss placement.

Symmetrical triangle + Simple Moving Average

In this strategy, we have paired the Symmetrical Triangle pattern with Simple Moving Average to identify accurate trading signals. SMA is a technical indicator used by almost every technical trader to identify the market trend. A smaller period average reacts more to the price action, whereas the larger period tends to respond less. If the SMA is below the price action, it means that the trend is up, and if it is above the price action, it indicates a bearish trend.

Step 1 - Identifying The Pattern & Plotting SMA On To The Price Chart

We can observe the formation of a Symmetrical triangle pattern on the EUR/NZD Forex chart.

Step 2 - Knowing What Not To Do

One of the most common ways of trading the Symmetrical Triangle and SMA is to let the price action go above or below the MA line to take an entry. But that approach is riskier, and let’s see why. In the below image, we have marked two circles where the MA generates both buy & sell signal. It is clear that the selling signal failed to perform, and the price action goes above the SMA. When the price broke the SMA, some traders might have taken buy entries, but that’s an immature way to trade this pattern. The reason for the formation of the Symmetrical Triangle is due to the lack of volume or price movement. So there is no way to know which side of this pattern will break.

Step 3 - Entry, Stop-Loss & Take-Profit

The correct way to trade the Symmetrical Triangle pattern is to use both of the trading tools in conjunction with each other. When the SMA goes below the price action, it confirms that the prices are more likely to break upside. When strong buyers break the Symmetrical Triangle with strong power, it’s a clear indication for us to go long. So we have entered the market right after the price broke above the upper trend line of the pattern.

If you are a confirmation trader, we recommend you wait for the price action to hold above the Symmetrical Triangle to take a ‘buy’ entry. For this particular strategy, we placed the stop-loss below the SMA, and take-profit was at the higher timeframe’s resistance area. After our entry, we can see the buyers blasting to the north, and we end up milking 100+ pips in this Forex pair.

Conclusion

The Symmetrical Triangle pattern is widely used among traders. The difficult part of trading this pattern is predicting the direction of the breakout. All we can do is to watch the charts until the breakout happens and anticipate the trade. The traditional way to book the profit is at the beginning of the triangle itself. However, we can use some other approaches such as higher timeframe’s S&R areas, supply-demand zones, or exiting the position when the market turns into a consolidation phase.

We hope you had a good read. Let us know if you have any questions in the comments below, and we would love to answer them. Happy Trading.