Categories
Forex Basic Strategies

Using the MACD Oscillator to Trade the Ascending and Descending Triangle

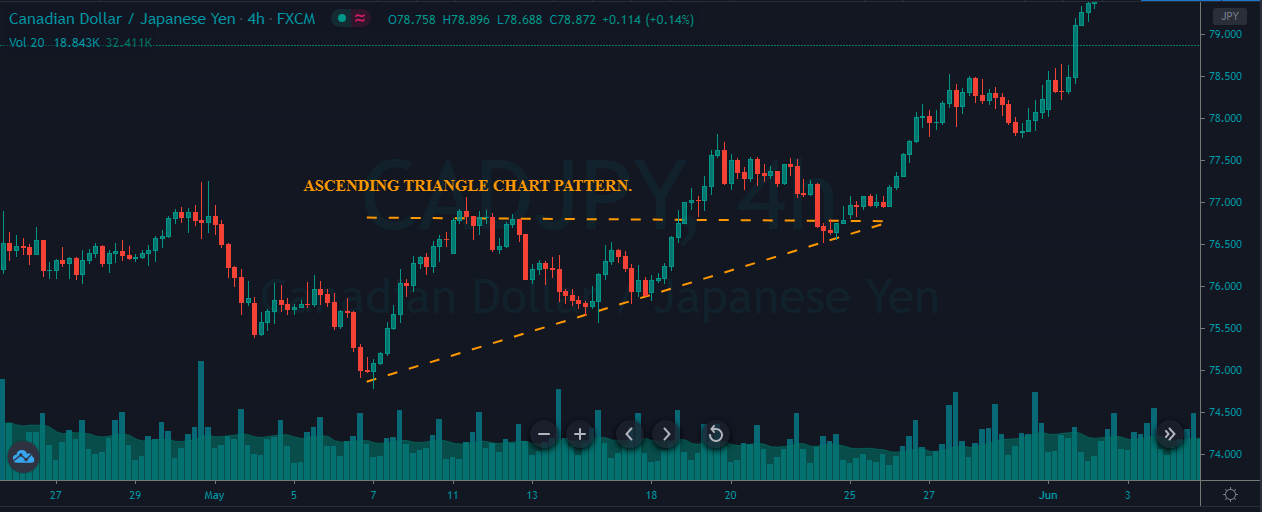
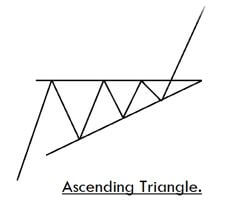
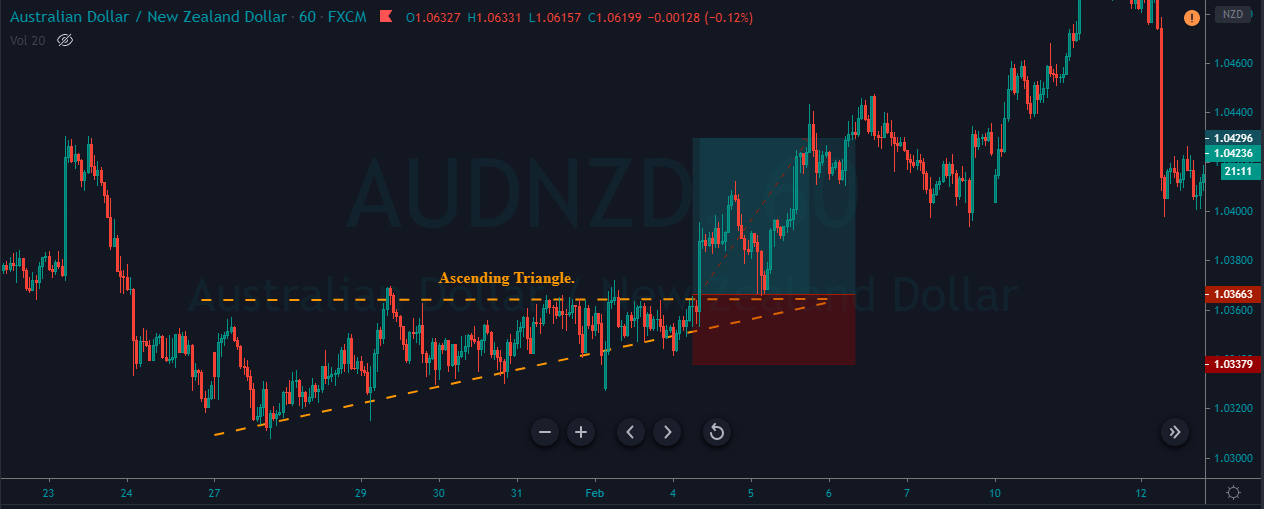
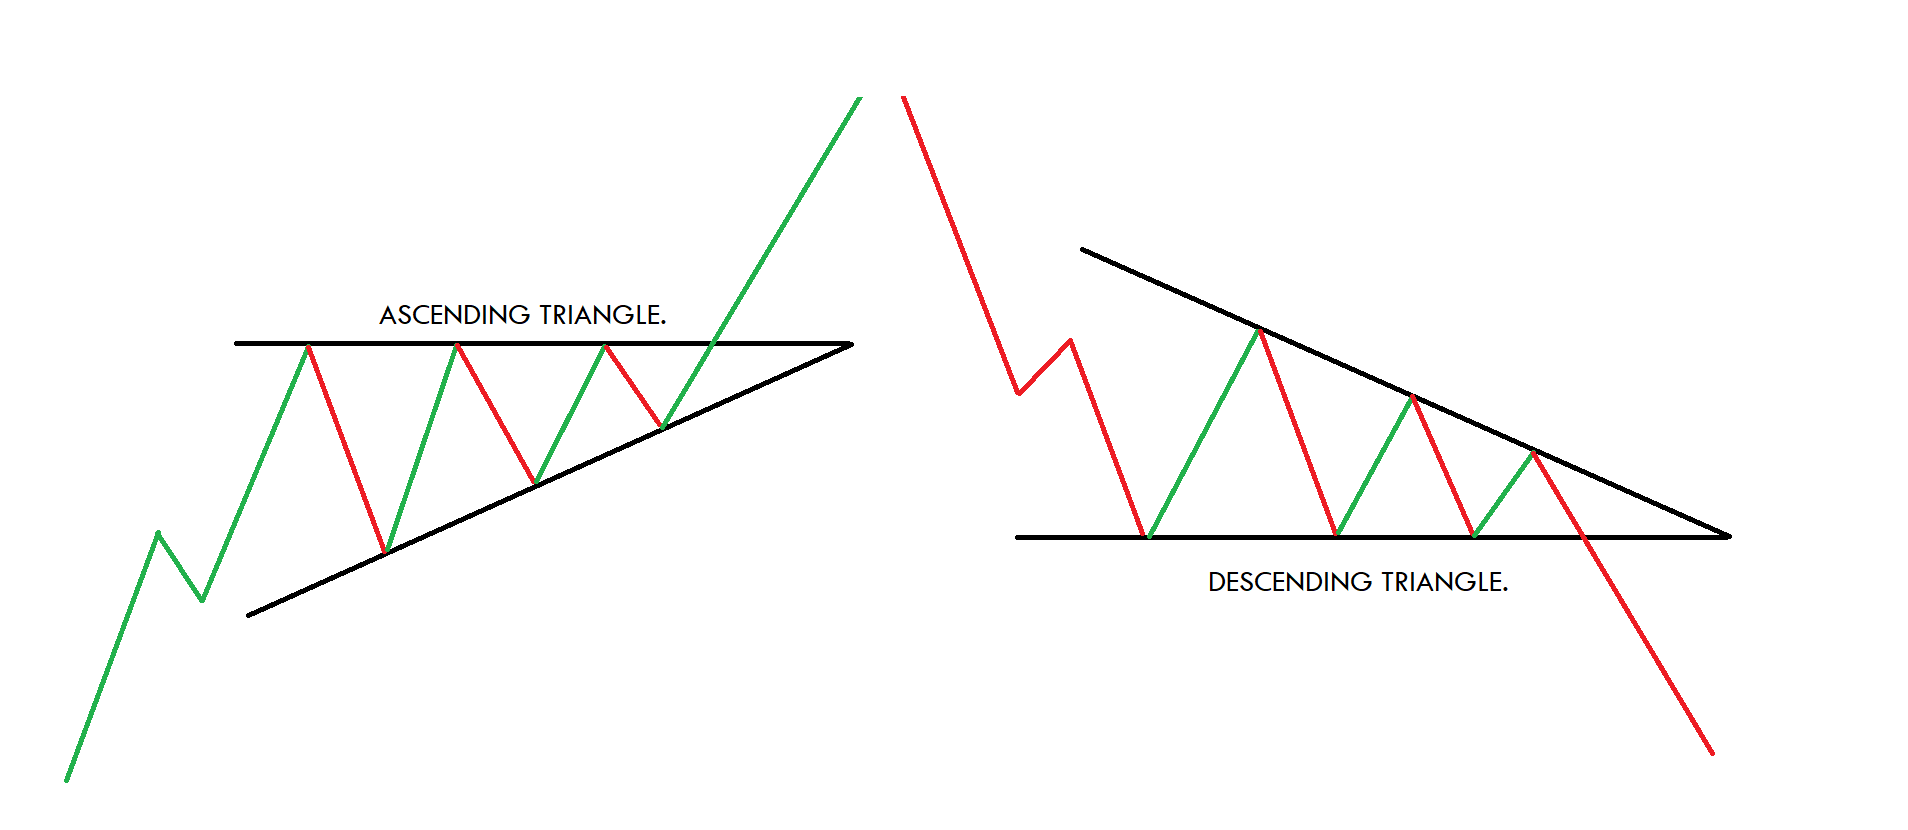
The ascending triangle is known as the continuation pattern because the breakout occurs in the same direction as the trend that is in the place before the pattern forming. It is a bullish pattern that indicates the accumulation and some traders also called it a right-angle triangle. The pattern is first drawn by the horizontal line along with the swing highs and the rising trend line to be drawn at the swing lows. When these two lines met, it forms the ascending triangle pattern. The breakout on the pattern can occur on the upside or downside and if the breakout occurs downside, then the pattern invalid and if the breakout occurs on the upside then only take entry.

DESCENDING TRIANGLE

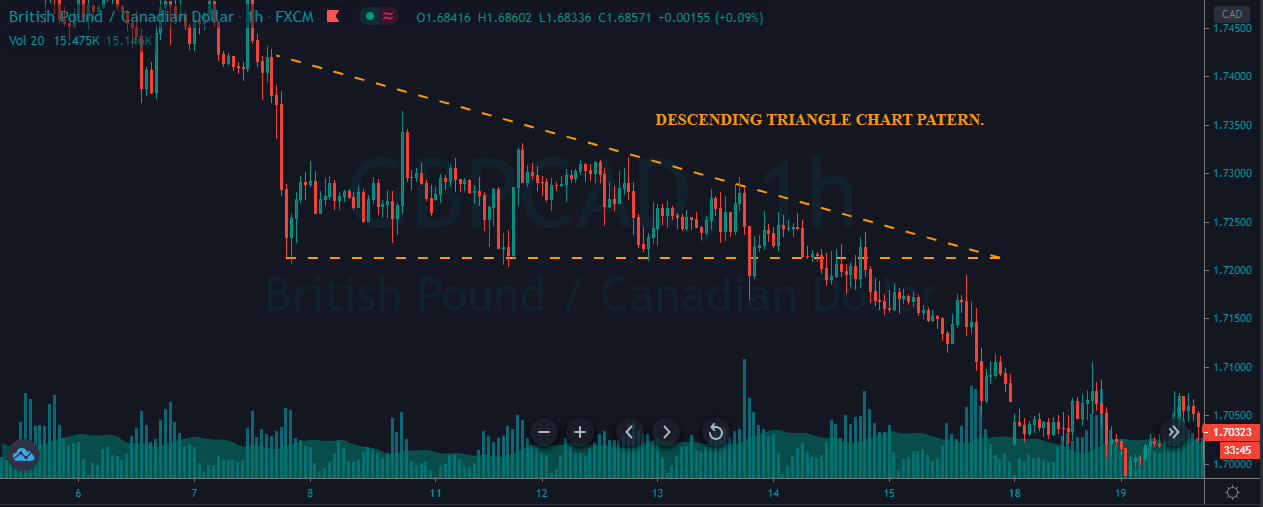
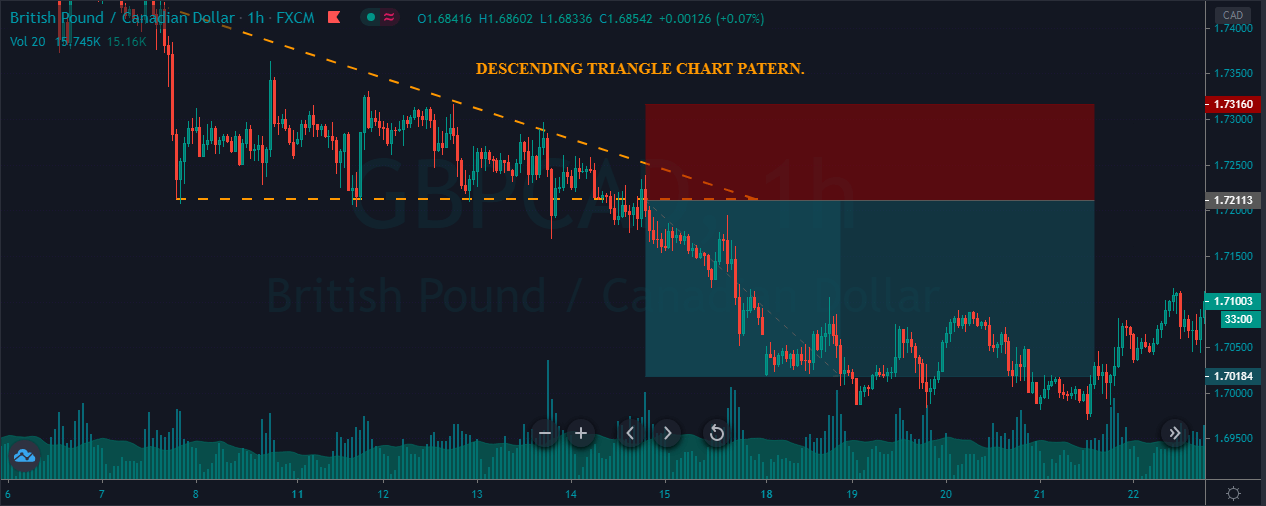
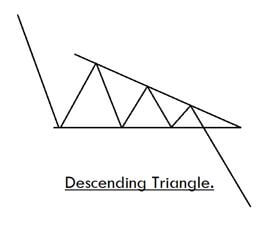
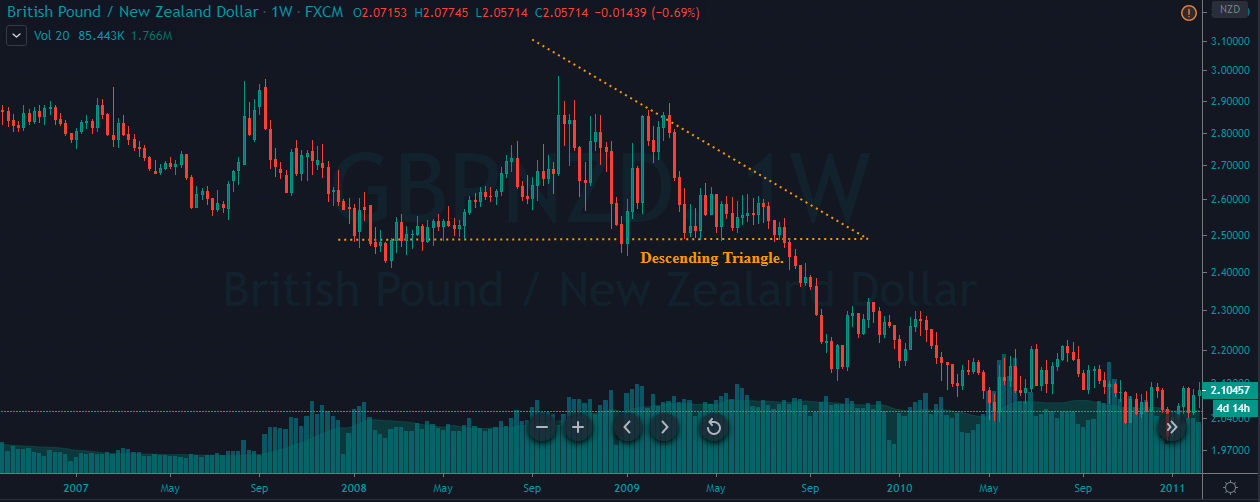
The descending triangle is also known as the continuation pattern, appears in an ongoing downtrend. The patterns show the demand for the underlying asset. The pattern is first drawn by the horizontal line along with the swing lows and the declining trend line to be drawn at the lower highs. When these two lines met, we witnessed the descending triangle pattern. The breakout of the pattern is a sign of the seller’s momentum is back into the show and going short is beneficial.

MACD OSCILLATOR

MACD stands for MOVING AVERAGE CONVERGENCE AND DIVERGENCE. MACD is one of the simplest and effective momentum oscillators developed by Gerald Appel in the late seventies. By subtracting the longer period average into the shorter period average, the MACD turned the two moving average, trend following indicator into the momentum oscillator. The MACD is an unbounded indicator that fluctuates above and below the zero line, generating the signal line crossovers, centerline crossovers, and divergences. Gerald Appel uses the values of 12, 26, and 9 as the default one, and the traders can change them according to their trading style.

THE IMAGE BELOW REPRESENTS THE ASCENDING AND DESCENDING TRIANGLE.

TRADING STRATEGIES

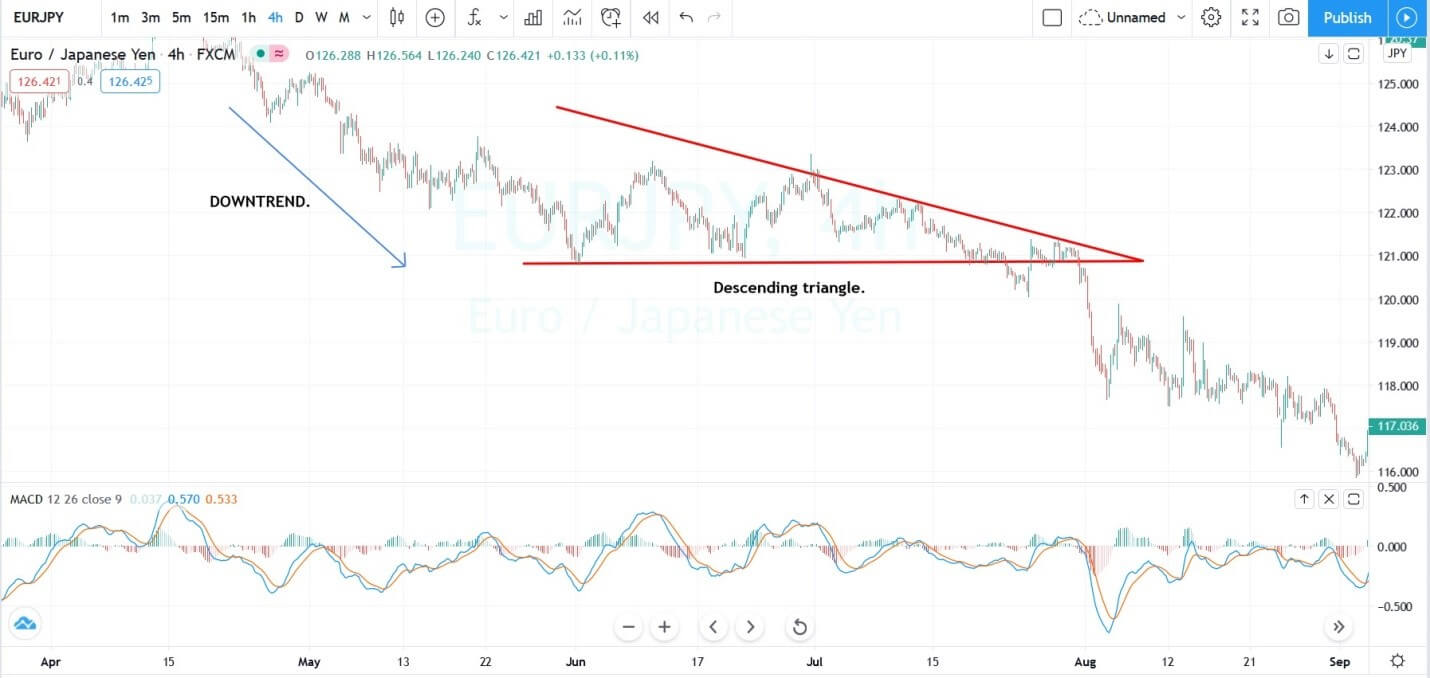
The image below represents the descending triangle in the EURJPY pair.

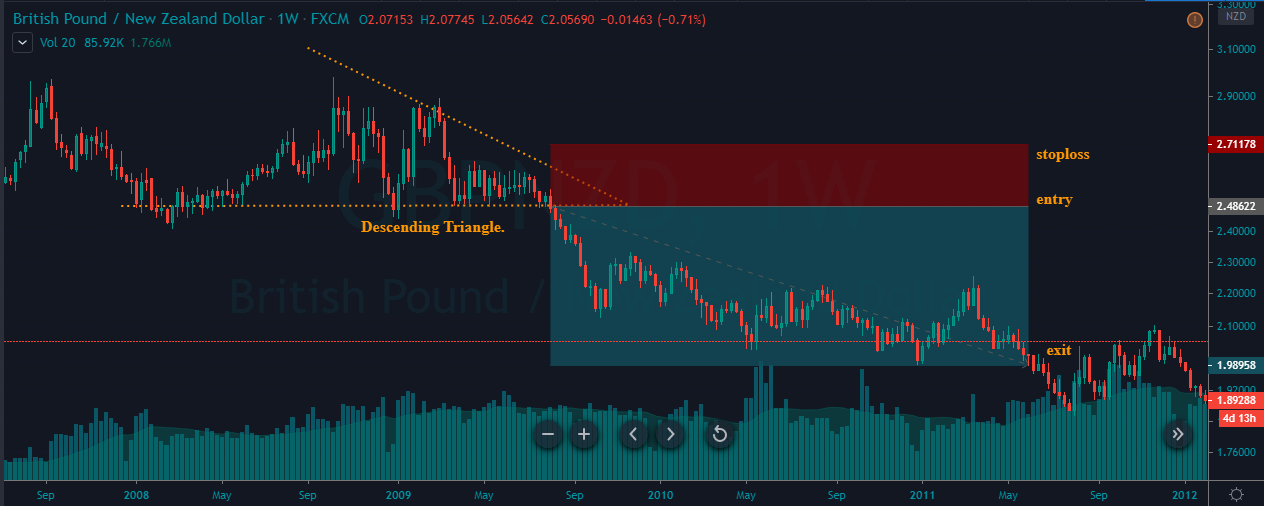
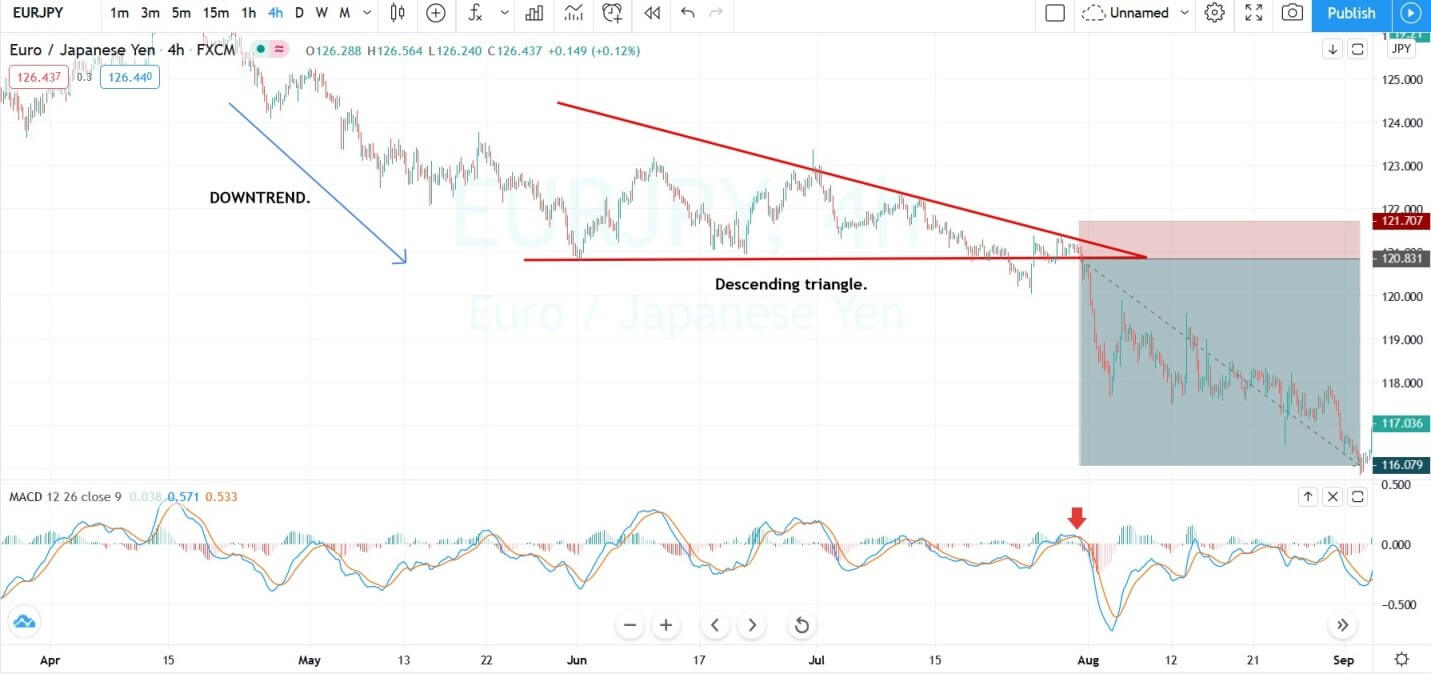
The image below represents the entry, exit, and stop-loss in the EURJPY forex pair. As you can see, the currency was in a downtrend on the 240 chart, and the breakout below the pattern also the reversal at the overbought area on the MACD was a signal of selling. We took the selling trade with the stops above the upper line of the pattern, and taking profit was based on the dying momentum of the price action.

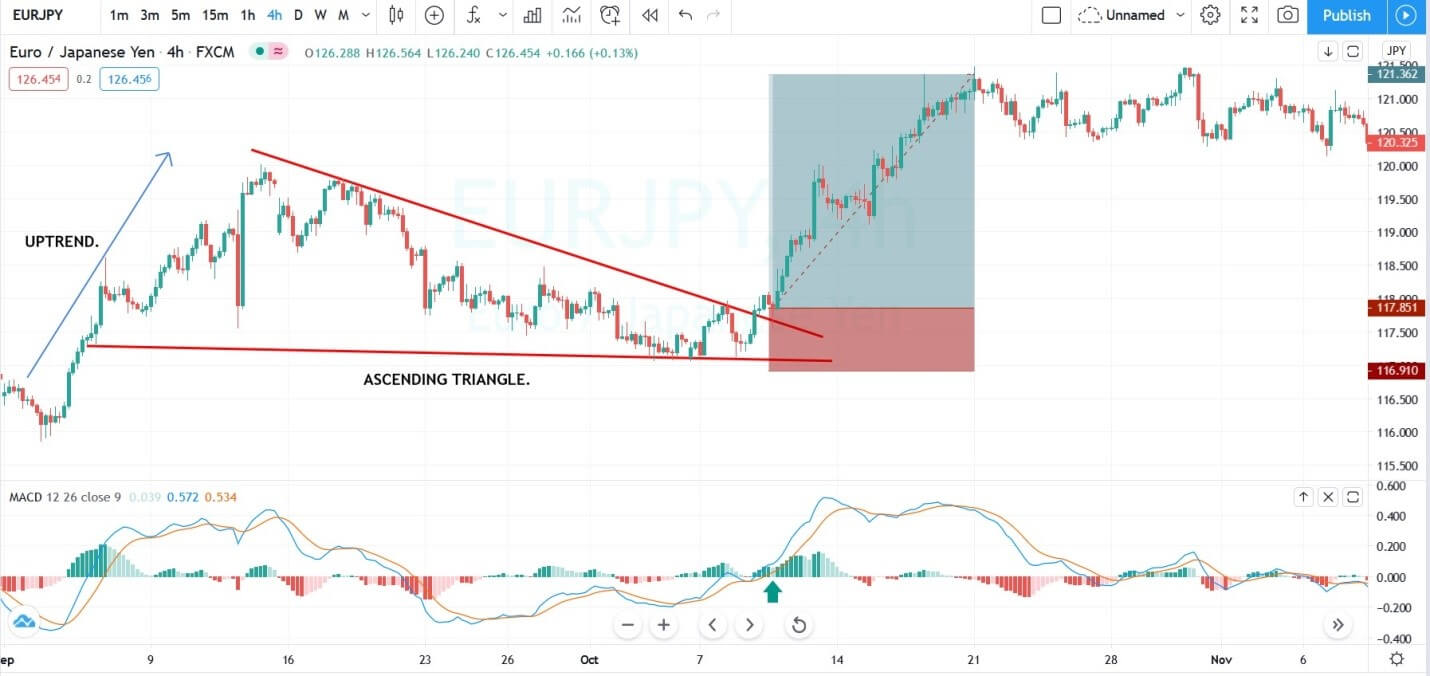
The image below represents the Ascending triangle in the EURJPY pair.

The image below represents the entry, exit, and take profit on the EURJPY forex pair. As the price action printed the pattern the MACD oscillator was already moved, and it goes above the zero line, the indicator above the zero is a sign of the buyers gained the buying momentum. As we took the entry, the prices go strongly goes to the north, and we witnessed the brand the new higher high.

TIMING THE PATTERN BY USING THE MACD OSCILLATOR

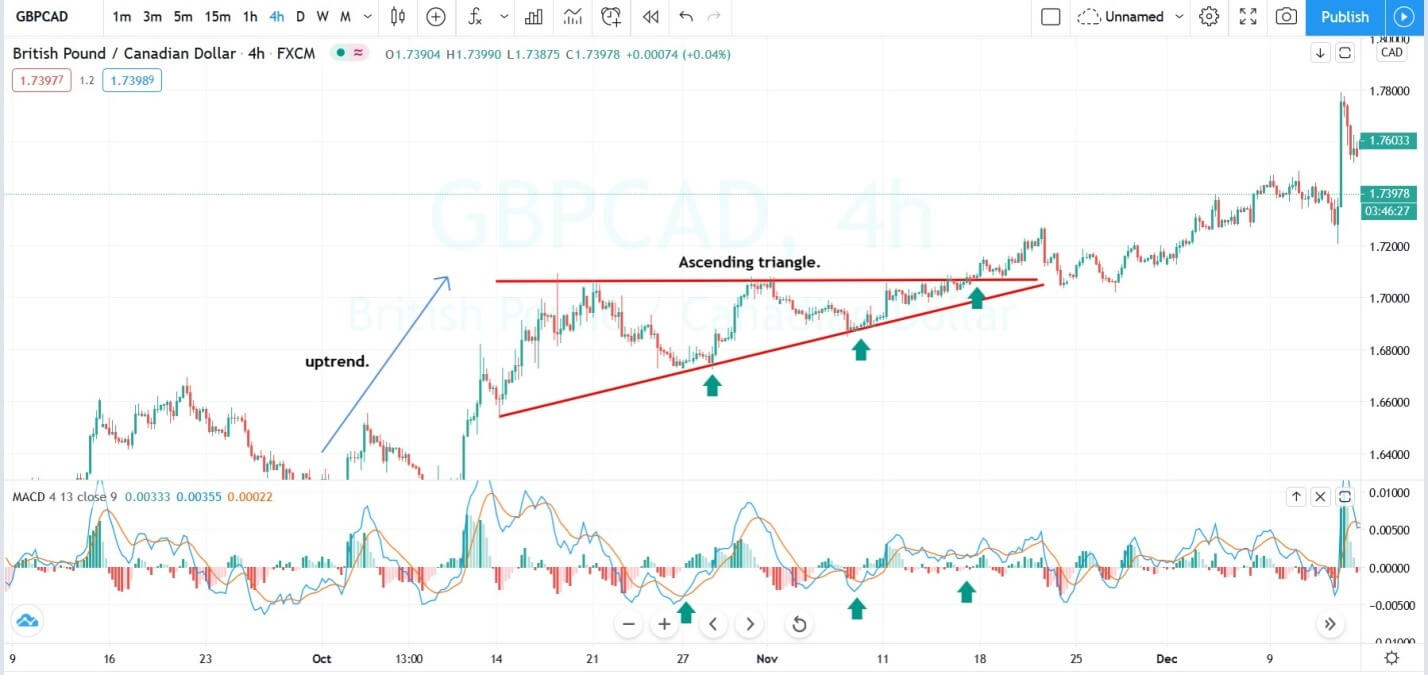
The image below represents the uptrend in the GBPCAD forex pair.

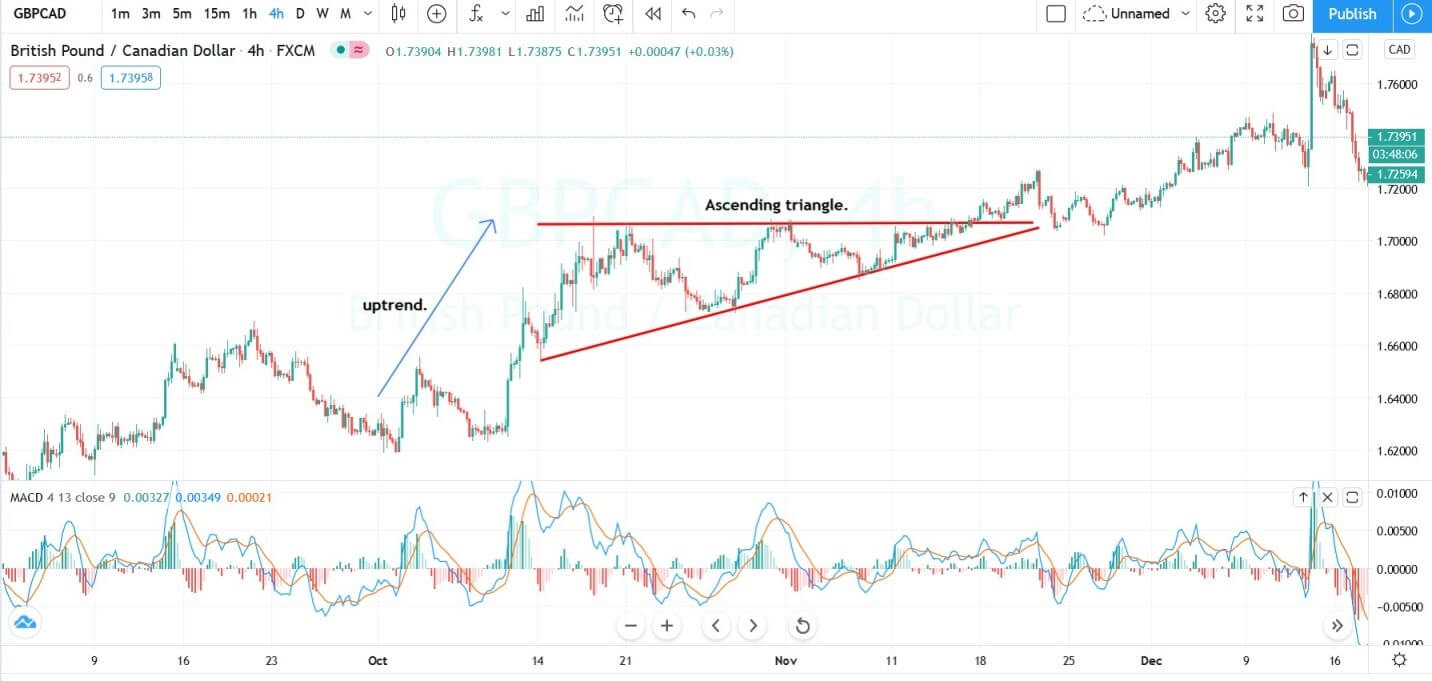
Every time price action touches the lower line of the pattern; we witnessed the brand new higher low. The goal is to buy every time price action hits the lower line, but the MACD oscillator must confirm each entry. In the below image whenever the price action touches the lower line we choose to go long, each entry was confirmed by the MACD and during the last entry, MACD was above the zero line which means buyer momentum is already strong and going long will be beneficial. The best thing about this pattern is the lower highs, which makes it easier for us to catch the bottoms of the pullback, another interesting thing is most of the time price action never came back to these lower highs.

DESCENDING TRIANGLE

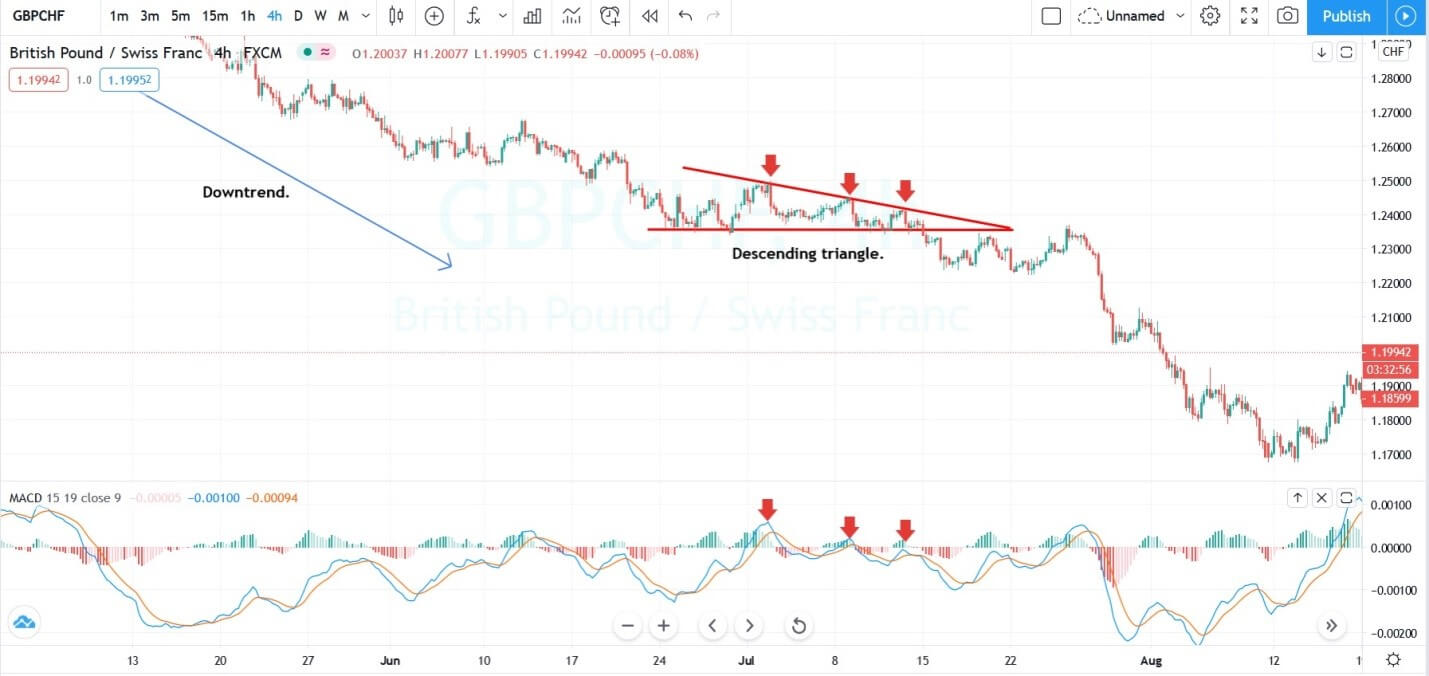
The image below represents the descending triangle in the GBPCHF forex pair.

The image below represents the entry, exit, and stop-loss in the GBPCHF pair. The pair was in a downtrend and in the pullback phase the price action prints the descending triangle pattern. Inside the pattern, we took the three selling trades, and the crossovers confirmed each trade happened on the MACD oscillator. When we witness the very first lower high on the chart, it was confirmed by the crossover above the zero line, and during the second trade the oscillator was moved below the zero line, and it gave the crossover.

During the third trade, the indicator was already below the zero line, which means the sellers were gaining momentum. We didn’t take the selling trade at the breakout this is because the entry didn’t confirm by the MACD oscillator and we were satisfied by the three trades only. Do not try to take so many trades in one pattern; your whole goal should be to take less trade and always try to go for the better price.

It Is advisable not to risk big money in the first trade this is because the buyer momentum is during before the appearance of the first higher low, and risk little more money in the second higher low and go big in the third higher low trade. The reason we are going big for the third entry is that the two previous lower highs, confirm the existence of the seller and in last the breakout entry should be way bigger than the previous entries.

CONCLUSION

Pattern trading is quite a popular way to trade the markets. There are so many trading tools, and some of the patterns are easy, and some are hard, some are leading, and some are laggards. In the end, your game completely depends on how well you master the set number of trading tools. Do not try to use everything in the market; this way is not going to work. Narrow down your approach in each category and pair one tool with another. Master them very well to mint the money from the markets. You should be so good at limited tools that no one around the globe should be able to beat you.

In this article we choose the tools different tools from two different categories, and we showed you the only two trading strategies, the limited your tools and strategies are the better it is, this is because each trading tool is made to generate the trading signal and if one day you choose one tool and another day you choose the second tool. In this way, you are simply gambling in the market. Simply follow the strategies above and master them very well on the demo to trade on the real account.

Categories
Forex Course

145. Trading The Triangle Pattern Breakouts

Introduction

Breakouts trading and trading the triangle chart pattern are two different trading tools. A breakout occurs when the price goes above or below the significant support resistance area. It indicates that the price is ready to move in the direction of the breakout, and any entry near the breakout will be fruitful. This is the reason why breakout trading is considered a leading method of trading in the industry as it helps the traders to anticipate the trend and ride the potential moves.

On the other hand, the Triangle is a technical chart pattern. The best description of the triangle chart pattern is as a horizontal continuation chart pattern, which helps the traders in finding the best entry on the price chart. At the beginning of the pattern, it is widest, and as the market continues the ranging move, the price starts to move in a limited, narrow range, and as a result, we witness the point of the Triangle on the trading chart.

The Trading Strategies

There are two types of triangle chart patterns. The first one is ascending chart pattern, and the second is the descending chart pattern.

Ascending Triangle Chart Pattern

Ascending Triangle is a bullish chart pattern that helps traders to take buy trade in an ongoing uptrend. The image below represents the formation of an Ascending Triangle chart pattern in the CAD/JPY Forex pair.

The image below represents our entry, exit, stop-loss, and take-profit in the CAD/JPY forex pair. As you can see, in an uptrend, when the price broke above the chart pattern line, it is a sign that the buyers are strengthening. Therefore, if the price is holding above the support line, it is an indication for us to go long in this pair.

Right after our entry, we can see that the price smoothly ran towards the north, and printed a brand new higher high. We can close our trade based on any nearest support area, and we also can use any indicator for the exit. The stop-loss order was placed just below the entry. In a strong trending market, the smaller stops are good enough to ride the trend.

Descending Triangle Chart Pattern

The Descending Triangle is a bearish chart pattern that helps traders in taking sell trades in an ongoing downtrend. The image below indicates the formation of a Descending Triangle pattern in the GBP/CAD Forex pair.

The below price chart of the GBP/CAD pair represents our entry, exit, and stop-loss. In a downtrend, when the price breaks below the support area, it’s a sign that the strong buyers failed to push the price higher, and any hold below the resistance line is an indication to go short. Soon after our entry, price blasted down south, printing a brand new lower low.

The descending Triangle is simple and easy to trade Forex chart pattern. Most of the time, this pattern offers excellent risk to reward entry trades. So when you see the pattern on the price chart, don’t forget to scale your position for more significant gains.

That’s about trading the ascending and descending Triangle chart pattern breakouts. Take the below quick quiz before you go. Cheers.

[wp_quiz id=”85881″]
Categories
Forex Course

116. Trading The Ascending & Descending Triangle Chart Patterns

Introduction

The Triangle Chart pattern is one of the most frequently found Forex patterns on the price charts. Technical traders prefer trading this pattern as it provides greater insight into the future price movement and the upcoming resumption of the current trend. This is a consolidation pattern that occurs in the midway of the trend, and it signals the continuation of the existing trend.

The Triangle pattern is formed between the two converging trend lines as the price temporarily moves into a small range. We must wait for the breakout to happen in an existing trend to take a trade. There are three types of Triangle chart patterns, and they are the Ascending Triangle, Descending Triangle, and The Symmetrical Triangle.

Ascending Triangle

It typically appears in a bullish trend. When the price action breaks the upper horizontal trend line with increased volume, it indicates a buy signal.

Descending Triangle

It is a bearish continuation pattern, and it appears in a downtrend. When the price action breaks the lower horizontal trend line with increased volume, it implies that the original sellers are back in the show, and it is an indication for us to go short.

Symmetrical Triangle

It is composed of diagonally falling upper trend line and diagonally rising lower trend line. When the price action reaches the apex, the price can break out from any side. We must be taking our positions depending on the price momentum and strength.

How To Trade The Triangle Chart Pattern?

Trading The Bullish or Ascending Triangle Pattern

The below chart represents the formation of an Ascending Triangle chart pattern in the AUD/NZD forex pair.

In the below Ascending Triangle pattern, we can see that both buyers and sellers are super strong. When the buyers break above the resistance line, it indicates that the game is finally in the hand of buyers. Hence, this is the perfect time to go long. The stop-loss was placed just below the pattern, and we book the profit when price action reached the previous significant high.

Trading The Bearish or Descending Triangle Pattern

The below chart represents the formation of a Descending Triangle chart pattern in the GBP/NZD Forex pair.

As we can see in the below chart, the pair was in an overall downtrend. When the price action reached a significant support area, the market started to move in a range. This range eventually has turned into a Descending Triangle chart pattern. As discussed, this pattern indicates that buyers and sellers are aggressive in taking the lead.

But the breakdown towards the sell side shows that the sellers have finally won the battle. We have placed the sell order right after the breakout, and stop-loss was placed just above the recent higher low. You can observe from the below chart that after going short, the price action started to move smoothly in our direction. We have closed our entire position when the price is started to struggle going down.

That’s about Ascending and Descending Triangle chart patterns. There are many strategies we can use to maximize profits while trading this pattern, and they can be found in the Basic Strategies section. All the best.

[wp_quiz id=”72812″]