Introduction
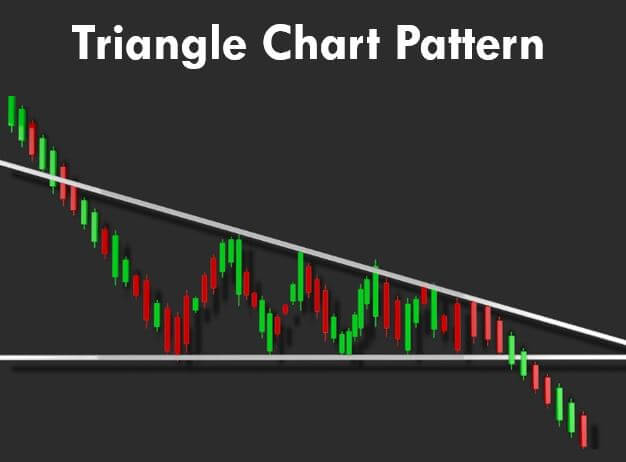
The Triangle Chart pattern is one of the most frequently found Forex patterns on the price charts. Technical traders prefer trading this pattern as it provides greater insight into the future price movement and the upcoming resumption of the current trend. This is a consolidation pattern that occurs in the midway of the trend, and it signals the continuation of the existing trend.
The Triangle pattern is formed between the two converging trend lines as the price temporarily moves into a small range. We must wait for the breakout to happen in an existing trend to take a trade. There are three types of Triangle chart patterns, and they are the Ascending Triangle, Descending Triangle, and The Symmetrical Triangle.
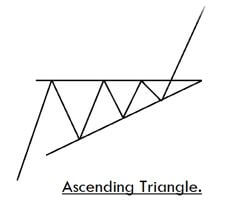
Ascending Triangle
It typically appears in a bullish trend. When the price action breaks the upper horizontal trend line with increased volume, it indicates a buy signal.
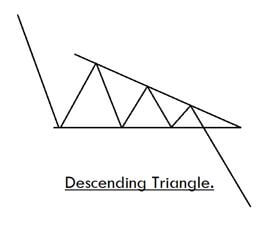
Descending Triangle
It is a bearish continuation pattern, and it appears in a downtrend. When the price action breaks the lower horizontal trend line with increased volume, it implies that the original sellers are back in the show, and it is an indication for us to go short.
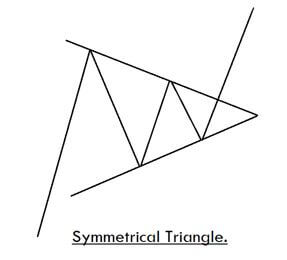
Symmetrical Triangle
It is composed of diagonally falling upper trend line and diagonally rising lower trend line. When the price action reaches the apex, the price can break out from any side. We must be taking our positions depending on the price momentum and strength.
How To Trade The Triangle Chart Pattern?
Trading The Bullish or Ascending Triangle Pattern
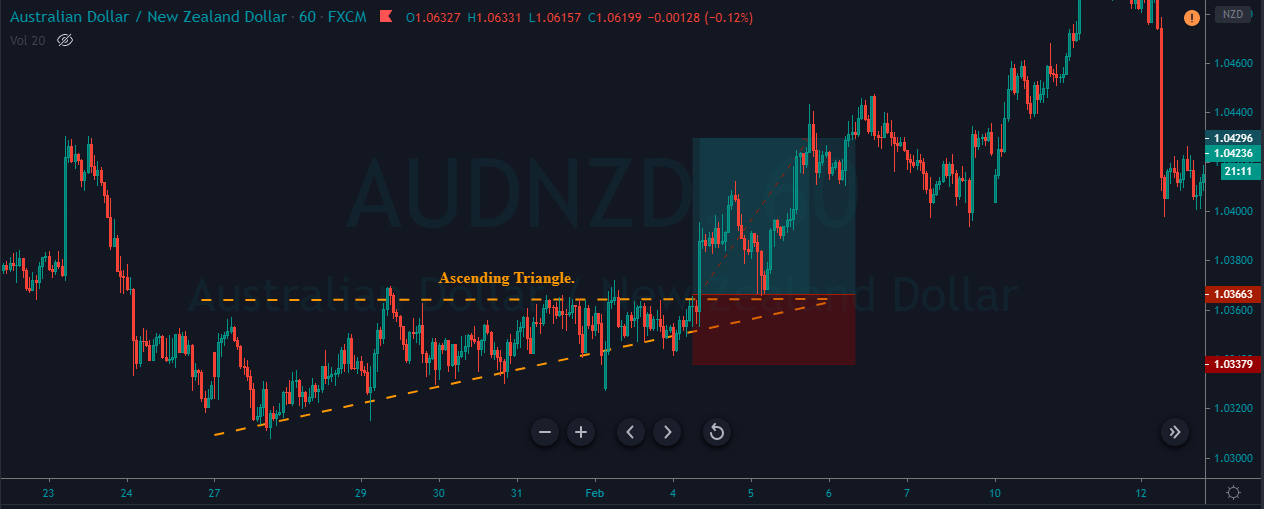
The below chart represents the formation of an Ascending Triangle chart pattern in the AUD/NZD forex pair.
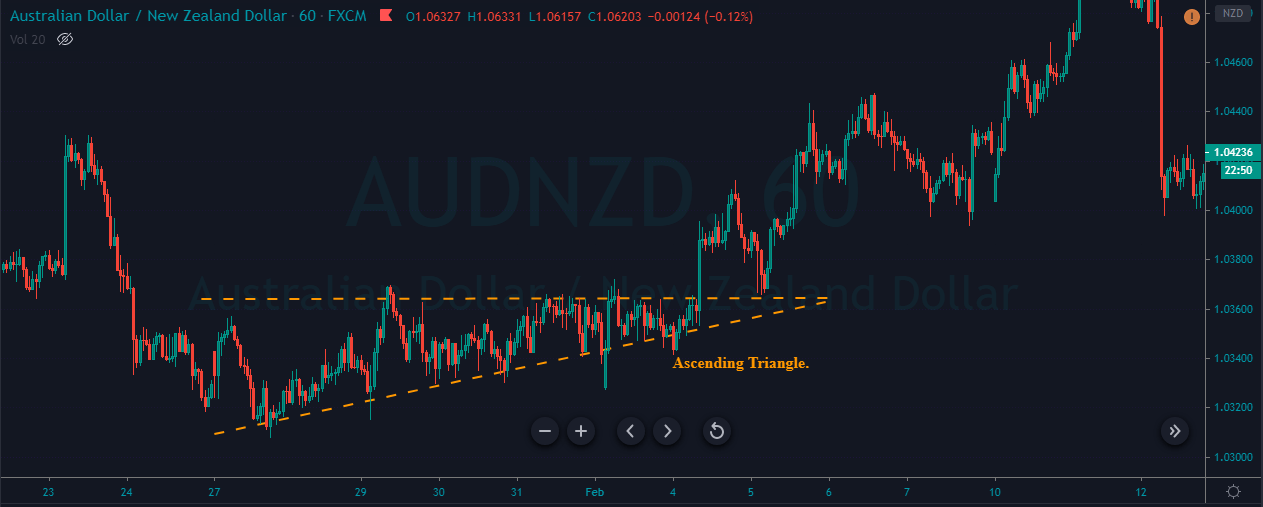
In the below Ascending Triangle pattern, we can see that both buyers and sellers are super strong. When the buyers break above the resistance line, it indicates that the game is finally in the hand of buyers. Hence, this is the perfect time to go long. The stop-loss was placed just below the pattern, and we book the profit when price action reached the previous significant high.
Trading The Bearish or Descending Triangle Pattern
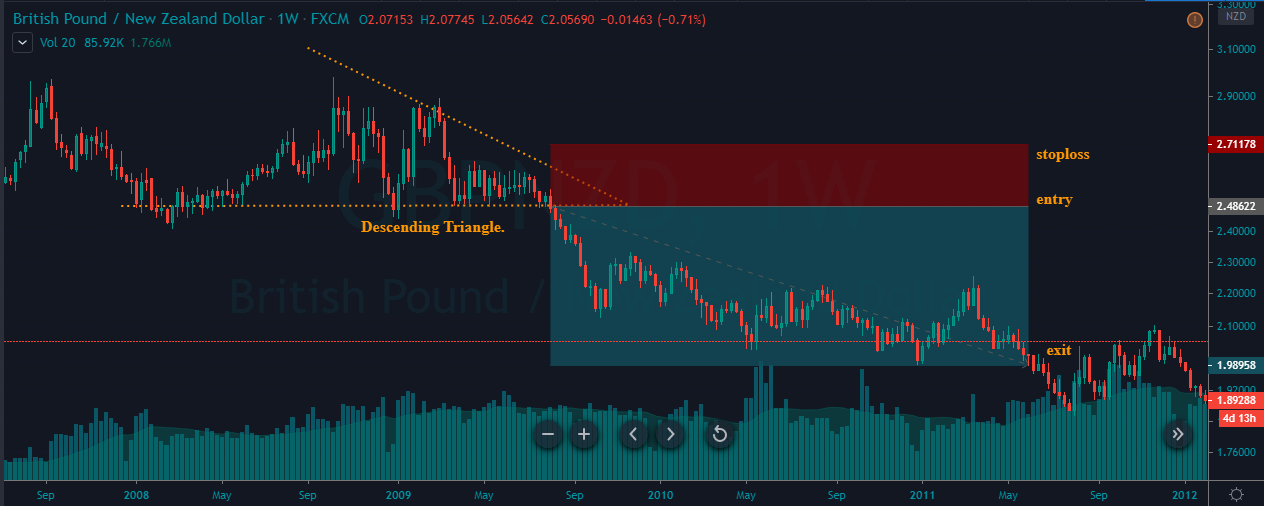
The below chart represents the formation of a Descending Triangle chart pattern in the GBP/NZD Forex pair.
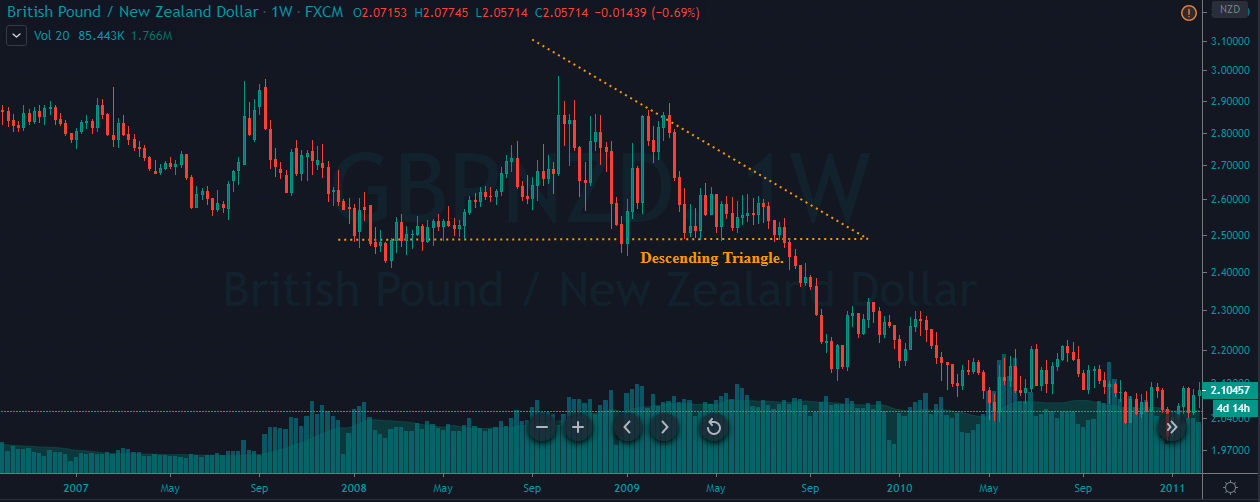
As we can see in the below chart, the pair was in an overall downtrend. When the price action reached a significant support area, the market started to move in a range. This range eventually has turned into a Descending Triangle chart pattern. As discussed, this pattern indicates that buyers and sellers are aggressive in taking the lead.
But the breakdown towards the sell side shows that the sellers have finally won the battle. We have placed the sell order right after the breakout, and stop-loss was placed just above the recent higher low. You can observe from the below chart that after going short, the price action started to move smoothly in our direction. We have closed our entire position when the price is started to struggle going down.
That’s about Ascending and Descending Triangle chart patterns. There are many strategies we can use to maximize profits while trading this pattern, and they can be found in the Basic Strategies section. All the best.
[wp_quiz id=”72812″]