Categories
Forex Basic Strategies

Pairing Stochastic With The ‘Double Bottom’ Forex Chart Pattern

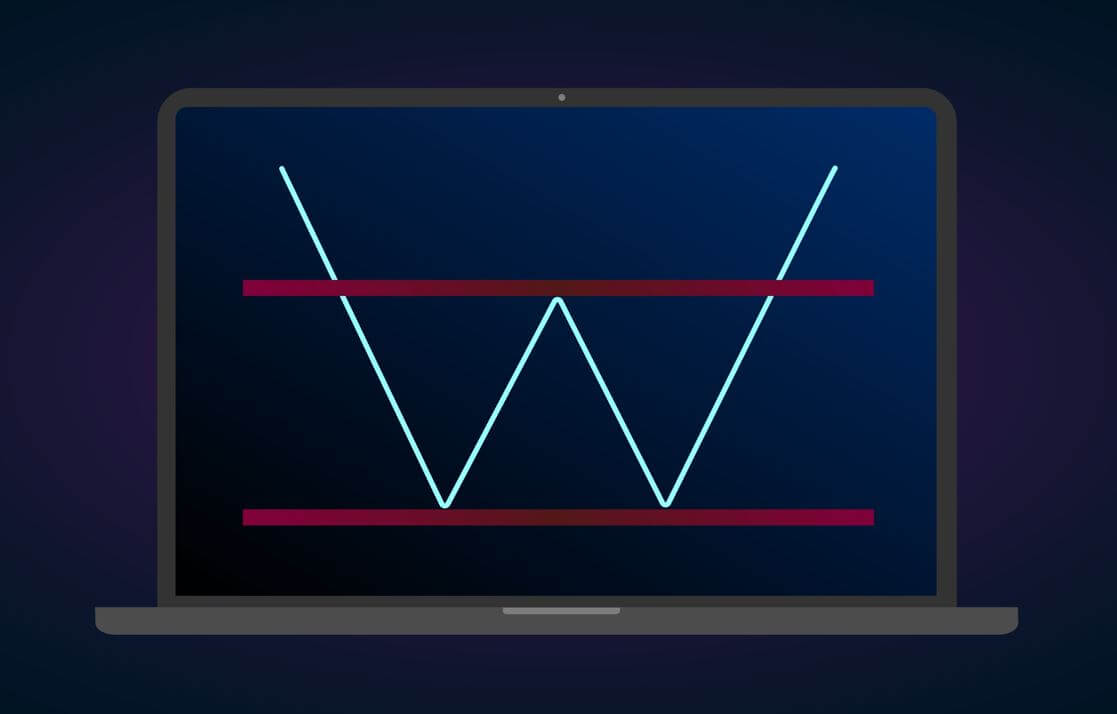
The double Bottom is a technical chart pattern, which helps to identify the change in the direction of the selling trend. The pattern looks like W in shape and it is quite a popular pattern among technical traders. In other words, double Bottom is a bullish reversal pattern. Most of the time double bottom reversals usually mark the long-term trend change in an instrument. In an ongoing downtrend, the price action drops to a floor, a significant support level before beginning the new uptrend. The pattern forms by two consecutive rounding bottoms with approx. Same heights. Most of the time, the momentum of the second Bottom is quite weak, which indicates that the weak selling momentum. Both of the round bottoms retrace until it finds the major resistance area that we call the Neckline. Overall, the pattern indicates that the professional traders, market movers booking the profits, and now the market are ready to print brand new higher high.

The image above represents the Double Bottom Chart Pattern on Price Chart.

Psychology Behind This Pattern

As by now you know that the double Bottom pattern occurs at the major support area, the pattern suggests that when the price action reaches the major support area, it means that the sellers are now afraid of the major support zone so they are booking their profits and as a result, the momentum of the market keeps dying. When price action prints the first Bottom, it indicates that some buyers try to buy; as a result, price action approaches the Neckline, and now at the Neckline, some sellers again try to hit the sell in order to print a brand new lower low. When price action reaches the major support area again, they failed to print a new lower low, and as a result, they booked the profit. Now the markets are entirely under the control of the buyers, and they are ready to print the brand new higher high.

Trading Strategies Using Double Bottom Pattern

Double Bottom Pattern + Bullish Candlestick Patterns

There are several bullish candlestick patterns that are widely used by technical traders in the market. You can use any bullish candlestick pattern to trade the market, some of the popular bullish candlestick patterns are Bullish Engulfing, Morning star, Gravestone Doji, Dragonfly Doji, Three white soldiers. These are widely used, and the most common candlestick patterns exist in the market.

The idea is to find out any bullish candlestick pattern at the second Bottom, when you find out any bullish pattern at the bottom area go long, put the stop loss below the support line, and the first take profit must be at the Neckline, second one should be double than the size of the pattern.

The below Image represents the double bottom pattern on the NZDUSD Forex pair.

As you can see in the below Image, the market prints the Double Bottom chart pattern, which indicates that the buying trade in this pair. Initially, when the price action approached the support area, at that time, the momentum of the downtrend was really weak, but after the first retracement to the Neckline, the sellers try hard to print brand new lower, but they failed to do it. When price action hits the Bottom second time, the market prints the bullish engulfing pattern, which indicates the buying trade in this pair.

The below Image represents our entry and exits in this forex pair. We took long when the market prints the bullish engulfing pattern, and the take profit was below the second Bottom, the major support line below acts as dynamic support to the price action. You can even go with a smaller stop loss because the line below is so strong that it stops the strong selling trend and even reverse it completely. So you can imagine how strong this line is. The take profit was at the Neckline, you can close your position at the Neckline, or you can hold it for the further target. It is advisable to book half of the profit at the Neckline.

Double Bottom Chart Pattern + Stochastic Indicator

In this strategy, we paired the Double Bottom pattern with the stochastic indicator to identify the trading signals. Stochastic is a quite popular oscillator that is developed by George C. Lane in the 1950s. Most of the traders think that just like other indicators, stochastic also follow the price and volume, but it is not true. In fact, stochastic follows the momentum and speed of price action. The stochastic indicator is used to identify the oversold and overbought buying conditions, and traders use overbought/oversold conditions to trade the market. The indicator also identifies the divergence, which helps the traders to identify the major market reversals.

The below Image represents the Double Bottom chart pattern on the Daily chart of the CADJPY forex pair.

The below Image represents our entry in this pair by using the stochastic indicator and double Bottom chart pattern.  As you can see that we took a long position when prices failed to go below the major support line. Most of the traders what they do is activate the buy trades when the price action hits the support line the second time. This is the wrong approach. Instead, let the price action holds and then activate your trade. As you can see, when prices hit the second Bottom at that time, crossover happened on the stochastic indicator, which indicates that the market is oversold and it is time to go long.

The below Image represents our entry and exits in this pair. We took long when the price action hits the second Bottom, also when the crossover happened on the stochastic indicator. Stop below the recent low, and the take profit was at the higher timeframe major resistance area.

Conclusion

The double Bottom is an extremely powerful chart pattern when it is interpreted correctly. If you interpret it incorrectly then it can damage your trading account. You can activate your trades when price action hits the second Bottom, or you can activate trades when price action crosses the Neckline and retests as support. It doesn’t matter where you activate your trade; both of the locations provide a good risk to reward ratio.

Categories
Forex Basic Strategies

Pro Scalping Technique By Combining Stochastic With Bollinger Bands

Introduction

Scalping is a trading strategy that helps traders to take advantage of minor price movements on lower timeframes. It is one of the quite popular ways of trading the Forex market. There are many successful scalpers who make a lot of money by scalping the minor price moves. To be a scalper, we must be emotionally intelligent and have the ability to make quick decisions.

Scalpers place anywhere from 0 to a few hundred trades in a single day. Ideally, smaller movements in price are easier to catch compared to the longer moves. Typically while day trading, if the win/loss ratio is less than 50 percent, traders still make money. On the other hand, in scalping, it is critical to win most of the trades. Otherwise, we will end up on the losing side.

Stochastic Oscillator

Stochastic is a wonderful indicator developed by George C. Lane in late 1950. This indicator doesn’t follow the price or volume like other popular indicators in the market.  Instead, it follows the speed and momentum of the changes that occur in price before the trend formation. Stochastic is a range bounded indicator, and it oscillates between the 0 and 100 levels.

Typically, a reading above 80-level is referred to as the overbought signal, and a reading below the 20-level indicates an oversold signal. The Stochastic indicator consists of two lines, where one reflects the actual value of the indicator for each session, and another reflects its three-day simple moving average. The intersection of these lines indicates the reversal in price action.

Bollinger Bands

Bollinger Bands is a technical indicator developed by John Bollinger in the 1980s. It is a leading indicator, and it consists of two bands and a centerline. Out of the two bands, one stays above the price action, and the other stays below. Both of these bands contract and expand depending on the market’s volatility. When price action hits the lower band, it indicates a buy trade, and when it hits the upper band, it indicates a sell trade.

The Strategy

The strategy we are going to discuss is one of the most basic but effective scalping strategies ever used in the market. The idea is to apply both indicators (Bollinger Band & Stochastic) on the price chart. When the price action hits the lower Bollinger band, and the Stochastic is at the oversold area, it is an indication for us to go long. Conversely, when the price action hits the upper Bollinger band and if the Stochastic is at the overbought area, we can go short.

In the chart below, we can see that our strategy has generated a few buy/sell signals in the EUR/AUD Forex pair. The price action was in an overall uptrend. When both of the indicators gave us the signal, we took both buy and sell entries accordingly. In the chart below, the buy trades have given us some good profits, but in the sell trades, the profit was comparatively less. Always remember that these things are quite common in scalping. If you are an aggressive scalper, trade both buy sell signals. But if you are a trader who prefers to scalp the market with the trend, follow the next strategy.

Scalping The Market By Following The Trend

Buy Example

The chart below represents an uptrend in the EUR/AUD Forex pair. As you can see, by following our strategy, this pair has given us three buy signals, and all the trades were quite healthy and have performed well in the market. If you scalp the market by following the trend, it is easy to make big gains. For scalping, it is required to put smaller stops. Hence, always go for 4 to 5 pip stop-loss and 10 to 15 pip target. You can also exit your positions when the price hits the upper Bollinger band.

Sell Example

The below 3-minute chart of the GBP/JPY forex pair represents a couple of sell trades. As you can see, all the sell trades in this pair performed very well. We can also observe that every time the price action prints a brand new lower low. We took all the five selling trades on a single trading day, an all of them hit the take-profit range. So if we scalp the market by following the trend, it will be quite easy to make some profits from the market. The red arrows on the Stochastic and Bollinger Band indicators represent the sell signals.

Scalping The Ranges

Just like the trends, it is easy to scalp the ranges as well. In fact, the ranges are even easier to scalp than the trend because the support and resistance lines of the range offer extra signals for us. For ranges, all you need to do is to hit the sell when price action hits the top of the range and hit buy when prices hit the range bottom. If you add the Bollinger Bands and Stochastic indicator, the signals generated by the market will be stronger.

The chart below indicates a couple of buy/sell signals in the GBP/JPY 3-minute Forex chart. As you can see, we have gone long when prices hit the bottom of the range, combined with our strategy. The same applies to the sell-side. We have gone short when the price action hits the top of the range while respecting our strategy rules.

Conclusion

Scalping trading involves entering a trade for a shorter period of time to take advantage of small price fluctuations. When you enter a trade, it is advisable to risk lesser money and place as many trades as you can. We must have control over our inner greed and aim for smaller targets. In the beginning, it will be difficult for you to scalp the market as the smaller timeframes move way faster. You need to train your eyes a bit to understand the lower timeframes properly. Always try to scalp with a bigger trading account because the trading commissions can quickly eat up the smaller accounts.

Categories
Forex Videos

Is The Stochastic Oscillator The Key To Making Money In Forex Or Is It Loosing You Money?

-Stochastic Oscillator, Friend or Foe ?


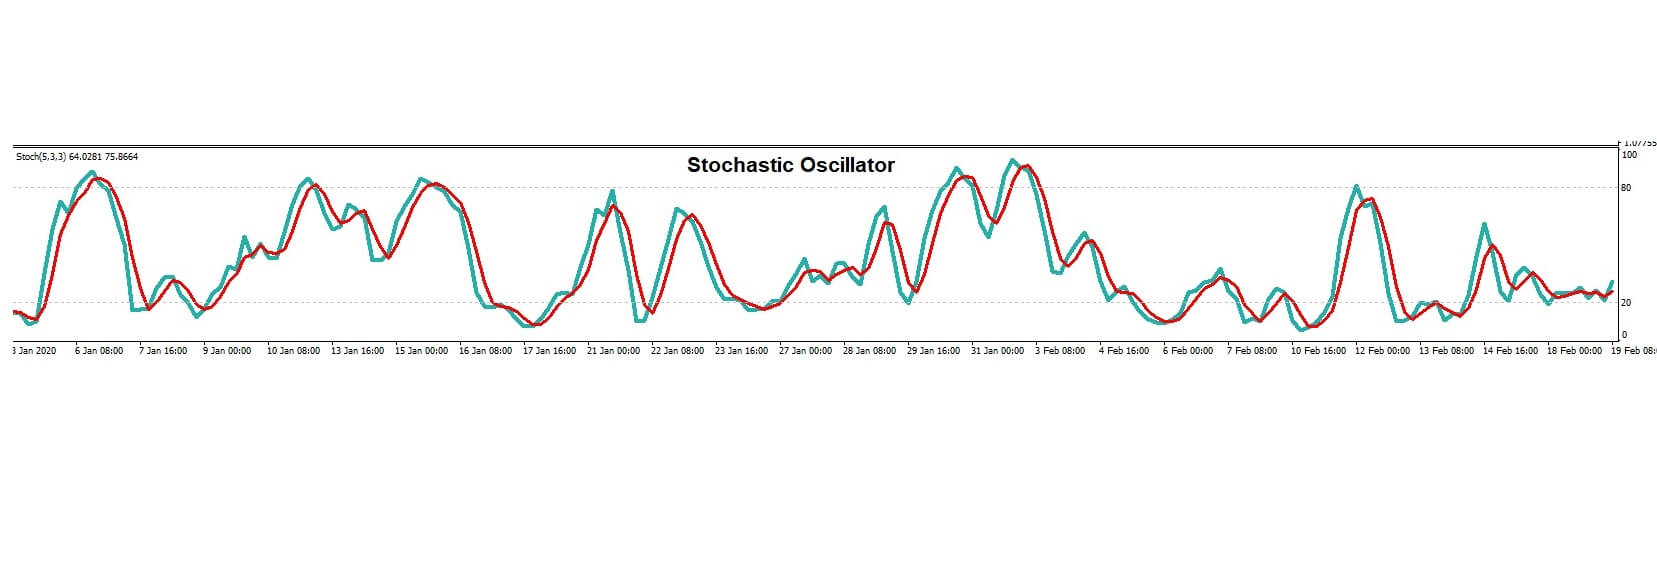
Insert A, The stochastic oscillator is used in technical analysis and was invented by George Lane in the late 1950s. The indicator measures the opening price of a financially traded asset and compares it to the closing price over a predetermined period of time. Because the data uses historical calculations and plots them in the form of two moving averages, the k-line, and the D-line, this is considered to be a lagging momentum indicator. The actual mathematical complications for the tool are very complex, and we will not be going into them in this session. The basic and generally widely used settings for the stochastic oscillator will automatically be set by your broker at 5 3 3. More experienced Traders are able to adjust the settings to their preference. However, we will be leaving them at the standard settings, and that way, we will be very much going with the crowd as it were in this example.


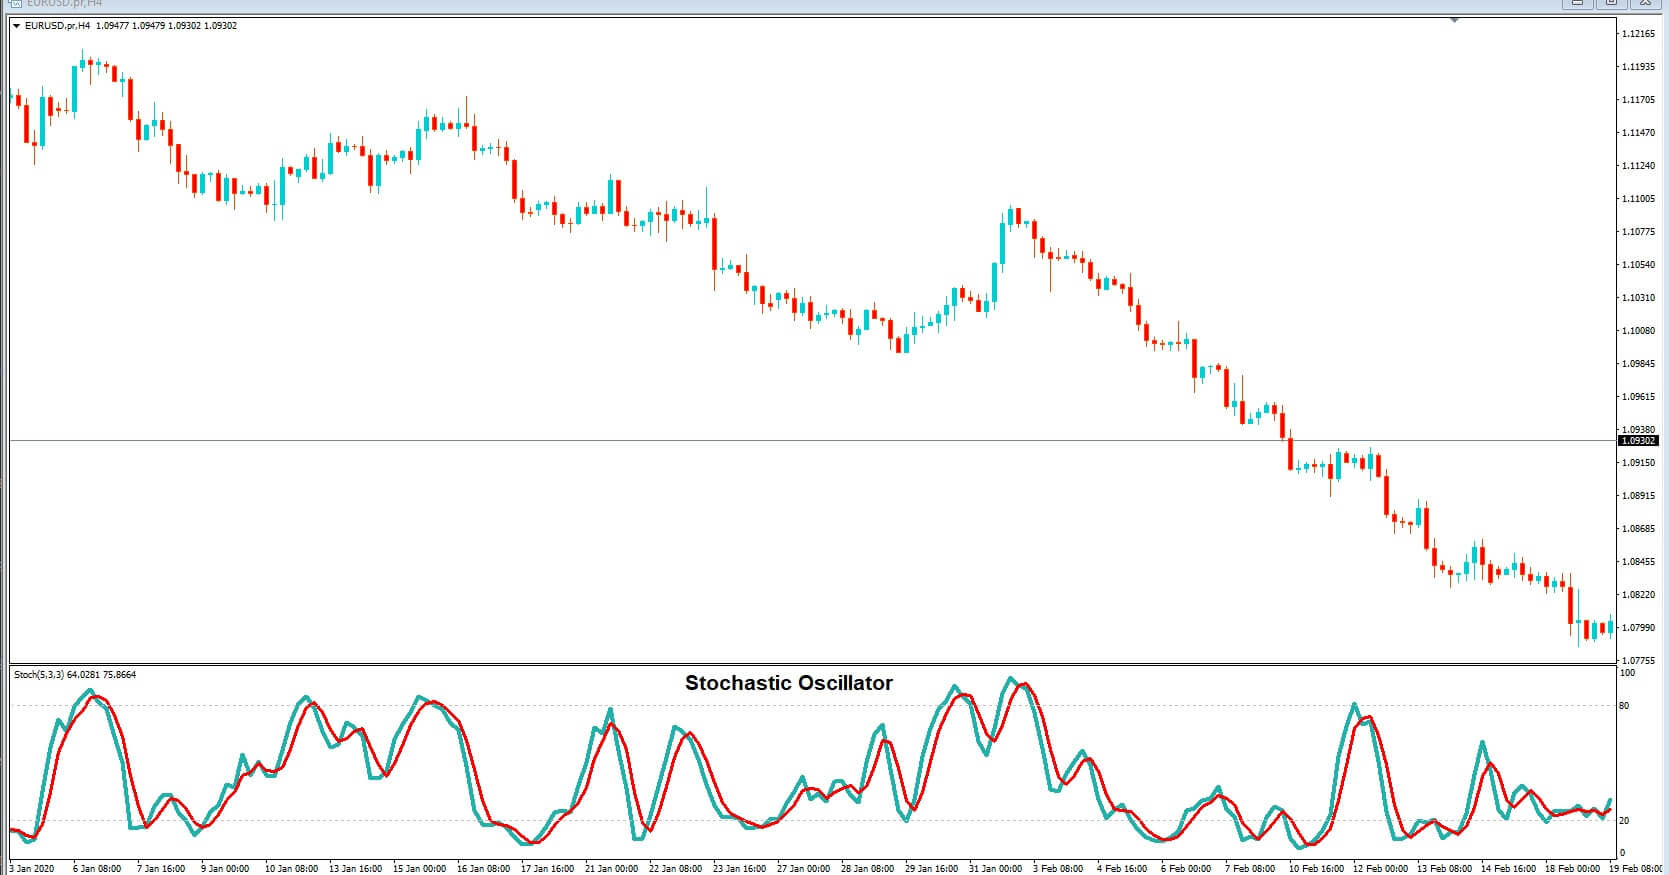
Insert B, The stochastic oscillator is widely used by professional traders and will be offered on almost every trading platform. It can simply be dragged straight onto your trading chart and will sit at the bottom, as in our example.


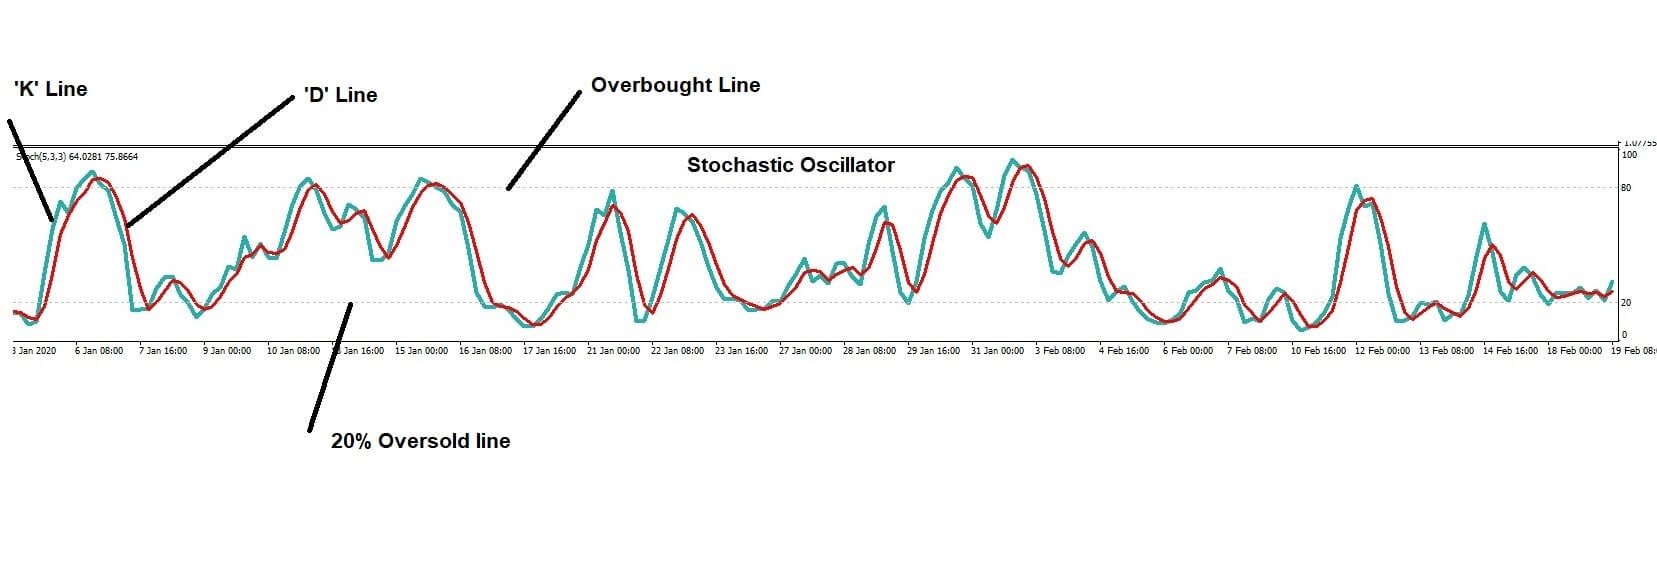
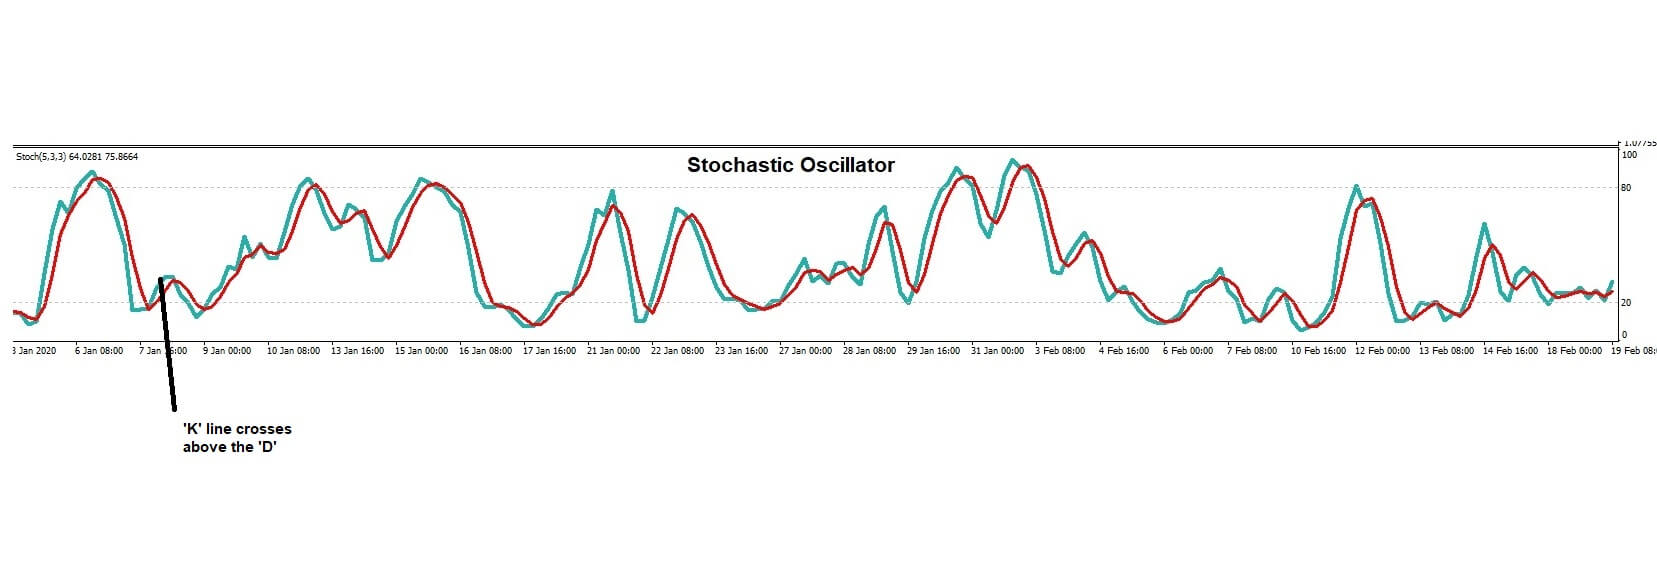
Insert C: The basic principle is that the Kline which is calculated over a slightly longer time period than the D line and when both of these lines are above the 80% Overbought line, the currency pair is considered to be overbought, and when the K and D lines are below the 20 % oversold line, the pair is said to be oversold.


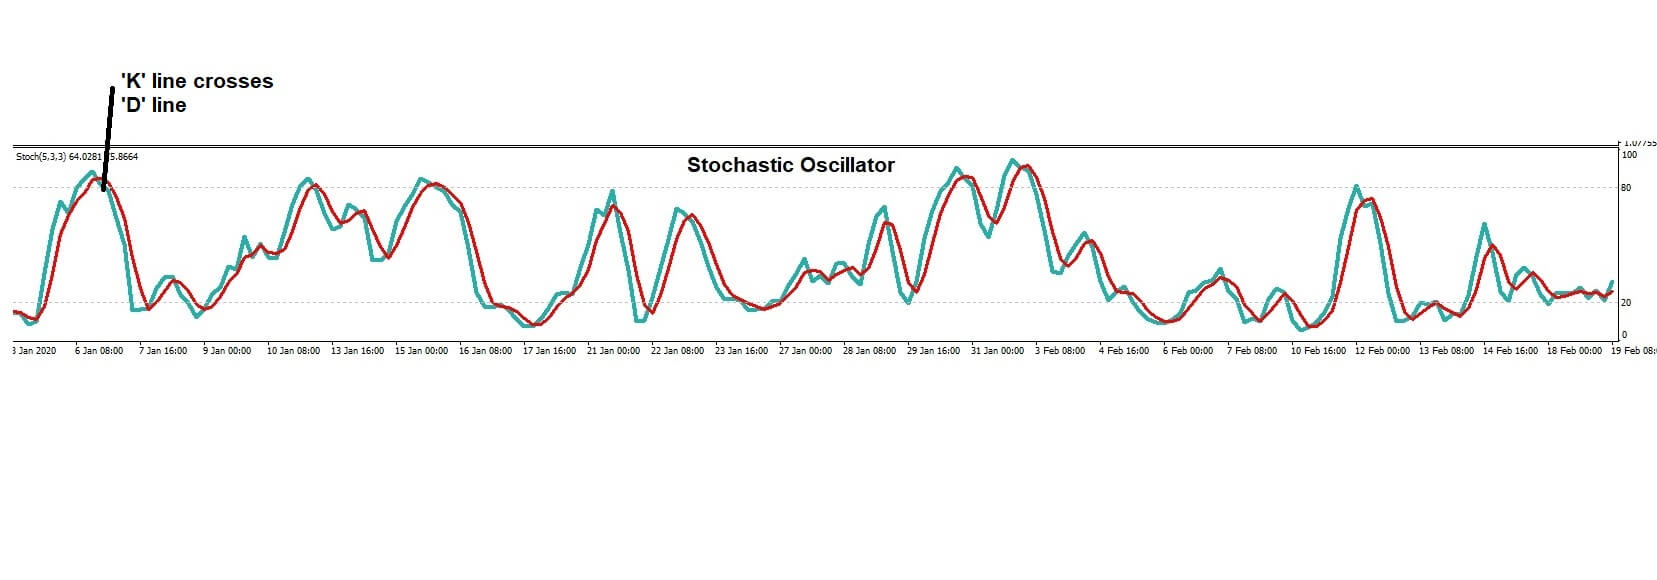
Insert D, traders look for the ‘k’ and D lines to have been above the 80% line in the overbought area and then dipped below the 80% line where the K-line has crossed over the d line, at which point they will go short on the currency pair.


Insert E, Conversely, traders look for the K and D lines to have been below the 20% oversold line, and where the K-line has crossed above the D-line, they use this as a signal to buy a currency pair.
One of the biggest areas that new Traders falling into a trap is that they take the stochastic signal has been gospel and trade it accordingly and then wonder why they are losing money.
And so, is the stochastic indicator a friend or foe? First, we have to remember that all indicators, and especially lagging indicators, are just that: indicators. They are an indication that the market, in this example, might be overbought and ready to turn lower, or that the market is oversold and it might be ready to move higher.
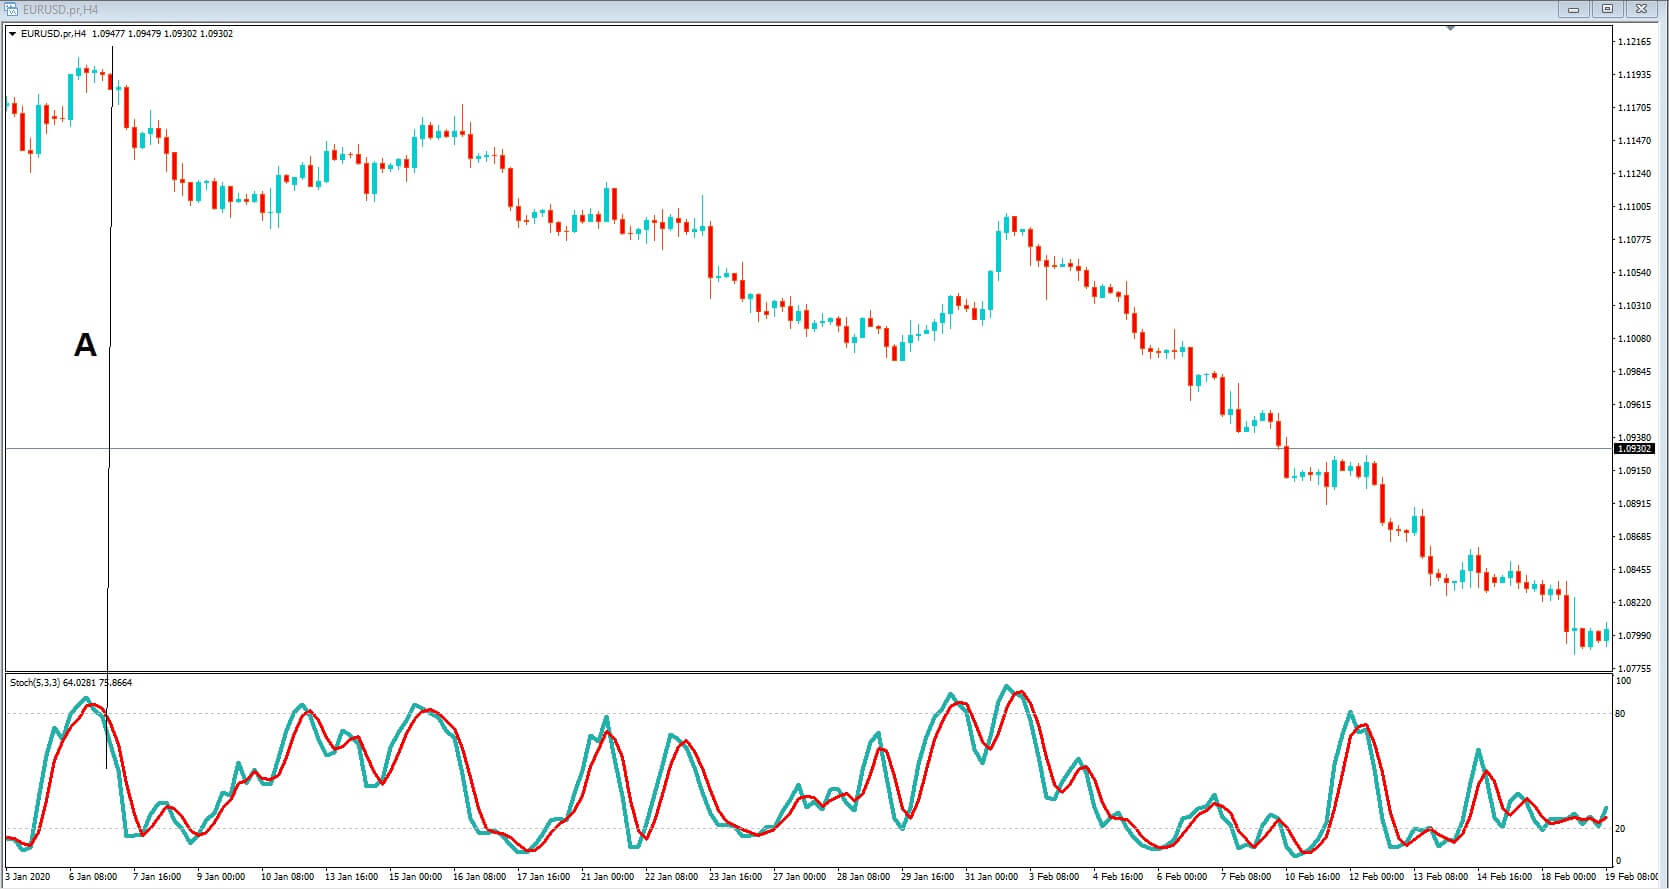
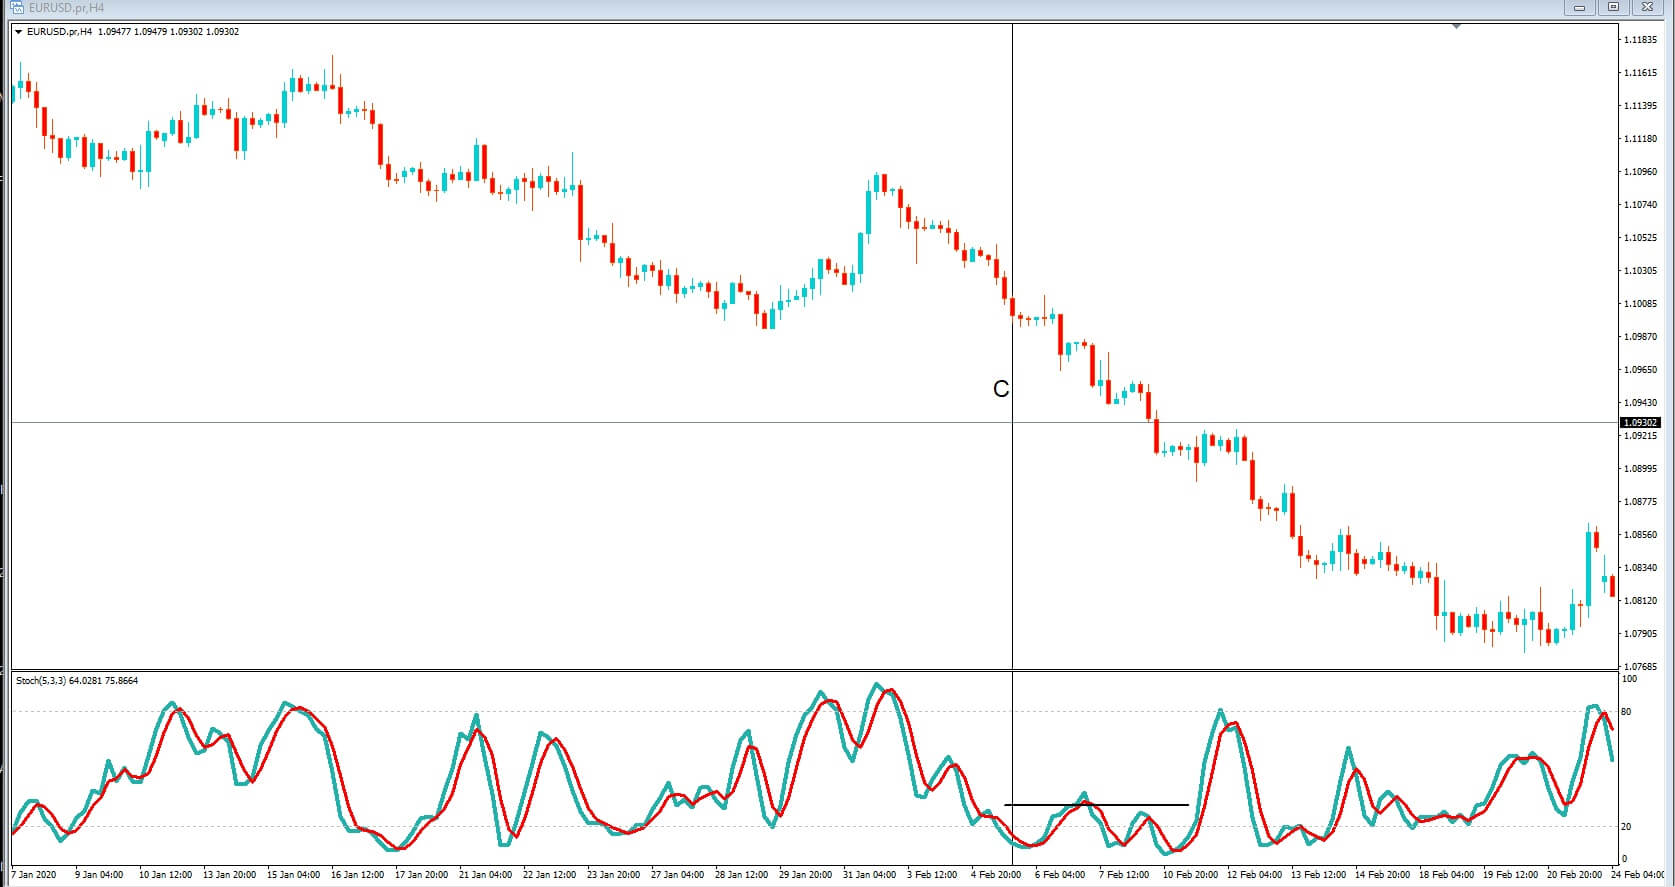
Let’s drill down a little bit more by going back to our 4-hour chart of the EURUSD pair. The longer the time frame, the more likely, the longer trend will become apparent, and that’s where the more pips will be realized, and of course, that translates into more money-making opportunities.


Insert F: By drawing a vertical line at position A, we can follow that down and see that the stochastic k and D lines have both moved above the 80% overbought area, and that’s the k-line has crossed below the d line, and both lines have moved below the 80% overbought line. This is represented by the price action which has been falling.


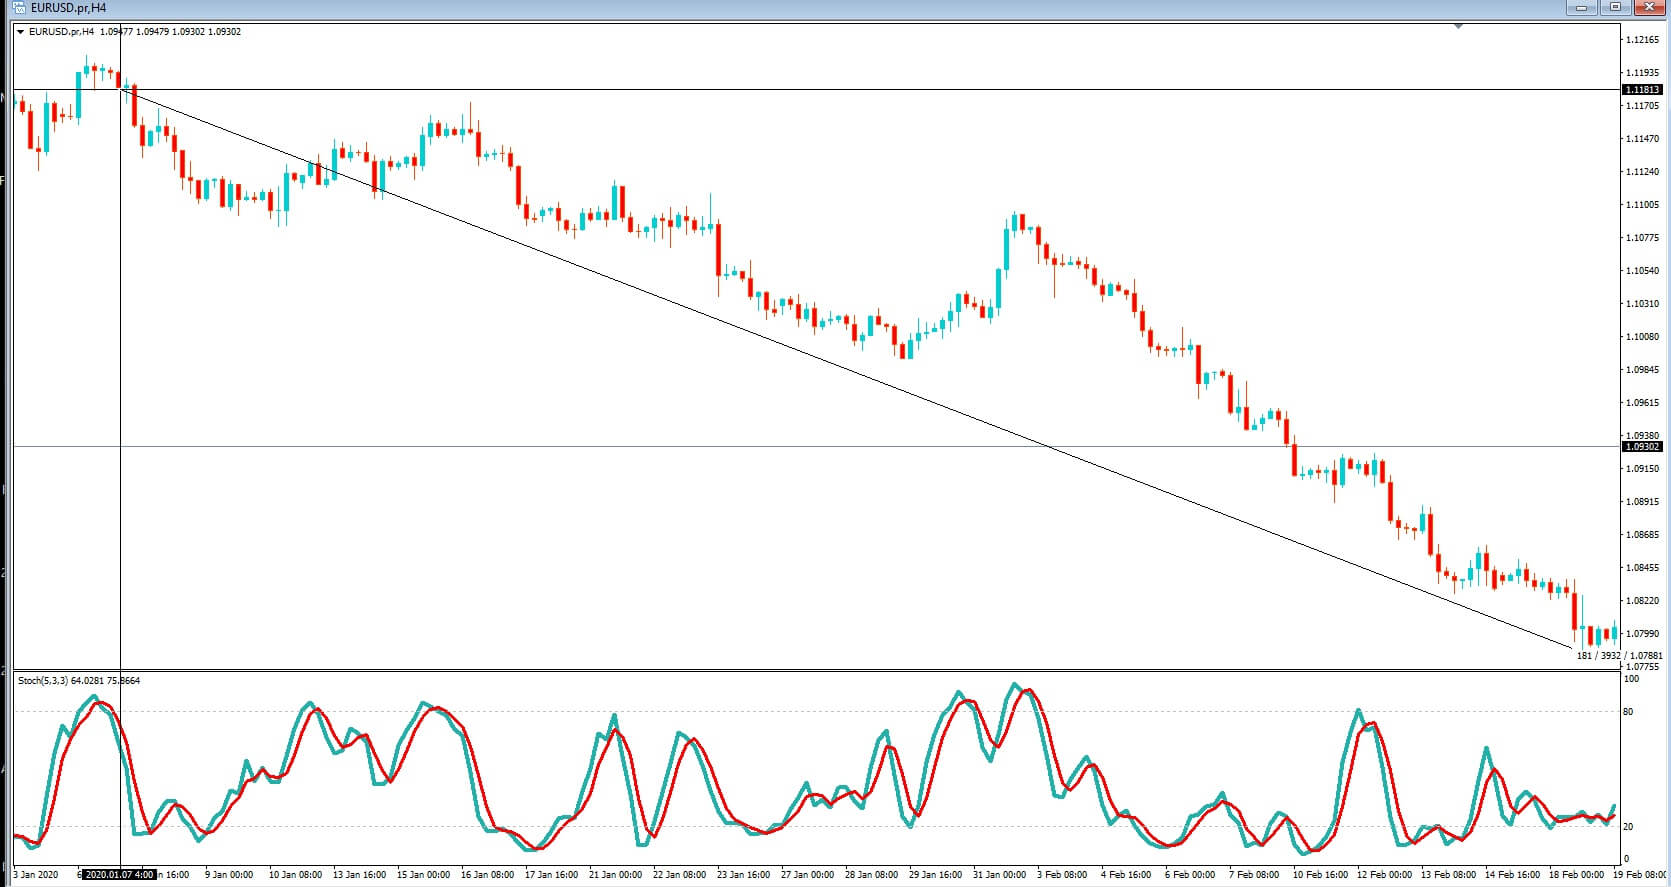
Insert G: Traders who sold the pair on this signal and stayed in the trade would have seen an overall pip movement in their favor of 390 pips, which is huge. The stochastic was a true friend at this point.


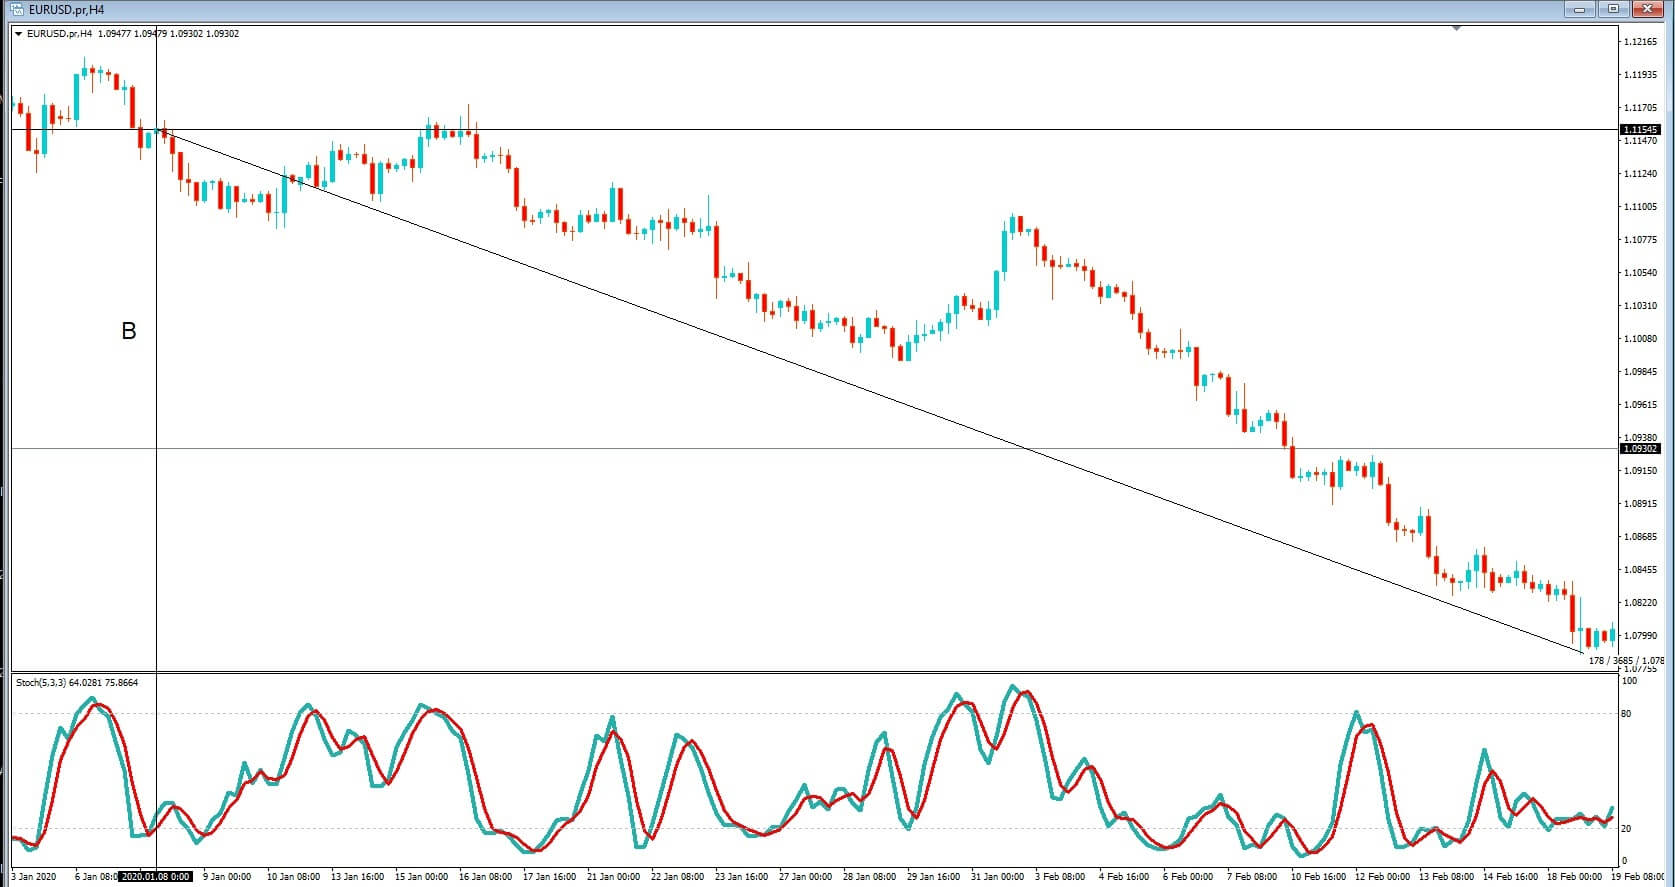
Insert H, However traders who abandoned the trade as soon as the stochastic became oversold, as per the example on your screen now at position B, because the K & D lines in the oversold area under the 20% line and where the k-line has crossed above the d line, they would have been extremely disappointed as the market continued to trend lower. While they would have made around 40 pips, they would have lost out on 350.
But one of the biggest problems we find with new traders is that they will buy a currency pair in a situation like this, where their trade goes immediately against them and falls
hitting them with losses of over 350 pics on this occasion because they have not supported their trade with a stop loss, due to poor risk management. In this example, the stochastic indicator would have been a foe.


Insert I, Let’s return to our chart at position C, we can see that the stochastic is oversold, and more importantly, it is staying or remaining very close to the oversold 20% line as the market trends for lower.
And so the lesson here is that if the market is overbought, it does not necessarily mean that it will automatically fall, and which is clear from how example today if a pear is oversold, it does not necessarily mean that they will turn around and move higher.
So remember indicators are simply an indication that something might happen and not that it definitely will happen. Incorporate good risk management and money protecting tools such as stop losses in your trading plan. Learn to use price action as the definitive trendsetter, while incorporating other technical indicators to more reliably established entry points for your trades. And what is most important, which I’m sure you’ve heard many times, is to let the trend be your friend and I never trade against it.

Categories
Forex Course

86. Learning To Trade Using The Dependable ‘Stochastic Oscillator’

Introduction

Stochastic is a momentum indicator that was developed in the late 1950s by ‘George Lane.’ This indicator does not follow the volume or price of the underlying instrument; instead, it measures the speed and momentum of the price action. As a result, the indicator changes its direction before the price itself. This makes the Stochastic a leading indicator in the market.
We can change the sensitivity of this indicator to the market movement by adjusting the settings. Stochastic is a bounded indicator which oscillates between the 0 to 100 level. When the indicator reaches the 70-level, it indicates the overbought markets, and when it goes below the 30-level, we can assume that the market is in an oversold condition. The bullish and bearish divergences on the Stochastic indicator help us in anticipating the upcoming price reversals.

Trading Strategies Using The Stochastic Oscillator

Oversold & Oversold Areas

This is the basic yet powerful Stochastic strategy that is widely used by most of the traders. The idea is to go long when the indicator reverses at the oversold area and go short when it reverses at the overbought area. Let’s understand this with an example.

The image below is an NZD/CAD Forex price chart. It represents two buying and one selling opportunity in an uptrend. These trades are solely taken based on the strategy that we discussed above.

We have placed the stop-loss just below the recent candle and close our position when the market gave an opposite signal. The market circumstances don’t matter as this indicator can be used in any situation. The crucial thing is to follow the rules of the indicator very well.

If the indicator generates a buy signal, only take buy entries, and when it says sell, only consider selling opportunities. If we are in a buy trade and if the indicator represents a sell trade, that is the time to close our position. Never be rigid and ignore the indicator signals to hold the position for extended targets. If that happens, we will be on the losing side.

Stochastic Indicator + Bollinger Bands

Bollinger band is a leading indicator, and it consists of two bands, which are above and below the price action. This indicator also has the centerline, which is a Moving Average. The bands of the indicator expand and contracts according to market volatility. They expand if the volatility is more and contract when the volatility is less.

Buy Example

First of all, find an uptrend in any Forex pair. When the price action hits the lower Bollinger Band, see if the Stochastic indicates the oversold market condition. If it does, it means that the sellers now have a hard time to go lower and taking buy entries from here will be a good idea.

As you can see in the below image, the EUR/AUD was in an uptrend. During the pullback phase, the Stochastic reaches the oversold area, and the price action hits the lower Bollinger Band. This is an indication to go long in this pair. As we have activated our trade, the price action blasts to the north. We can close our position when the Stochastic indicator reaches the overbought area. If you want to ride longer moves in the trending market, exit your position at the major resistance area.

Sell Example

First of all, find a downtrend in any Forex pair. When the price action hits the upper Bollinger Band, see if the Stochastic is indicating overbought market conditions. If it does, it means that the buyers now have a hard time to go higher and taking sell entries from here will be a good idea.

The image below is the EUR/CHF Forex pair, and the pair was in an overall downtrend. During the pullback phase, the price action turned sideways. But when the price action hits the upper Bollinger Band and the Stochastic indicator reverses at the overbought area, it is a sign to go short in this pair.

We can place the stop-loss just above the upper Bollinger band, and the take-profit must be at the higher timeframe’s support area. If you are an intraday trader, close your positions when both the indicators give an opposite signal.

That’s about Stochastic indicator and related trading strategies. If you have any doubts, let us know in the comments below. Cheers.

[wp_quiz id=”67442″]