Abstract
In this article, we deal with the different ways and aspects of the stop-loss setting. A crucial task for a successful trader.
Introduction
What a price to pay for bad wisdom? Too young to know too much too soon… (Suzanne Vega)
The decision where to cut losses if a trade is not working should be part of the trade selection process for every trade, and should be assessed in connection to the potential profit; so the risk to reward should comply with our trading rules.
One key example of the need for cutting losses short (in other words having high reward to risk trades) was given by trader Glen Ring when interviewed by Bruce Babcock (The Four Cardinal Principles of Trading).
He had a month when he made eight trades, with seven winners and one loser, but the net result was a losing month, just because of a single big loss.
The opposite may hold: you might experience eight trades with seven losers and still be profitable just because your system’s mean reward-to-risk ratio is excellent and that winning trade erased the losses of the seven losers.
The key lesson is: Although psychologically, we need to be right, we must focus on a reward-to-risk ratio, not in the frequency of our gains.
In Glen’s words: “Having those small losses is what keep us in the game, keeps your position for when you do catch a trend or big move. But, it’s a law of numbers to me. If we can make enough controlled-loss trades, even a blind squirrel is going to find a nut once in a while.”
The Stop-Loss Concept
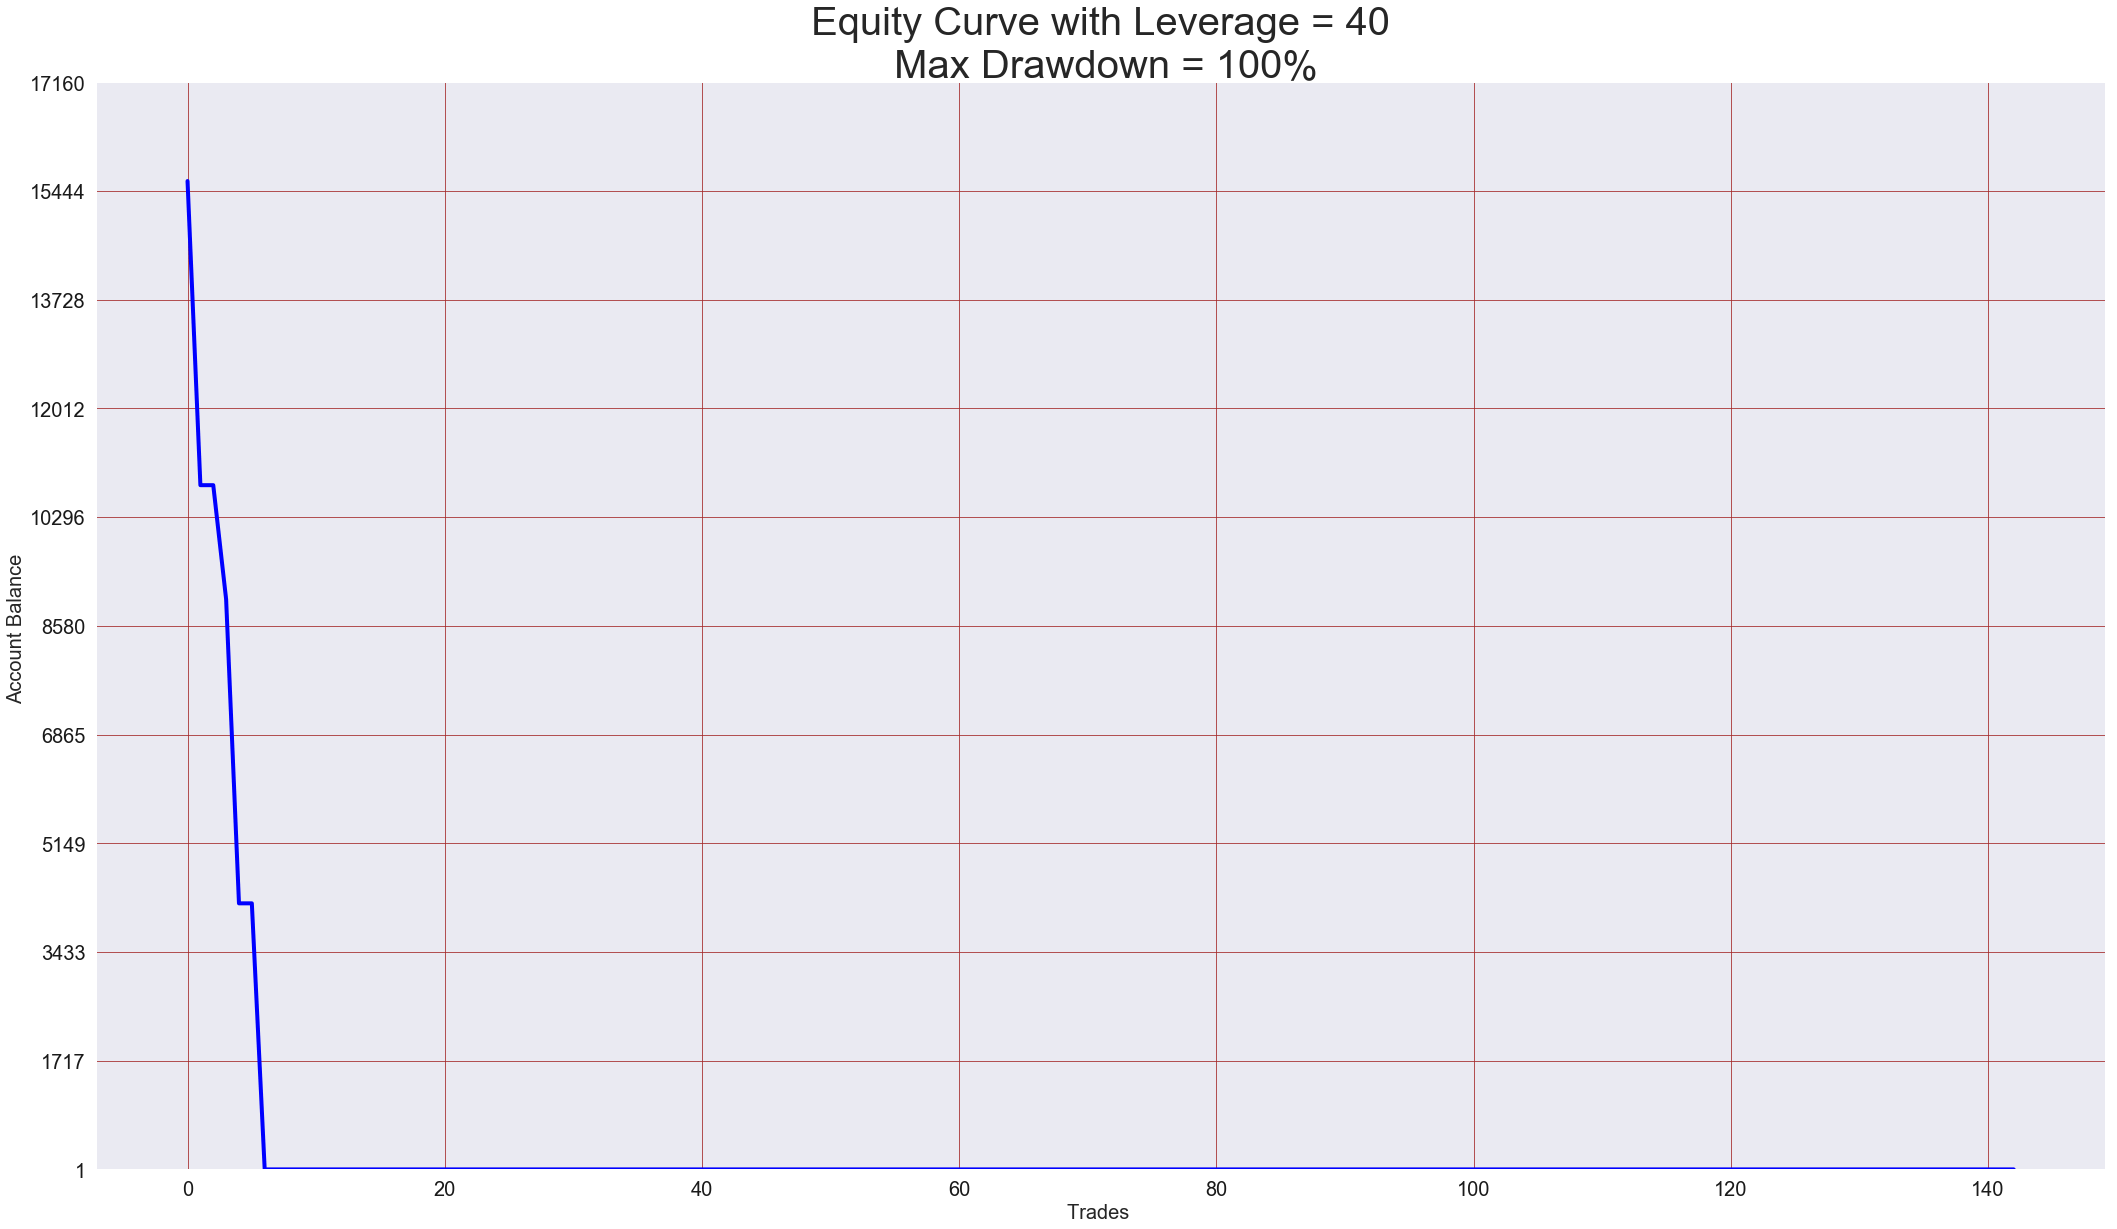
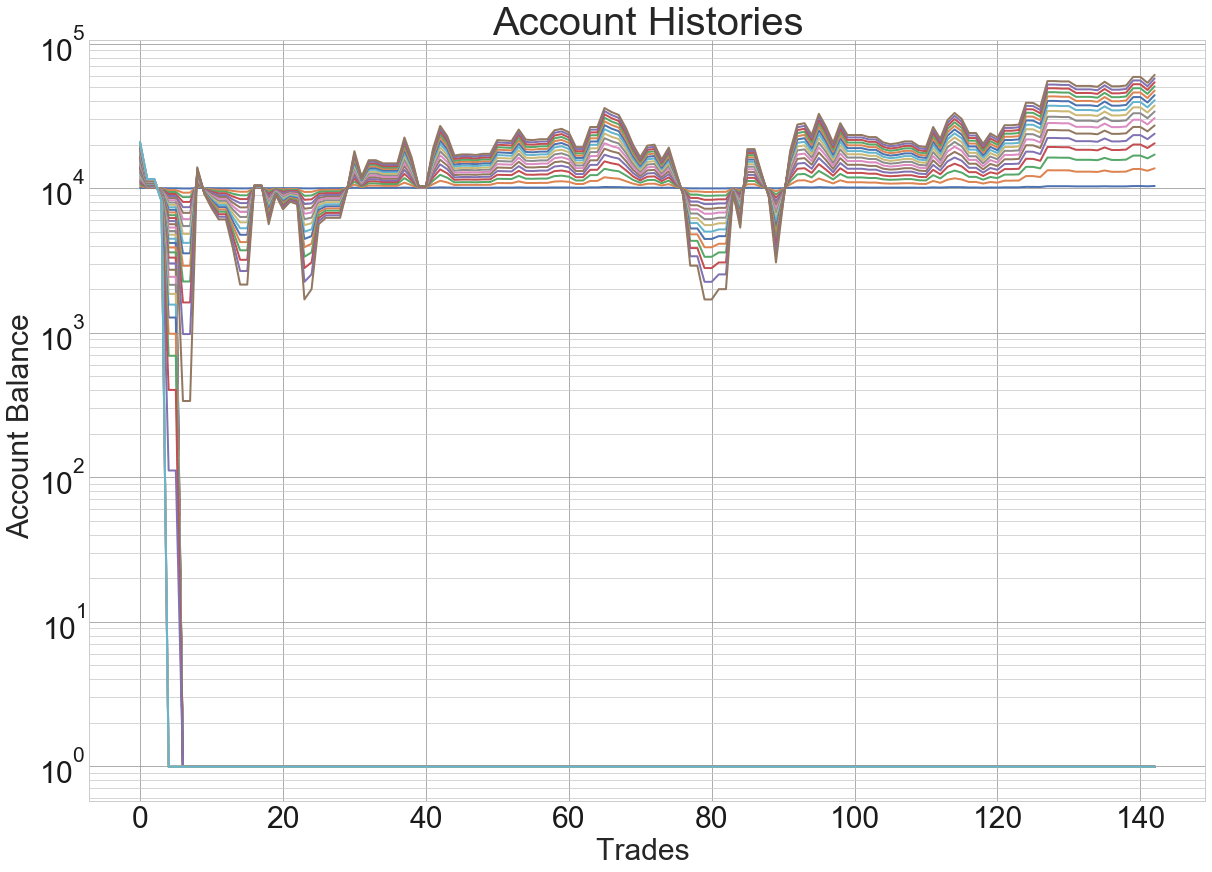
The stop-loss concept is related to position size. Trend following’s main idea is to catch the big trend. Its rate of success is reduced -below 35%-, but with potential big reward to risk ratios.
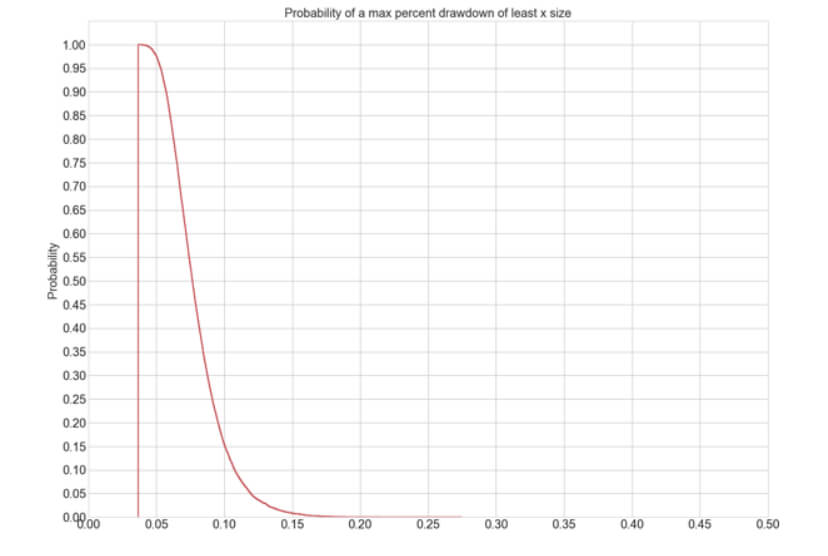
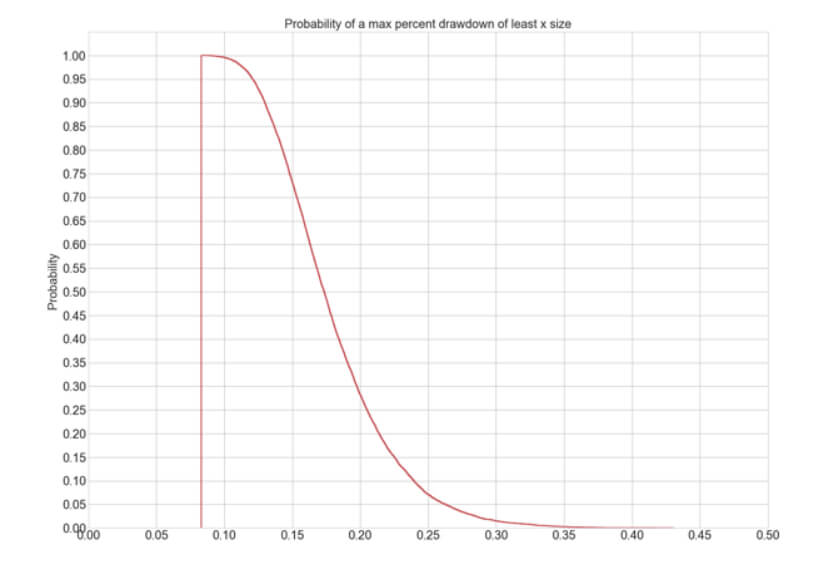
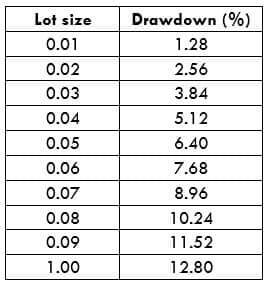
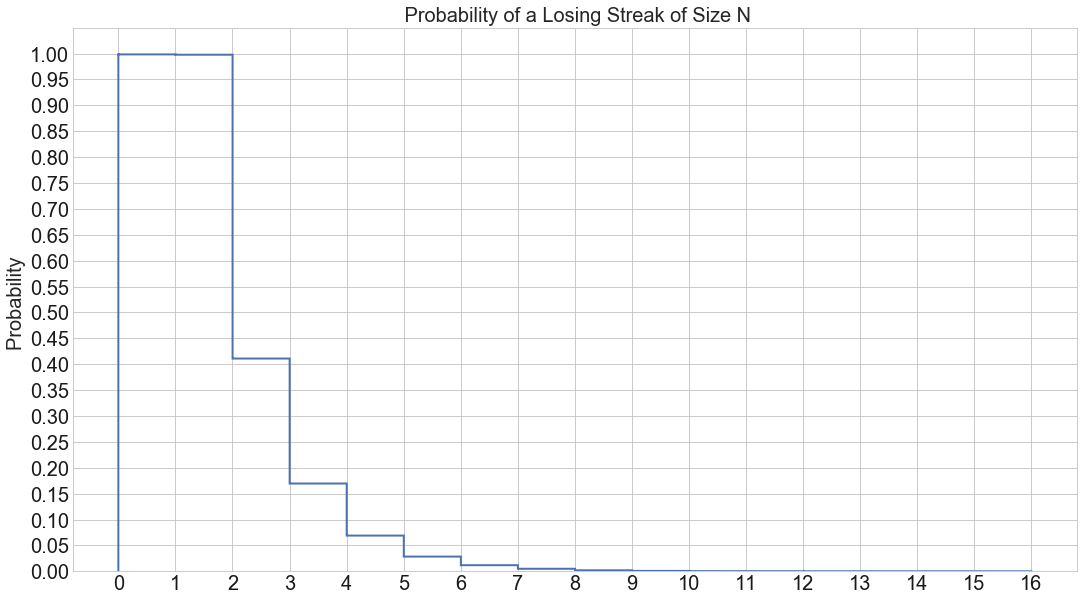
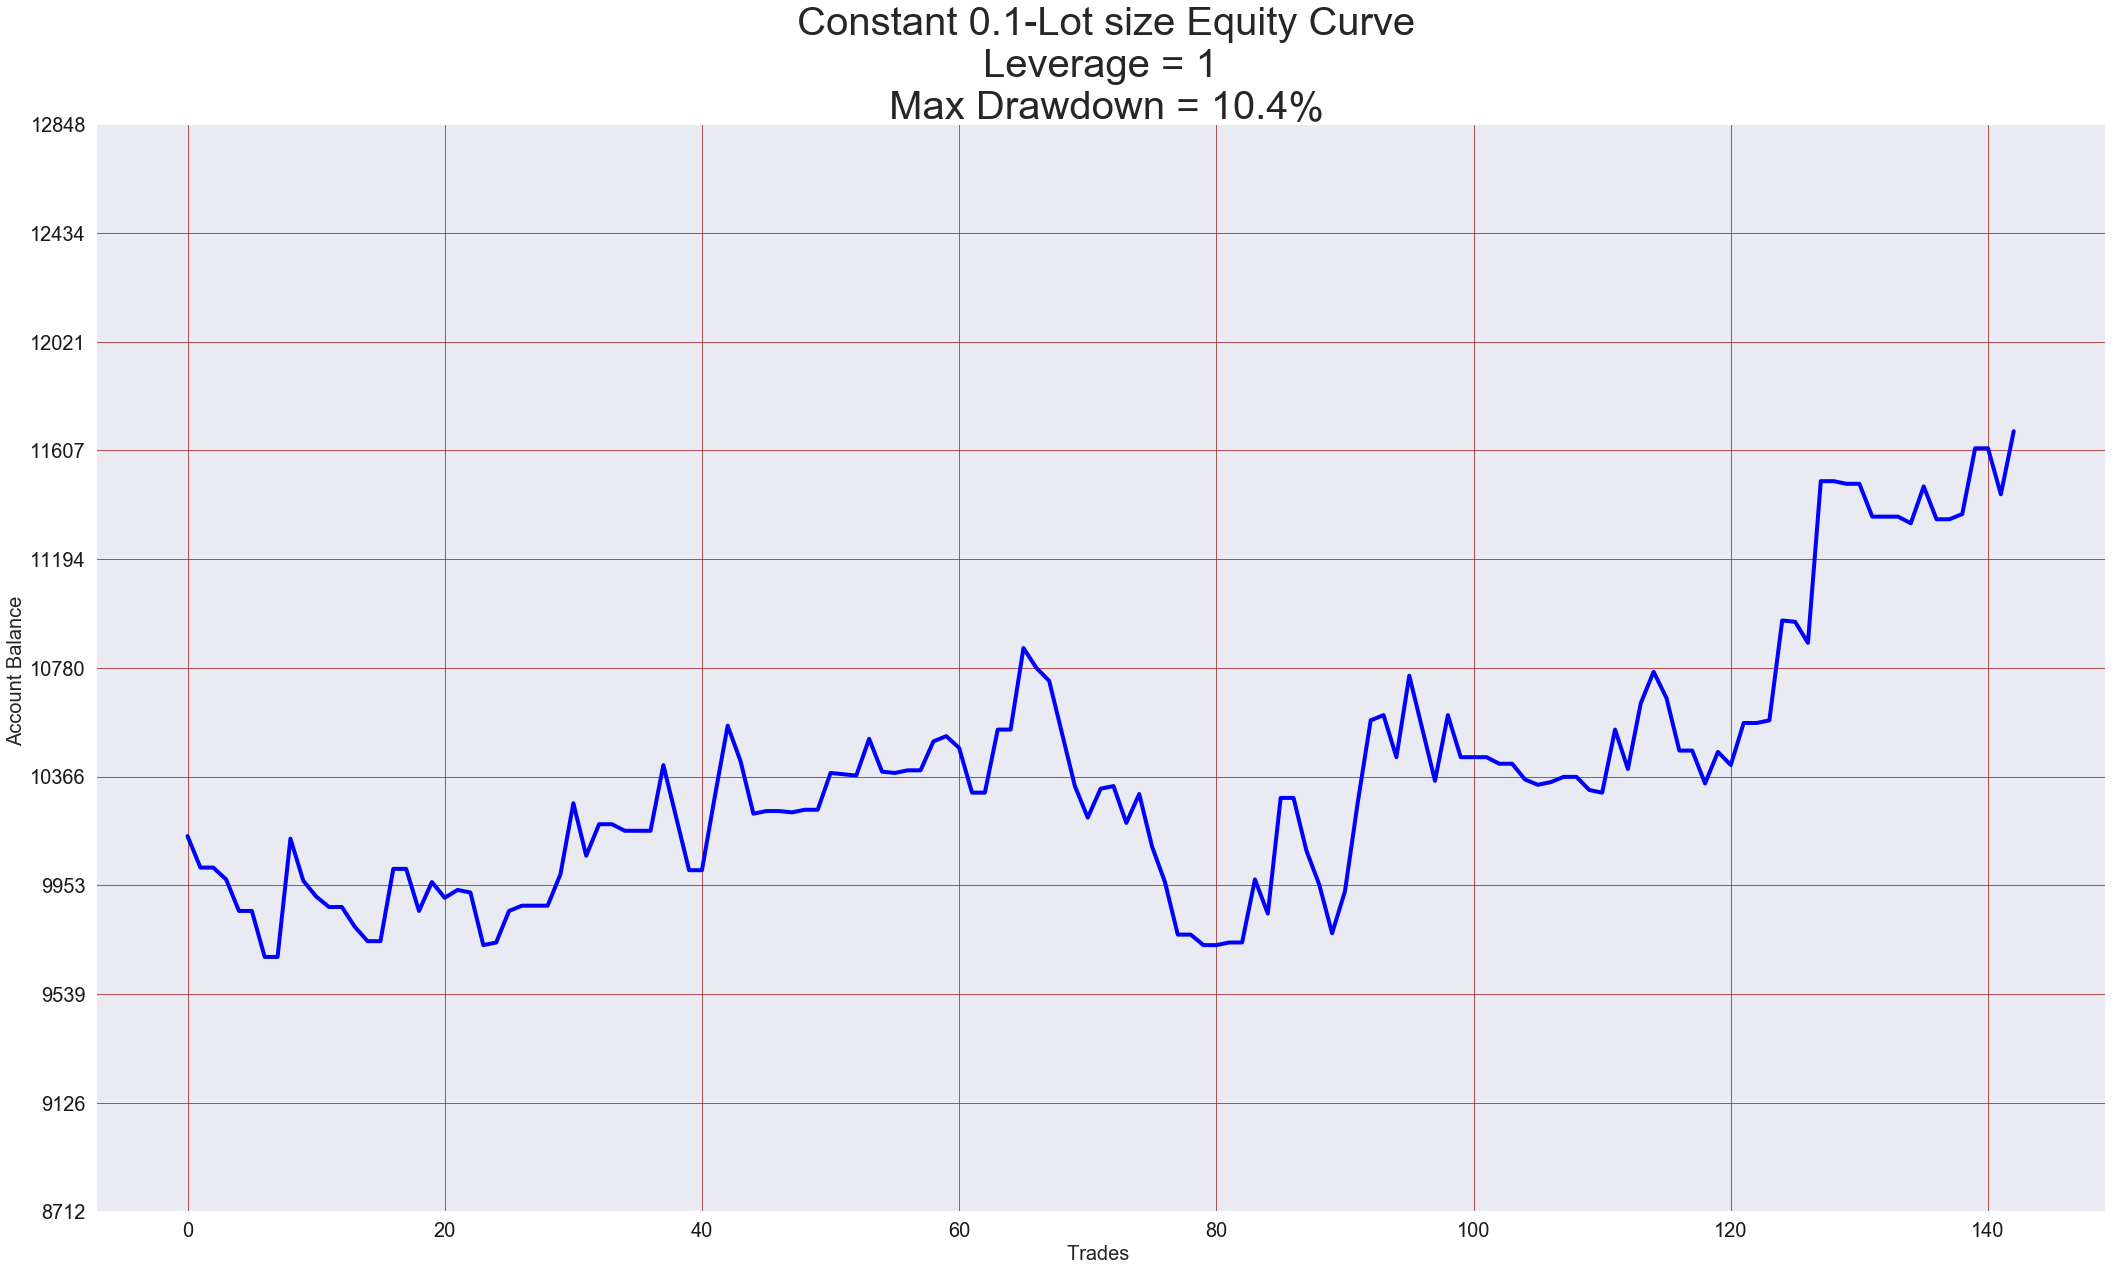
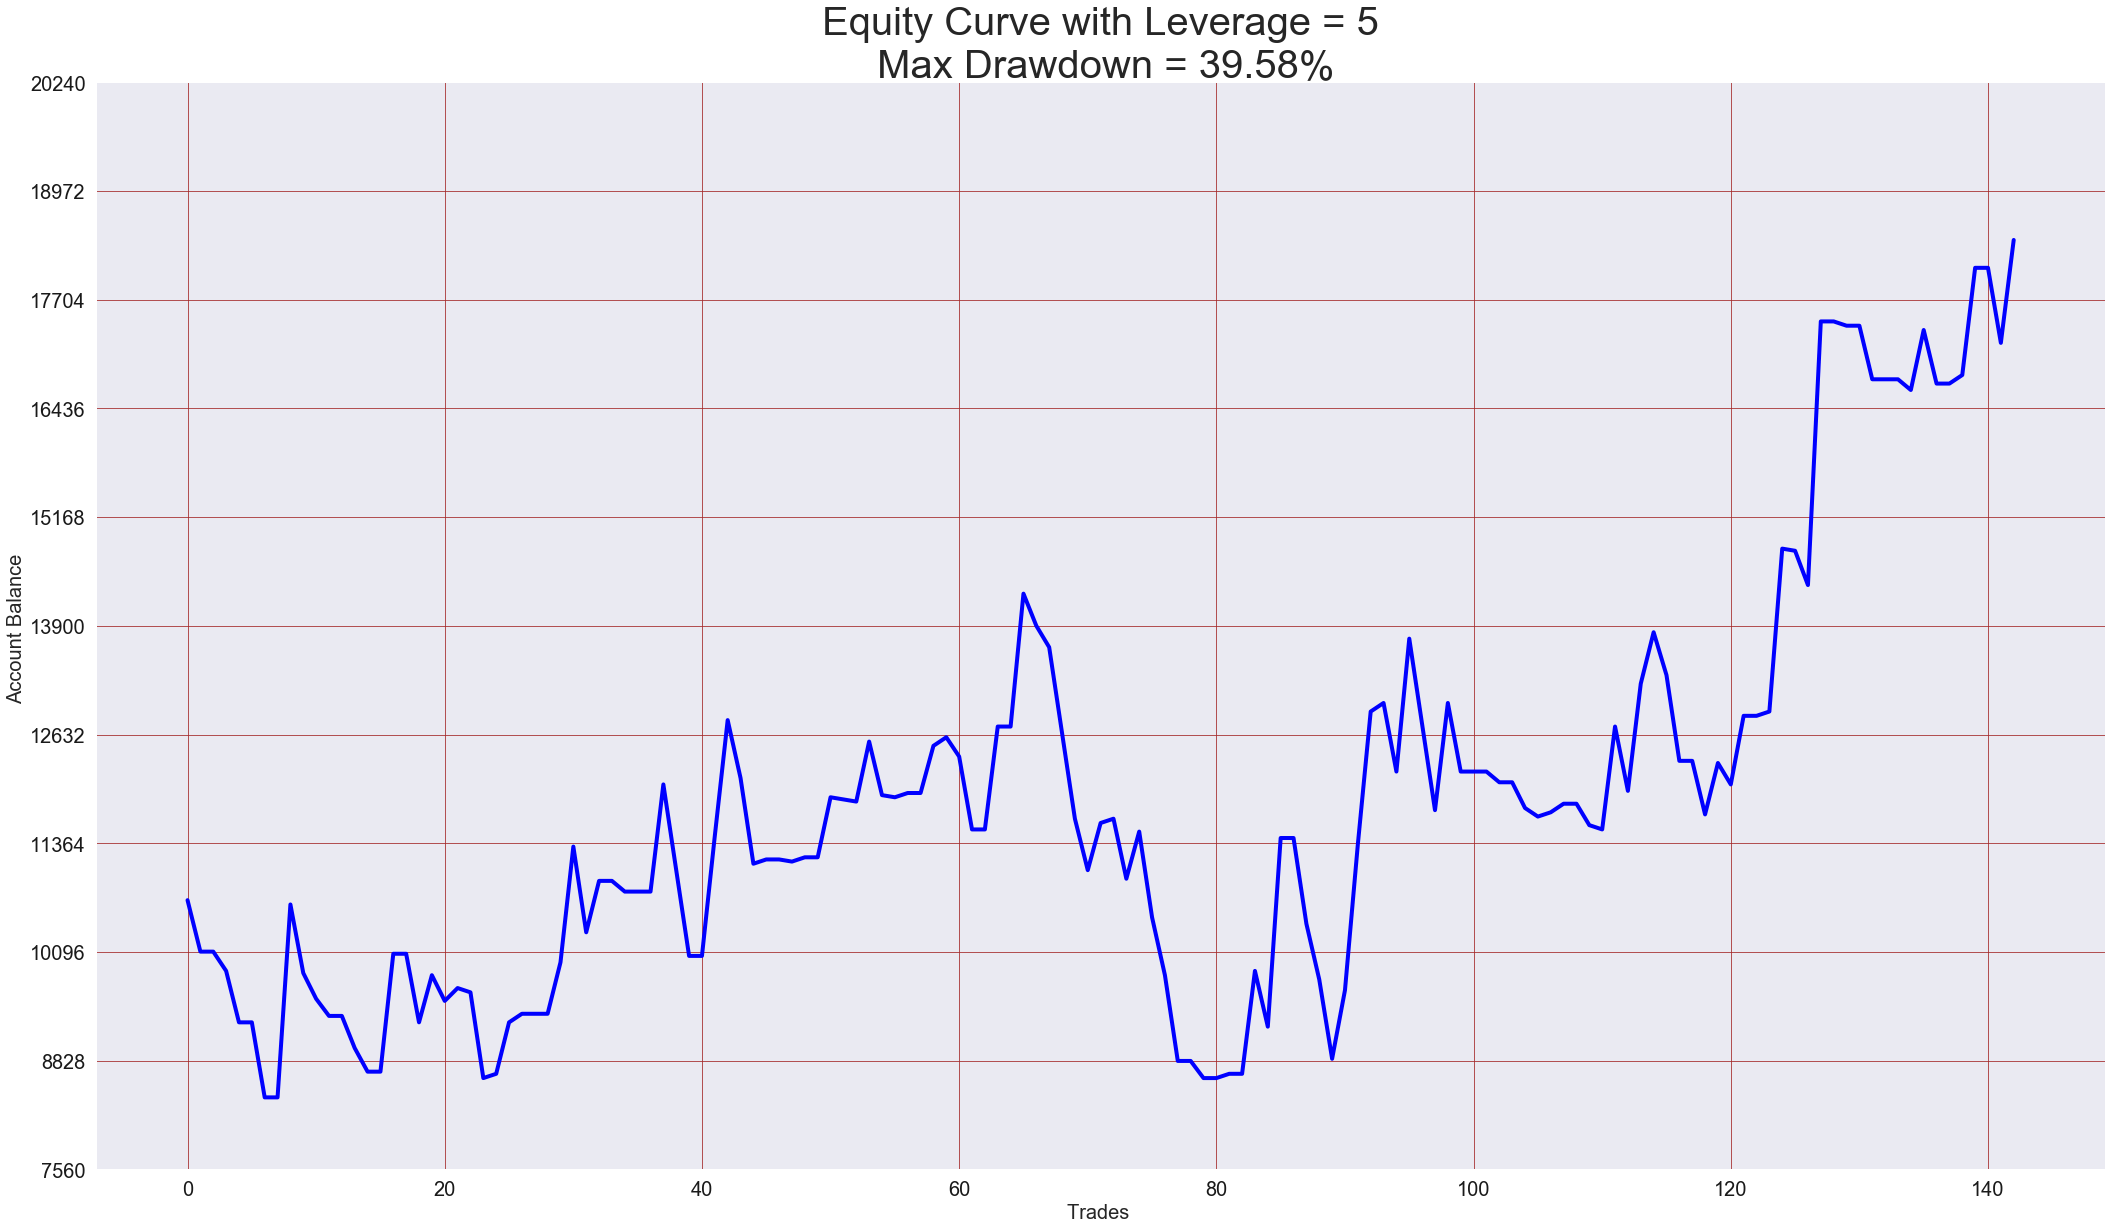
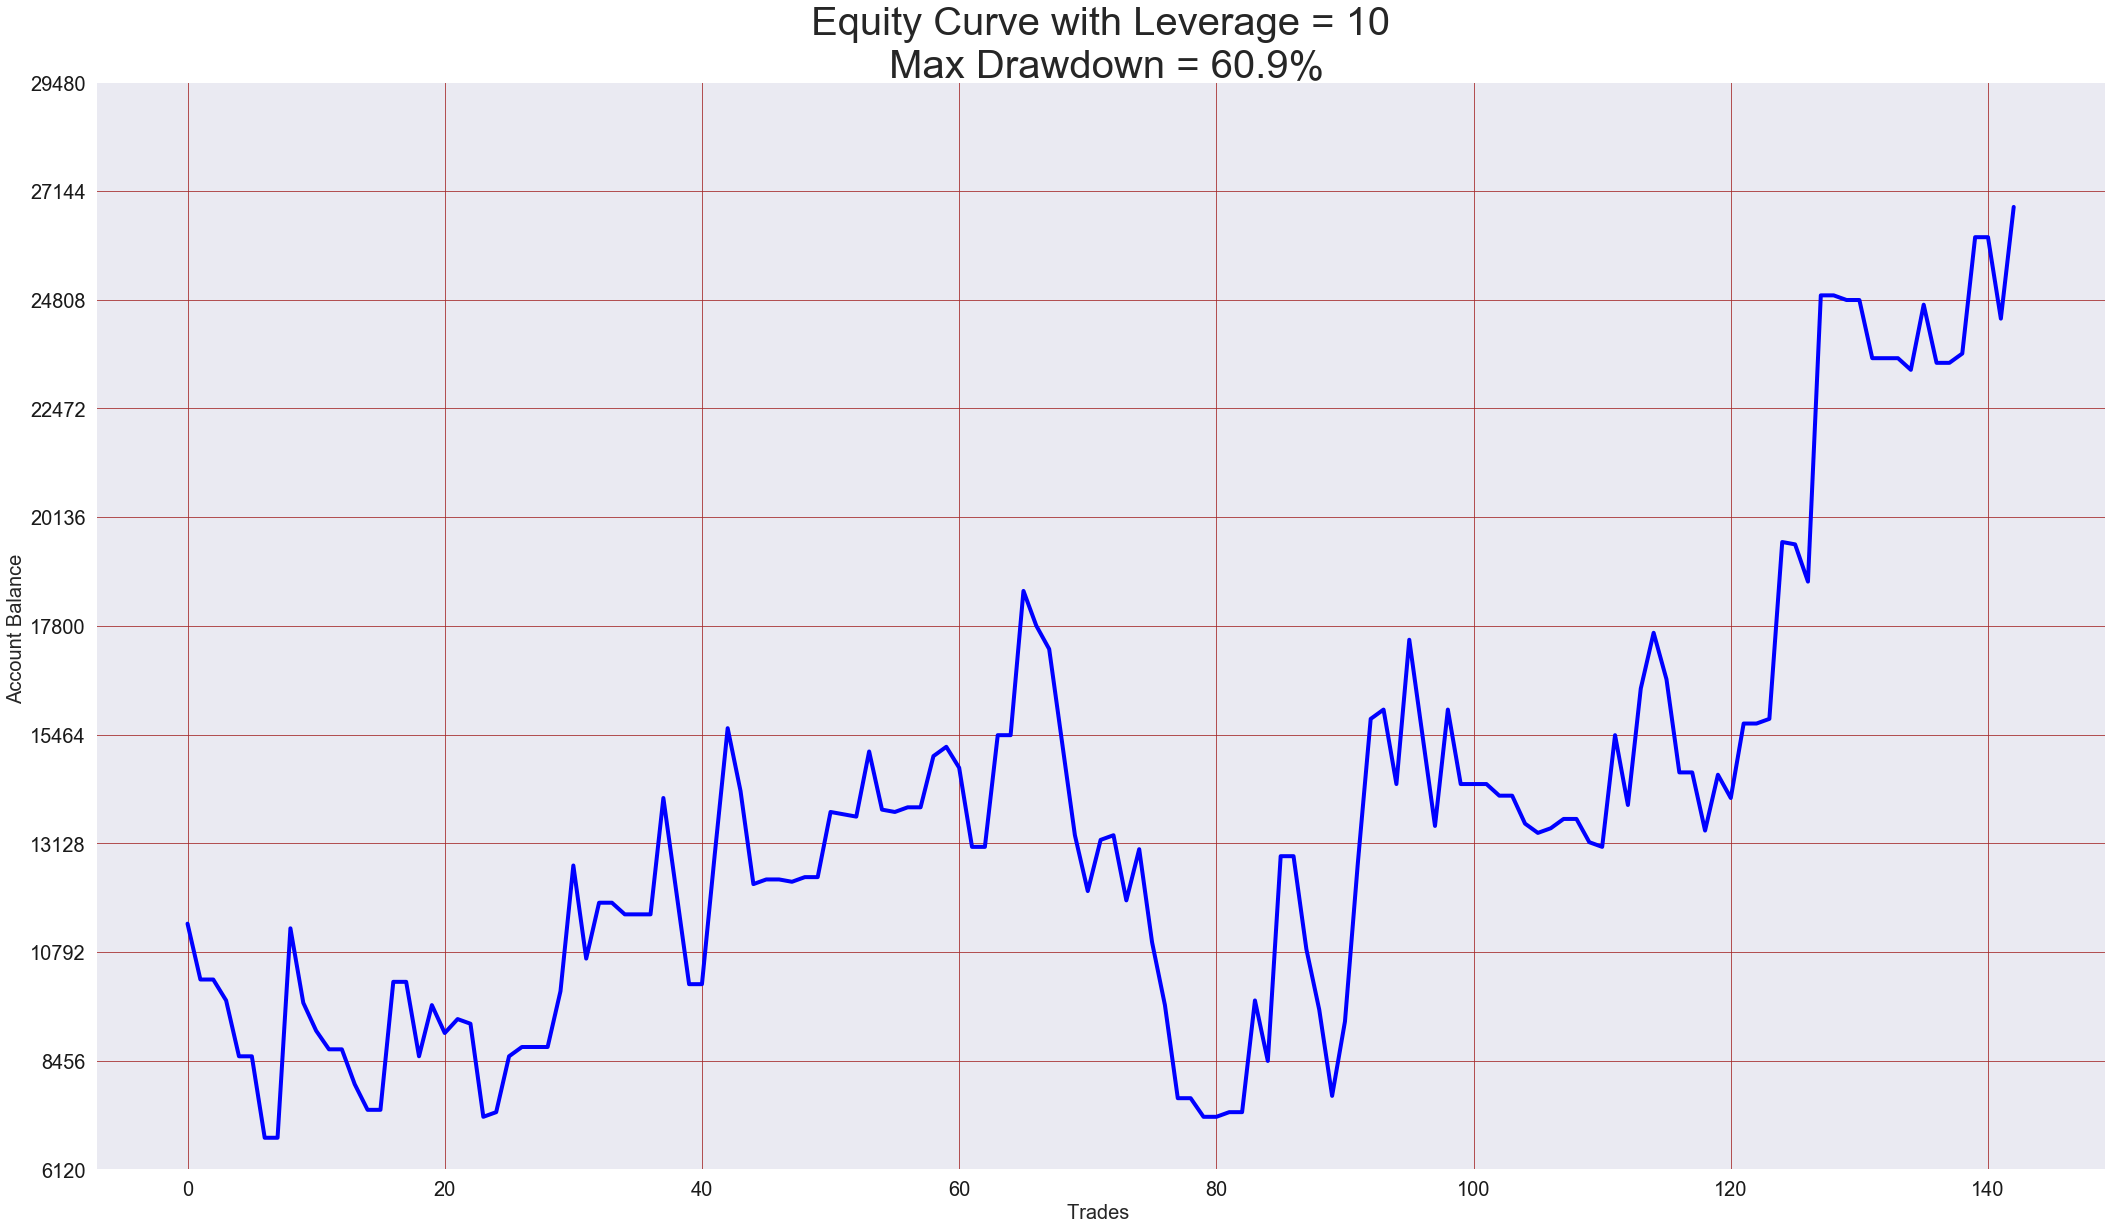
There’s a small chance for a trader to have ten losses in a row. A trader that risk no more than 2% of its equity on a single trade experiences a 20% drawdown at the end of 10 consecutive losses, but may still keep following the rules. A trader risking 5-6% will be 50 or 60% down, and undoubtedly will lose perspective and may stop following the rules, even though the system hasn’t failed.
The main lesson is: Trade thin instead of big at the beginning, analyze your potential drawdowns in losing streaks as a mean to optimize your position size of your system.
Minimizing losses means that we are in control. Being in control is the difference between being a speculator and a gambler. Being a speculator means we can decide on the odds. Be in control about when to enter the market and when to exit. That can’t be done gambling.
We’ll discuss the several methods top traders use in their trading systems. They can be divided into the following categories:
- Chart-based stops
- Indicator stops
- Entry method stops
- Volatility stops
- Money management stops
- Account equity stops
- Margin-based stops
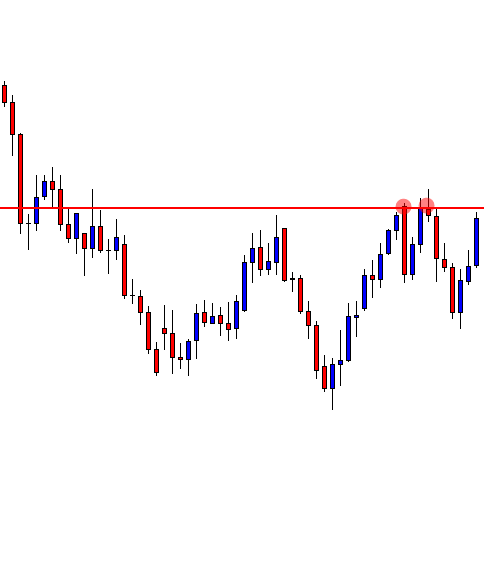
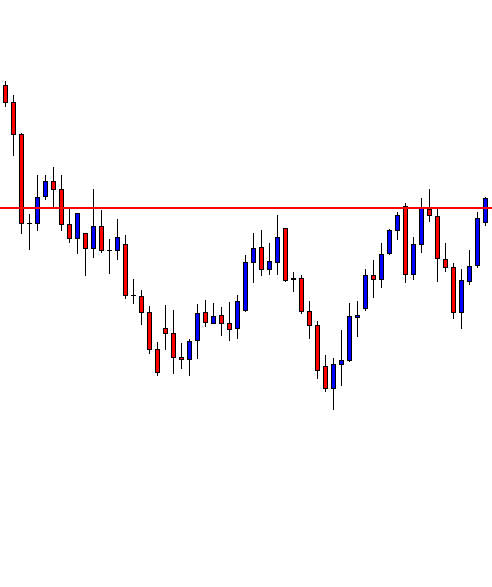
1. chart-based stops
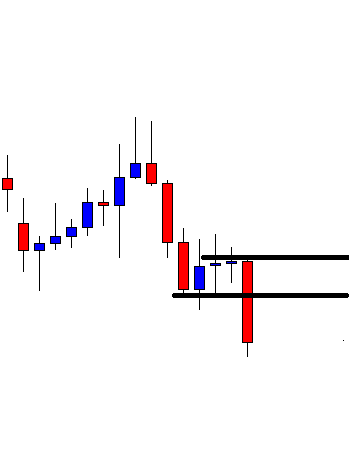
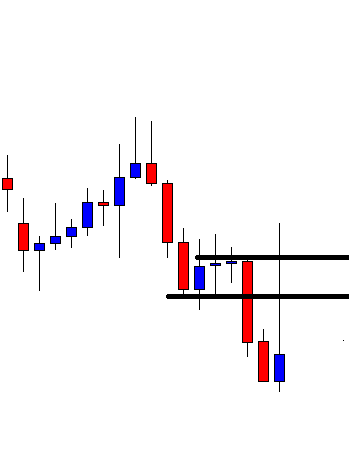
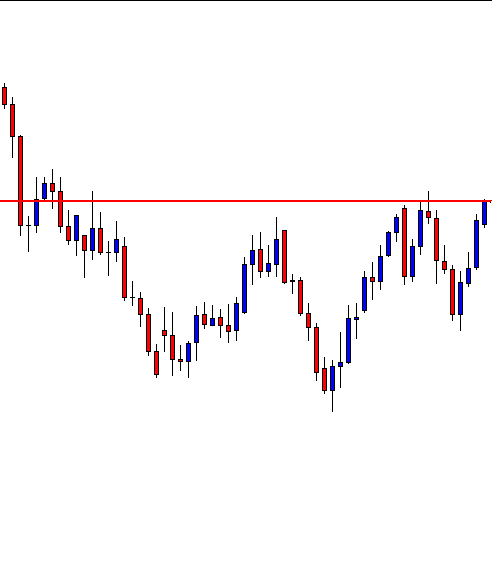
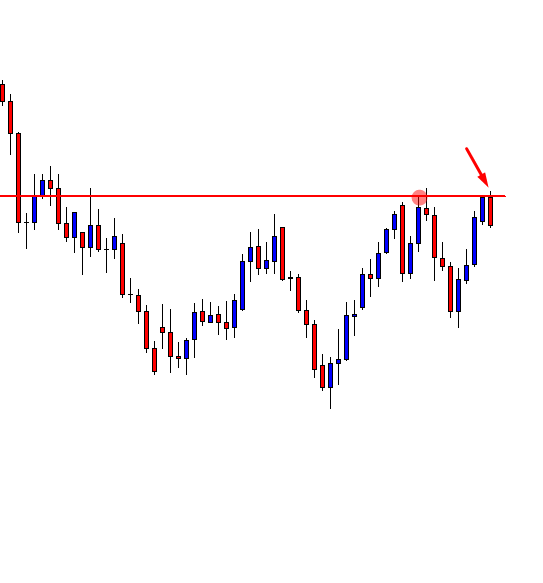
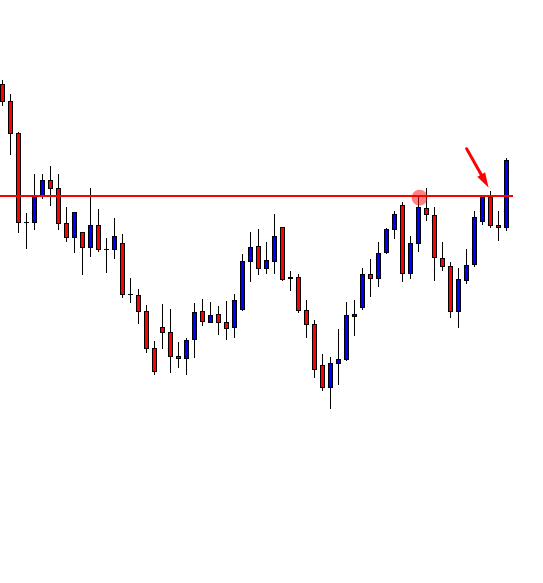
Chart-based stops are those stops put near a meaningful point on a chart. This may be related to a chart pattern, trend line or pivot point that represents support or resistance.
Cutting losses short don’t mean unrealistic tight stops, though. It’s important to give latitude enough to let the trade work.
So, cutting losses short means to close a trade if, by our rules, has touched the stop point. But that point shall be placed according to the logic of the price movement.
Also, it’s wise to let a wide margin at the beginning of the trade using a small position, but, as the trade develops in our favor, we should move the stop higher and, optionally, add to the position.
What happens if the chart stop defines a trade that’s too risky? In the futures market, the minimum risk one can take is the one assumed by trading one contract. In the case of currency markets, this isn’t an issue, so the answer is: reduce your position to the level you have set in your trading rules. The number one rule is to protect our capital.
The chart method to set the stop has its detractors. In Babcock’s book already mentioned, Jake Bernstein says that John Granville used to say: “if it’s obvious, it’s obviously wrong.” “Let’s put the stop at the low of the day.” Ten thousand people are thinking the same way. The odds are that approach is not going to work.

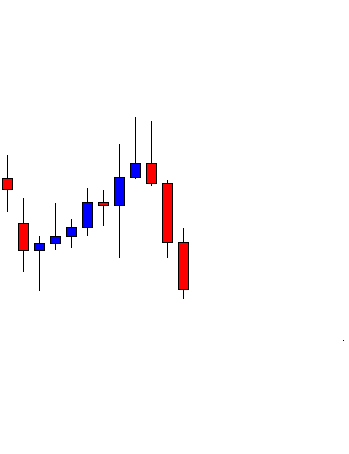
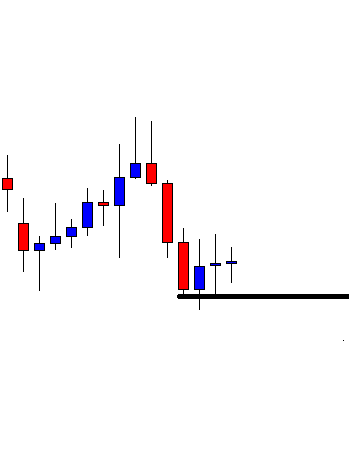
The Last Day Rule:
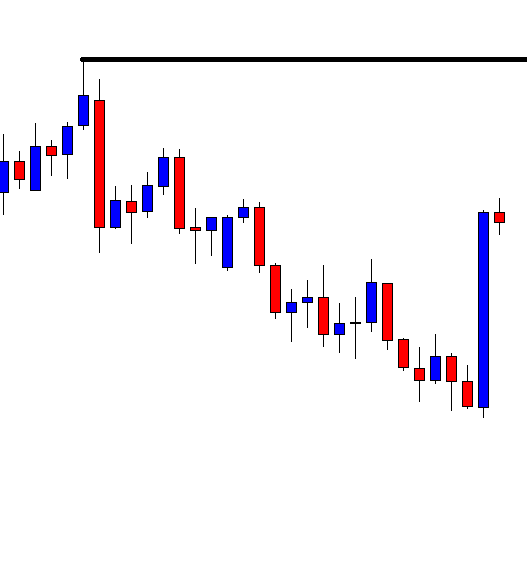
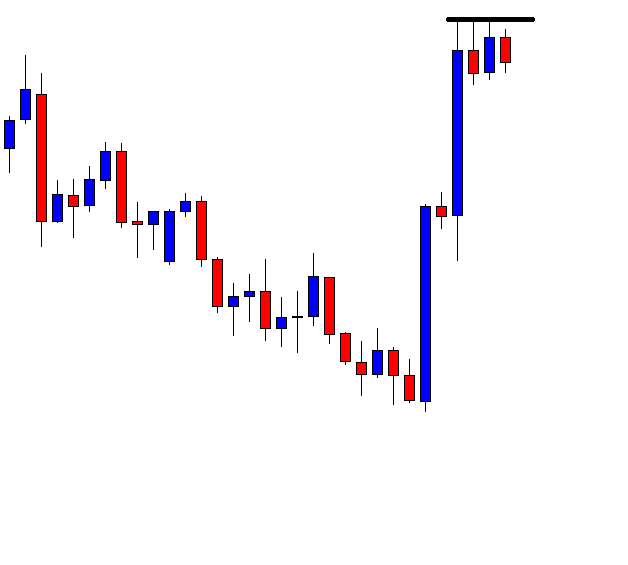
Peter Brandt, mentioned in Babcock’s book, has what he calls “the last day rule”. He applies it to breakout trades to reduce losses on failed breakouts.
The rule calls for a stop set at the opposite extreme of the last day of the previous range pattern. If the break is to the upside, he sets the stop to the low of the last day within the pattern. If to the downside, he uses the high of that last day.
The use of retracements, Fibonacci:
Some traders use retracements as places to start a trade using Fibonacci retracements. One way to place entries and stops is, for instance, entries at a 50% retracement and stops at 62%, that way we plan for a 50% potential profit with a 12% risk; more than 4:1 RR.
Moving to break-even:
One method that helps release stress and anxiety from the trader is to move the stop to the break-even point if and when the price has moved to a level that allows to do it. Then the rest of the trade is a free ride. This has been recommended by many authors focused on trader’s psychology (Alexander Elder, Mark Douglas, Van K. Tharp).
2. indicator stops
Indicator stop means setting the stop by virtue of an indicator, such as a moving average or momentum. It’s not a chart-based stop since it’s computationally based.
Indicator stops seek to optimize the relationship between cutting losses short and not getting chopped up at the same time. That’s difficult to achieve without studying past trades for improvement. Indicator stops tries to optimize the relationship between cutting losses short and not getting chopped up at the same time. That’s difficult to achieve without studying past trades for improvement.
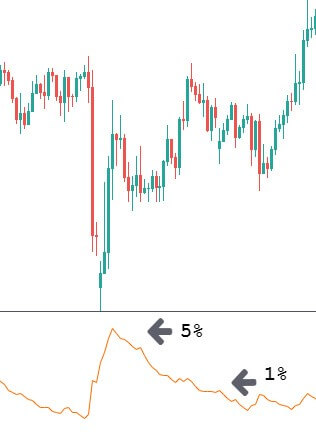
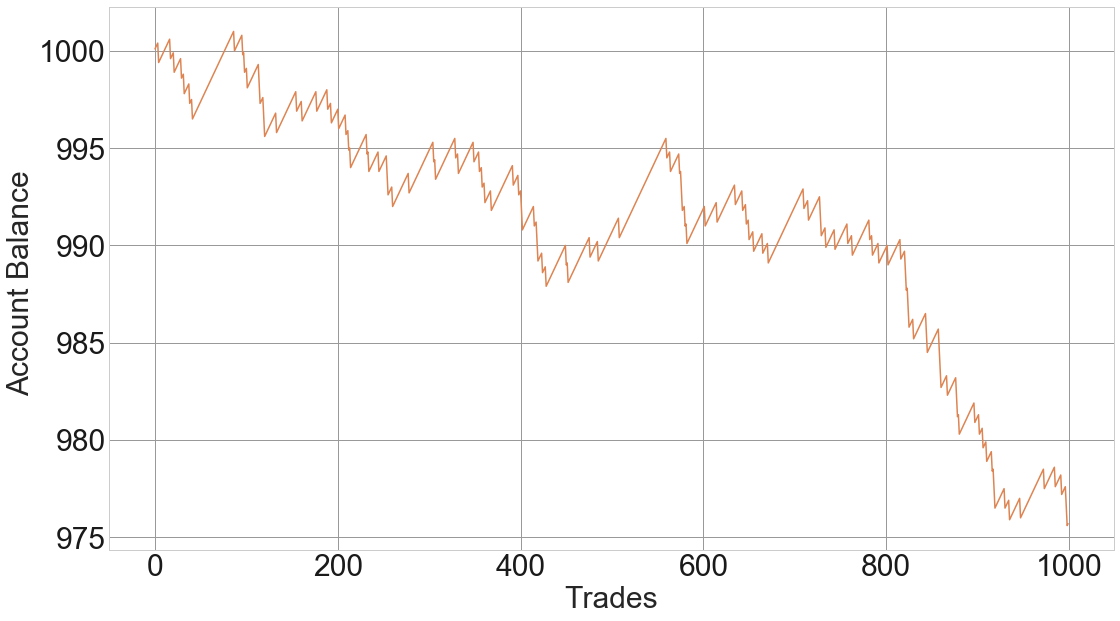
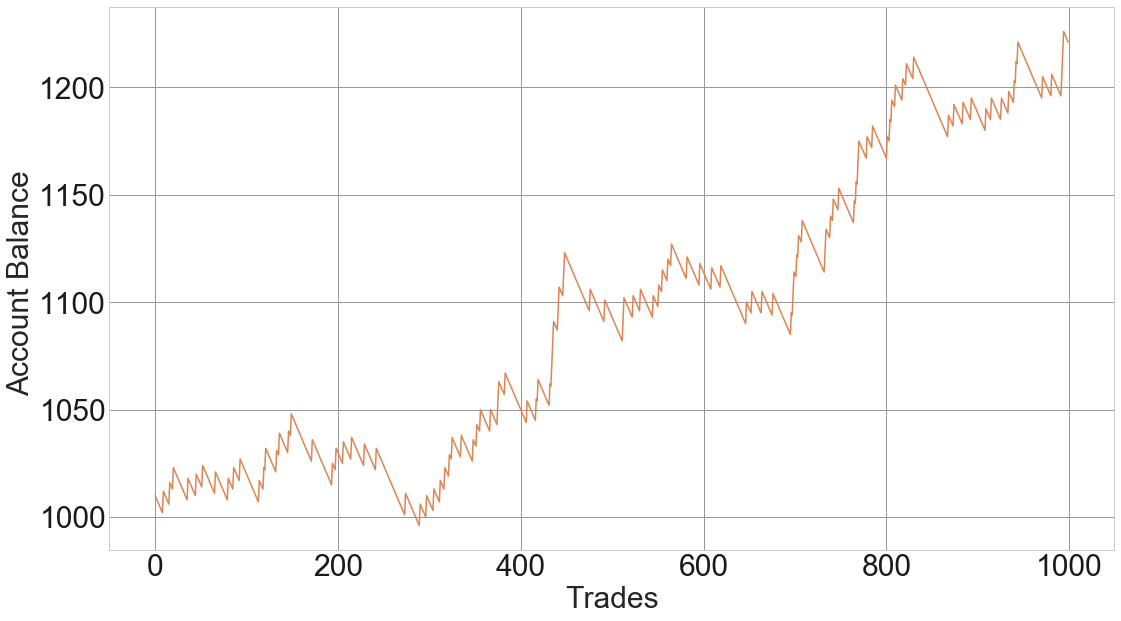
To optimize stops we need to back (or forward) test which is the stop distance beyond which there is are more money lost than gained. For more on this, I recommend John Sweeney’s concept of Maximum Adverse Execution. To optimize stops we need to back (or forward) test which is the stop distance beyond which there is are more money lost than gained. For more on this, I recommend John Sweeney’s concept of Maximum Adverse Execution.
The main idea of the MAE using Sweeney’s words is:
“It turns out that if your trading rules are consistent and can distinguish between good and bad trades, then, over many experiences, you can measure how far good trades go bad and, usually, see at what point a trade is more likely to end badly than profitably. That is the point at which you stop and/or reverse.”


(figures taken from John Sweeney’s book)
3. entry method stops
By entry method stops, it means some stop point that is set by the entry method. It may be a reverse entry signal, or it may occur as a result of the violation of some or all of the trade’s entry conditions.
“The same methodology that says enter the trade has to tell you when the trade is wrong. [..] If a market exceeds the price and time projection windows, then the trade is wrong” (Robert Miner)
Robert Miner has a price and time zone. If price breaks the zone or if the time window is reached without gains, he closes the position.
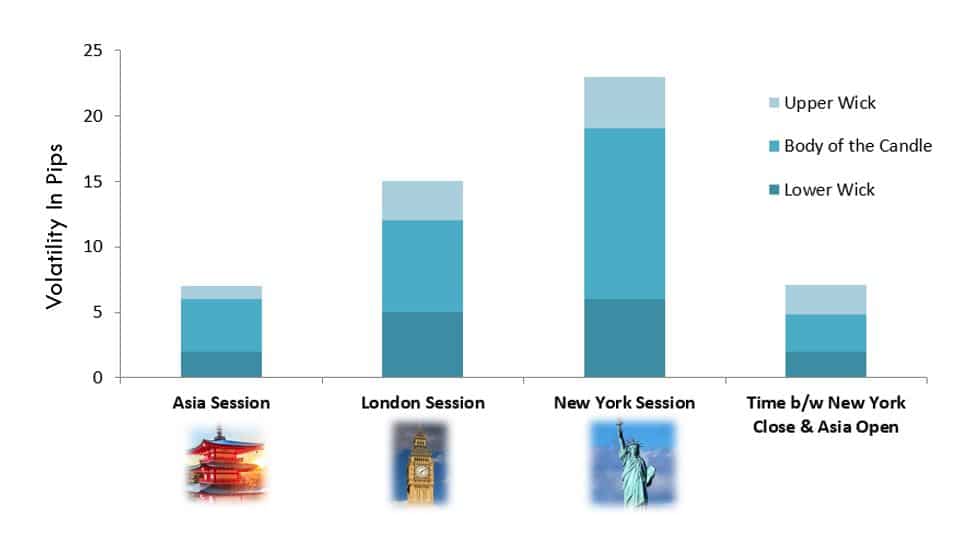
4. volatility stops
Volatility stops are stops placed at a distance from the entry calculated as some percentage of recent or historical volatility. In general, volatility is measured as a price range computed over a time-lapse.
Stan Tamulevich, interviewed by Babcock for his book, uses the three to four-day volatility. If the market takes out the distance of the last day, he quits the trade. Usually even less than that. If the market takes out 50% of last day move ¡t enters in a danger zone.
Russell Wasendorf, another trader interviewed, sets his stop outside the range set by historical volatility. Short-term volatility increases don’t change his plan. His method is more concerned with not getting shaken off a potentially winning position rather than improve its short-term risk.
5. money management stops
Money management stops mean fixed dollar amount stops. It’s a combination of stops and dollar risk management.
The two main advantages the author sees are:
- If the purpose of stop-loss is to manage risk, a dollar stop is the most direct way to manage it.
- That kind of stops don’t go to obvious places, except by coincidence, so the risk to be whipsawed by the market is reduced.
6. account equity stops
An Equity stop is based on a fixed percentage of the account equity. A variant of money management stop.
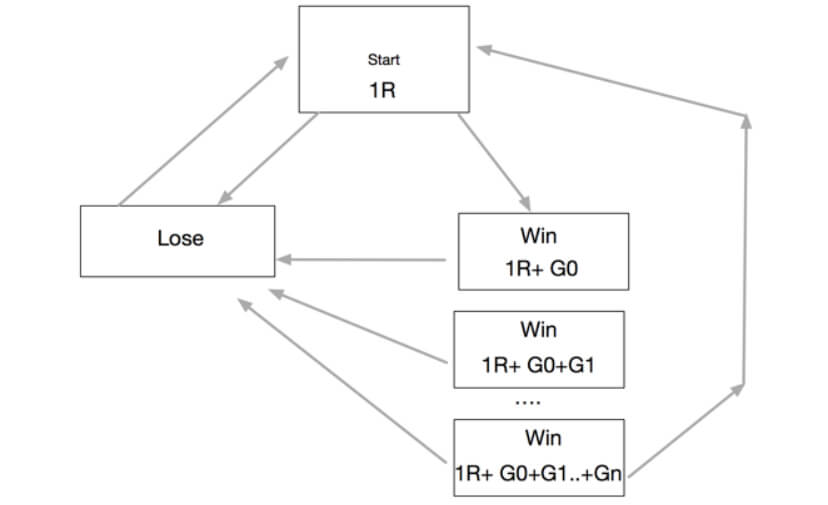
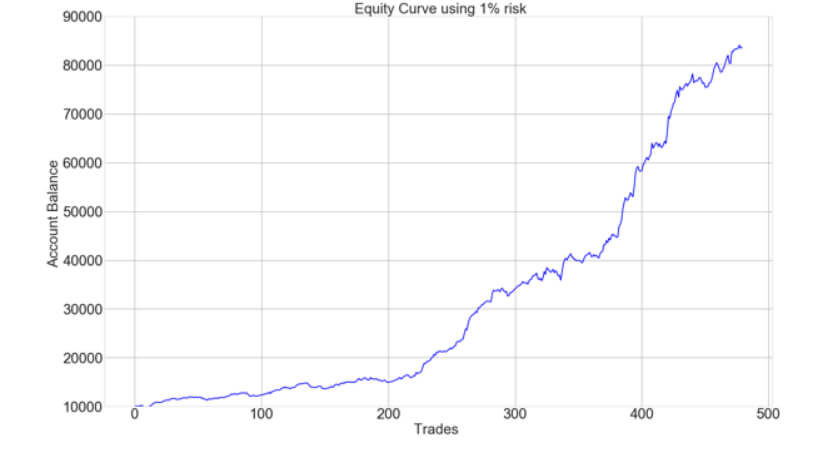
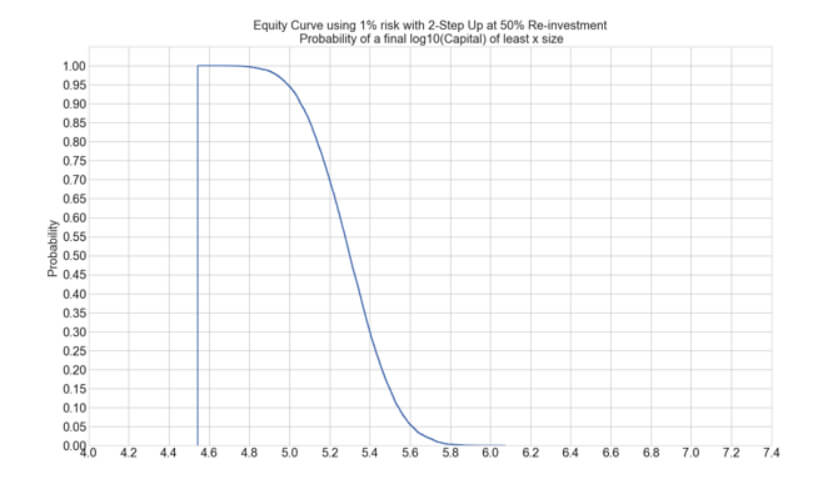
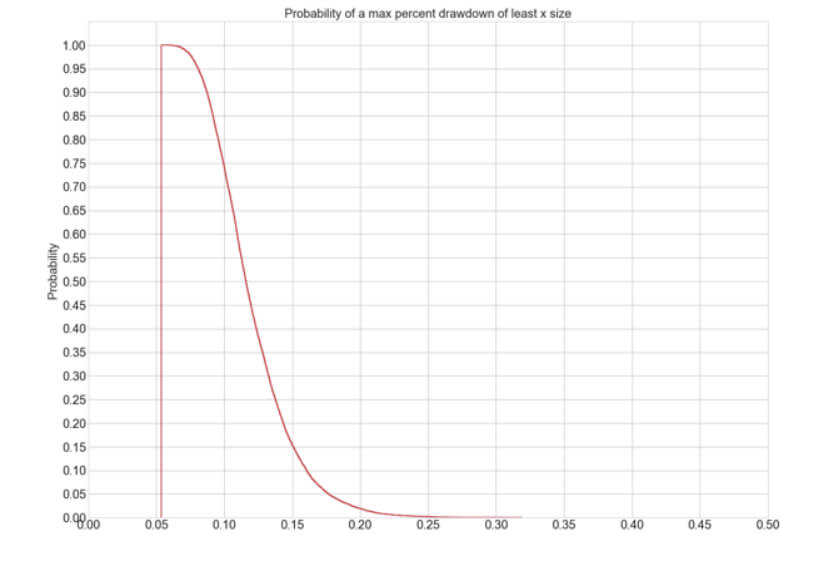
It’s a methodology that starts by defining in dollar terms what’s the risk allowed by the account’s rolling balance of the trader. If we assume 1% risk is set, this leads to a dollar risk amount for that account balance.
Then the risk-dollar amount of the potential trade is computed. If it falls within the 1% risk the trade is taken, opening the number of contracts within the 1% risk rule.
If the loss is not within the 1% rule, the entry point must be adapted to bring it close enough to the exit point, so the risk is no more than 1%.
7. margin-based stops
A variation of the previous type. Stops are calculated by taking a percentage of the exchange margin. This is specific to futures trading.
8. main points to remember
- Cutting losses short is the most important rule in a trading plan
- The trader should be more concerned with the reward-to-risk ratios than with the percentage of winning trades.
- Chart-based stops set stop points in the proximity of market bottoms/tops.
- Indicator-based stops look to optimize the stop point using math and historical analysis of past trades.
- Volatility stops try to keep stop points away from the volatility cloud.
- Account-equity stops move the entry point of a trade to a place that complies with the percent risk rules of the account.
9. conclusions and criticism
Stop-loss definition is a difficult task, but it has to be designed with care, as is the main concept to success in trading.
In Mr. Babcock’s book, the primary focus is the futures market, that presents a very poor atomization of the position. I mean, the minimum size allowed in the futures market is ONE contract so that the minimum risk would be the risk of that single contract from an entry point to a stop point. That makes it difficult to split the concept of “cutting losses” with the concept of “position size.” In the currency markets, this is not the case, as we can do it down to micro-lots, which makes it possible to do independent optimization of the two concepts.
I think a combination of Chart or volatility-based stops is the initial stage towards the definition of this task as part of a trading system. But a second step might be to optimize stops using John Sweeney’s MAE concept. For this, we might need a computerized analysis of our past trades, or a back-test, if the system rules can be automated.
We may design a continuous improvement process, by a careful annotation of the behavior of our current stops for further analysis in search of better places.
Regarding position sizing, this is a subject for another essay, it suffices to say for the moment that we could use the before mentioned rule: don’t to risk more than 1% of our current trading account balance, and if you’re starting trading, don’t risk more than 25% of that. There’s a Spanish popular wisdom sentence: ” En dinero y amistad, la mitad de la mitad” (about money and friendship divide by half and then by half).
We should remember that the primary goal of a trader is to survive.
©Forex.Academy