Categories
Forex Fundamental Analysis

EUR/GBP Global Macro Analysis – Part 2

GBP Endogenous Analysis – Summary

The GBP endogenous analysis has a score of -9. We can therefore understand that the GBP has depreciated in 2020.

  • United Kingdom Employment Change

The UK unemployment change measures the changes in the number of people who are above 16 years and employed. This data is a 3-month moving average of the change in employment, which measures a general trend in the labor industry changes, which typically corresponds to fluctuations in the economy.

In the three months to September 2020, the number of employed people in the UK dropped by 164,000. The YoY employment change shows a drop of 247,000 jobs, which is the worst in ten years. Based on correlation analysis, we assign a score of -7.

  • United Kingdom GDP Deflator

The UK GDP deflator is used as a measure of the comprehensive change in inflation. It filters out any nominal price changes in the entirety of the goods and services produced within the UK.

In Q3 of 2020, the UK GDP deflator dropped to 109.12 from 111.9 in Q2 – the highest ever recorded in UK history. The UK GDP deflator has increased by 6.41in 2020. We, therefore, assign a score of 4 based on its correlation with the GDP growth.

  • United Kingdom Industrial Production

This indicator tracks the changes in all the firms operating under the industrial sector in the UK. The manufacturing sector accounts for about 70% of the total industrial output. The major components of the manufacturing sector are food, tobacco, and drinks, which account for 11%. The manufacture of transport equipment and basic metals account for 17%, pharmaceuticals and non-metallic 6% each. Quarrying and mining activities account for 12% of the industrial production, with 10% for oil and gas extraction.

In September 2020, MoM industrial production in the UK rose by 0.5 while YoY dropped by 6.3%. Despite the growth and recovery of industrial activity from the coronavirus pandemic, the output is still 5.6% lower than the pre-pandemic levels. Thus, we assign a score of -3 based on correlation with GDP growth.

  • United Kingdom Manufacturing PMI

This index is a result of a survey of about 600 companies in the industrial sector. It is a composite of new orders, which accounts for 30%, output 25%, employment 20%, deliveries from suppliers 15%, and inventory 10%. When the index is above 50, it shows that the manufacturing sector is expanding. Below 50, the manufacturing sector is expected to contract, which impacts the GDP output.

In November 2020, the UK manufacturing PMI was 55.6 – the highest recorded in three years. This was mainly driven by increased inventories and increased new orders as a result of Brexit. We assign a score of 3 based on correlation with the GDP growth rate.

  • United Kingdom Consumer Spending

Consumer spending in the UK shows the amount of money that households spent on the purchase of goods and services in the retail sector. Note that expenditure by households is among the primary drivers of GDP growth.

In Q3 of 2020, the UK consumer spending rose to £304.5 billion from £258.32 billion in Q2. This increase is attributed to the restriction imposed at the onset of the coronavirus outbreak, resulting in the economic slowdown. It is, however, still lower than the pre-pandemic levels. Thus, we assign a score of -5 based on correlation with the GDP growth rate.

  • United Kingdom Consumer Confidence

In the UK, GfK surveys about 2000 households to establish their opinions about the past and future economic conditions, their financial situation, and prospects of saving. The survey period covers about 12 months into the future, which makes it a leading indicator of consumer spending, and by extension, the overall economy.

In November 2020, the UK consumer confidence dropped to -33 edging closer to yearly lows of -34 registered at the height of the pandemic. We assign a score of -5 based on its correlation with the GDP growth rate.

  • United Kingdom Public Sector Net Debt to GDP

This ratio tracks the indebtedness of the UK economy. Based on the economy out, both domestic and foreign investors use the ratio to determine whether the UK can be able to service its debt obligations in the future comfortably.

In the financial year 2018 – 2019, the UK’s public sector net debt to GDP was 80.8%, down from 82.4%. In 2020, it is expected to hit 100% with a longer-term average of 91%. We assign a score of 4 since the increased net pubic debt managed to avoid a deeper recession in 2020.

In the next article, we have performed the Exogenous analysis of the EUR/GBP pair and concluded what trend to expect in this currency pair in the near future. Cheers.

Categories
Forex Course

166. Introduction To Obscure Currency Crosses & Why It Is Very Risky To Trade Them?

Introduction

Trading currency crosses an excellent way to make money from forex trading when major currency pairs do not make a good move due to the US economy’s corrective momentum. However, the US dollar is a global reserve currency of every country. Therefore, it can provide enough liquidity to make money where the obscure currency crosses have some risks due to insufficient liquidity.

What is Obscure Currency Cross?

We can find currency crosses when we eliminate the US dollar from major and commodity currencies. However, among the cross currencies, the Euro and the Japanese Yen are mostly traded. Therefore, if you trade any Euro and Yen related cross pair, you might see the price to have adequate liquidity. But, what happens if the currency cross does not have Yen or Euro?

Any cross currency pairs that do not have Japanese Yen or Euro as a first or second currency is called an Obscure currency cross. Examples of obscure currency crosses are GBPCHF, NZDCAD, AUDCHF, CADCHF, NZDCHF, NZDCAD, etc.

Why are Trading Obscure Currency Crosses Risky?

The forex market is run through a decentralized network where no one can dominate any market. Therefore, the movement of a currency pair depends on the supply and demand of that currency pair. When the supply or demand increases, the currency pair starts to move. On the other hand, when there is less volume, the currency pair may move within a correction.

The liquidity remains lower in the obscure currency pair than major, commodity, and EUR/YEN related currency pairs. Therefore, there is a risk of market volatility and correction. In some cases, obscure currency pairs consolidate for a long time, and if we take any trade on that pair, we might have to hold the trade for a considerable time.

Conclusion

In conclusion, we can say that trading obscure currency pairs have some reason to worry due to not having enough liquidity to provide a decent movement. However, it is a great way to make money from obscure currency pairs if we can read the price action well and identify the price is moving within a trend. Overall, maintaining a profitable and robust trading strategy is the key to make a consistent profit from the forex market.

[wp_quiz id=”86520″]
Categories
Forex Basic Strategies

Learning To Trade The GBP/JPY Pair Using The ‘Guppy Burst’ Strategy

Introduction

After discussing some of the intraday and long-term trading techniques, we will now focus on very mechanical trading strategies. The strategies discussed previously were time-driven, which means each strategy involved several parameters.

This style of trading is suited to newbies because it is purely based on a fixed set of rules and steps. Due to its non-dependence on rules specific time frames, the strategies we will be discussing span over three different categories: scalping, day trading, and position trading.

The first strategy is the guppy burst strategy, which is based on the 5-minute chart. The second strategy is English Breakfast Tea, which is based on the 15 minutes chart, and the third strategy we will talk about is the good morning Asia strategy, which is based on the daily chart.

The guppy burst strategy seeks to exploit trading profits when the market is quiet. One would have observed that the market is least volatile after the U.S. market’s close until the Asian market opens. The forex market is quiet during this time and tends to move gently. However, the market movement during this time is fairly predictable. The market again momentum after the Asian market opens.

Time Frame

The guppy burst strategy works well on the 5-minute time frame. This means each candle represents 5 minutes of price movement.

Indicators

This strategy is based on pure price action; hence, no indicators are required for this strategy.

Currency Pairs

This strategy applies only to the GBP/JPY currency pair.

Strategy Concept

Firstly, we identify a ‘range’ during the window of three hours between the close of the U.S. market and the opening of the Asian market. We are also taking advantage of the volatility that is witnessed when the opening of the Asian market is nearing. We will place a pending buy order at the range’s resistance with a stop loss at the support.

Similarly, we will place a pending sell order at the support of the range with a stop loss at the resistance. This might appear opposite for some traders who are well versed with the support and resistance strategy. The reason behind buying at resistance and selling at support is that, as soon as the Asian market opens, the market starts to trend in the same direction of the current move. This means we are anticipating a breakout or a breakdown of the range.

We will have two take-profit points in this strategy. The first profit target is set at risk to reward ratio of 1:1.5, while the second one is at 1:2 risk to reward. By this, we ensure that we lock in some profits and don’t lose when the trade goes against our favor.

Trade Setup

Since the time zone of the trade very important here, we need to mark the reference candle for the strategy. It is the one that corresponds to 5 PM New York time, which is nothing but the closing time of the U.S. market. As mentioned earlier, the strategy is applicable only to the GBP/JPY currency pair. Here are the steps of the guppy burst strategy.

Step 1

The first step is to open the chart of the GBP/JPY currency pair and then wait for the U.S. market to close. Mark this as the reference candle, and from here, the analysis of the chart begins. We need to analyze the pair on the 5 minutes candlestick chart. The below image shows an example of such a trade setup on the GBP/JPY pair. Here we see that the market is an uptrend and recently has formed a range.

Step 2

Next, we need to identify a ‘range’ where we have at least two points of support and resistance. We have to assure that the market does not start moving in a single direction after the U.S. market closes. If it does, then the strategy is no longer valid. However, the market mostly remains sideways after the U.S. session. Depending on the market’s major trend, we place a limit order at support and resistance. If the major trend of the market is up, we place the ‘buy’ limit at the resistance, and if the major trend is down, we place the ‘sell’ limit at the support.

Step 3

In this step, we do not have to do anything, but just wait for the market to hit our limit orders. At the same time, if our limit order is not triggered, we should leave the market as it is and not chase it. This is an important part of risk management.

In the below image, we see that our ‘buy’ order gets triggered a few minutes after the opening of the Asian market.

Step 4

As mentioned earlier, we have two ‘take-profit’ points for the strategy. The stop-loss placed at support if going ‘long’ in the market and at resistance if going ‘short.’ The first ‘take-profit’ is set at a point where the resultant risk to reward of the trade is 1:1.5. The second ‘take-profit’ is set at 1:2 risk to reward. We lock in some profits at the first profit target, which ensures that we don’t lose money even if the market turns around.

The below image shows how the market continues to move upwards and starts trending after the breakout from the range.

Strategy Roundup

As we are not sure when the breakout will happen, the best way to enter the market is by creating a pending order on the extreme ends of the range. The important part is the identification of the range during the three-hour window between the U.S. market close and Asia market open. Along with that, make sure to place a limit order in the direction of the market.

Categories
Forex Options

FX Options Market Combined Volume Expiries for 20 May 2020

Thank you for visiting the Forex Academy FX Options market combined volume expiries section. Each day, where available, we will bring you notable maturities in FX Options of amounts of $100 million-plus, and where these large combined maturities at specified currency exchange rates often have a magnetic effect on price action, especially in the hours leading to their maturities, which happens daily at 10.00 AM Eastern time. This is because the big institutional players hedge their positions accordingly. Each option expiry should be considered ‘in-play’ with a good chance of a strike if labelled in red, still in play and a possible strike if labelled in orange and ‘out of play’ and an unlikely strike if labelled in blue, with regard to the likelihood of price action meeting the strike price at maturity.

…………………………………………………………………………………………………………………..

FX option expiries for May 20 NY cut at 10:00 Eastern Time, via DTCC, can be found below.

– EUR/USD: EUR amounts

  • 1.0930 629m 

– GBP/USD: GBP amounts        

  • 1.2150 332m
  • 1.2250 216m

– USD/JPY: USD amounts         

  • 106.89 507m
  • 107.00 416m
  • 107.70 595m
  • 108.00 934m
  • 108.70 500m

– USD/CAD: USD amounts

  • 1.3750 710m 

– NZD/USD: NZD amounts

  • 0.6060 267m

………………………………………………………………………………………………………………

As you can see on the charts we have also plotted the expiration levels at the various exchange rate maturities and we have also labelled in red, orange and blue. Therefore, if you see option expiry exchange rates labelled in red these should be considered in-play, because we believe there is a greater chance of the expiry maturing at these levels based on technical analysis at the time of writing. There is still a lesser possibility of a strike if they are in orange and so these are ‘in-play’ too. However, if we have labelled them in blue, they should be considered ‘not in-play’ and therefore price action would be unlikely to reach these levels, which are often referred to as Strikes, at the time of the 10 AM New York cut.

Our technical analysis is based on exchange rates which may be several hours earlier in the day and may not reflect price action at the time of the maturities. Also, we have not factored in economic data releases or keynote speeches by policymakers, or potential market volatility leading up to the cut.

Although we have added some technical analysis we suggest you take the levels and plot them onto your own trading charts and incorporate the information into your own trading methodology in order to use the information to your advantage.

Remember the higher the amount, the larger the gravitational pull towards the exchange rate maturity at 10:00 AM Eastern time.

If you want to learn how forex option expiries affect price action in the spot FX market see our educational article by clicking here: https://bit.ly/2VR2Nji

DISCLAIMER: Please note that this information is for educational purposes. Also, the maturities will look more or less likely to become a strike at 10 AM NY time due to exchange rate fluctuations resulting in a different perspective with regard to technical analysis, and also due to upcoming economic data releases for the associated pairs.

Categories
Forex Options

FX Options Market Combined Volume Expiries for 19 May

Thank you for visiting the Forex Academy FX Options market combined volume expiries section. Each day, where available, we will bring you notable maturities in FX Options of amounts of $100 million-plus, and where these large combined maturities at specified currency exchange rates often have a magnetic effect on price action, especially in the hours leading to their maturities, which happens daily at 10.00 AM Eastern time. This is because the big institutional players hedge their positions accordingly. Each option expiry should be considered ‘in-play’ with a good chance of a strike if labelled in red, still in play and a possible strike if labelled in orange and ‘out of play’ and an unlikely strike if labelled in blue, with regard to the likelihood of price action meeting the strike price at maturity.

…………………………………………………………………………………………………………………..

FX Options Market Combined Volume Expiries due at 10:00 Eastern Time, via DTCC, can be found below.

– EUR/USD: EUR amounts

  • 1.0845 755m
  • 1.0860 1.0bn
  • 1.0890 595m


– GBP/USD: GBP amounts        

  • 1.2200 261m
  • 1.2300 429m

– USD/JPY: USD amounts         

  • 106.50 351m
  • 106.65 460m
  • 106.75 1.3bn
  • 107.00 532m
  • 107.35 640m
  • 107.65 418m
  • 107.75 1.1bn
  • 108.00 452m

………………………………………………………………………………………………………………

As you can see on the charts we have also plotted the expiration levels at the various exchange rate maturities and we have also labelled in red, orange and blue. Therefore, if you see option expiry exchange rates labelled in red these should be considered in-play, because we believe there is a greater chance of the expiry maturing at these levels based on technical analysis at the time of writing. There is still a lesser possibility of a strike if they are in orange and so these are ‘in-play’ too. However, if we have labelled them in blue, they should be considered ‘not in-play’ and therefore price action would be unlikely to reach these levels, which are often referred to as Strikes, at the time of the 10 AM New York cut.

Our technical analysis is based on exchange rates which may be several hours earlier in the day and may not reflect price action at the time of the maturities. Also, we have not factored in economic data releases or key note speeches by policymakers, or potential market volatility leading up to the cut.

Although we have added some technical analysis we suggest you take the levels and plot them onto your own trading charts and incorporate the information into your own trading methodology in order to use the information to your advantage.

Remember the higher the amount, the larger the gravitational pull towards the exchange rate maturity at 10:00 AM Eastern time.

If you want to learn how forex option expiries affect price action in the spot FX market see our educational article by clicking here: https://bit.ly/2VR2Nji

DISCLAIMER: Please note that this information is for educational purposes. Also, the maturities will look more or less likely to become a strike at 10 AM NY time due to exchange rate fluctuations resulting in a different perspective with regard to technical analysis, and also due to upcoming economic data releases for the associated pairs.

Categories
Forex Options

FX option expiries for May 13 New York cut

Thank you for visiting Forex.Academy’s FX Options Expiries Section. Each day, where available, Forex Academy will bring you notable maturities in FX Options of volumes of $100 million-plus, as these large commutative maturities at the specified currency exchange rates often have a magnetic pull on price action, especially in the hours near their maturities. These happens daily at 10.00 AM Eastern time. This effect is due to the big institutional players hedging their positions using option derivatives. Each option expiry has to be considered ‘in-the-money’ if labelled as Hot and Warm, or ‘out of the money’ if labelled Cold with regard to the likelihood of price action meeting the strike price at maturity.

…………………………………………………………………………………………………………………..

FX option expiries for May 13 New York cut

FX option expiries for May 13, NY cut at 10:00 Eastern Time, via DTCC, can be found below.

– USD/JPY: USD amounts         

  • 106.00 429m
  • 107.00 861m
  • 107.40 1.1bn


– GBP/USD: GBP amounts        

  • 1.2440 350m


– AUD/USD: AUD amounts

  • 0.6500 1.0bn 

– USD/CAD: USD amounts

  • 1.4000 1.5bn


– EUR/GBP: EUR amounts

  • 0.8740 420m
  • 0.8750 362m

………………………………………………………………………………………………………………

As we can see on the charts we have also plotted the expiration levels at the various exchange rate maturities and we have also labelled them as cold, warm or hot.

Therefore, if you spot exchange rates labelled as warm or hot, these should be considered In-Play. That is because we believe there is a greater likelihood of the expiry maturing at these levels based on the technical analysis at the time of this writing. However, if you see them labelled as Cold, they should be considered Not In-Play; thus it would be unlikely that price action could reach these levels, which are referred to as Strikes, at the New York’s cut time. Please consider that upcoming economic data releases are not factored in, nor did we take into account policymaker speeches that may modify the technical analysis outlook in the hours leading up to the expiration.

We suggest you plot these levels onto your own trading charts and combine this information into your own trading methodology in order to use the information to your advantage.

Remember the higher the volume of interest, the larger the gravitational pull towards the exchange rate maturity at 10:00 AM Eastern time.

If you want to learn how forex option expiries affect price action in the spot FX market see our educational article by clicking here: https://bit.ly/2VR2Nji

DISCLAIMER: Please note that this information is for educational purposes. Also, heat levels may change throughout the day in line with the exchange rate fluctuations due to technical analysis trading and upcoming economic data releases of the associated pairs.

Categories
Forex Options

FX option expiries for May 11 New York cut

Thank you for visiting the Forex.Academy FX Options Expiries Section. Each day, where available, we will bring you notable maturities in FX Options of amounts of $100 million-plus, and where these large commutative maturities at specified currency exchange rates often have a magnetic effect on price action, especially in the hours leading to their maturities, which happens daily at 10.00 AM Eastern time. This is because the big institutional players hedge their positions accordingly. Each option expiry should be considered ‘in-play’ if labelled as Hot, Warm or ‘out of play’ if labelled Cold with regard to the likelihood of price action meeting the strike price at maturity.

…………………………………………………………………………………………………………………..

FX option expiries for May 11 New York cut

FX option expiries for May 11 NY cut at 10:00 Eastern Time, via DTCC, can be found below.

– EUR/USD: EUR amounts

  • 1.0800 892m
  • 1.0850 1.0bn


– USD/JPY: USD amounts         

  • 106.25 410m
  • 106.40 511m
  • 106.70 588m


– EUR/GBP: EUR amounts

  • 0.8700 983m
  • 0.8800 902m

………………………………………………………………………………………………………………

As you can see on the charts we have also plotted the expiration levels at the various exchange rate maturities and we will also labelled them as cold, warm or hot.

Therefore, if you see exchange rates labelled as warm or hot, these should be considered In-Play, because we believe there is a greater chance of the expiry maturing at these levels based on technical analysis at the time of writing. However, if we have labelled them as Cold, they should be considered Not In-Play and therefore price action would be unlikely to reach these levels, which are often referred to as Strikes, at the time of the New York cut. Please bear in mind that we have not factored in upcoming economic data releases, or policymaker speeches and that technical analysis may change in the hours leading up to the cut.

We suggest you take the levels and plot them onto your own trading charts and incorporate the information into your own trading methodology in order to use the information to your advantage.

Remember the higher the amount, the larger the gravitational pull towards the exchange rate maturity at 10:00 AM Eastern time.

If you want to learn how forex option expiries affect price action in the spot FX market see our educational article by clicking here: https://bit.ly/2VR2Nji

DISCLAIMER: Please note that this information is for educational purposes. Also, heat levels may change throughout the day in line with the exchange rate fluctuations due to technical analysis trading and upcoming economic data releases of the associated pairs.

Categories
Forex Options

FX option expiries for May 7 New York cut

Thank you for visiting the Forex.Academy FX Options Expiries Section. Each day, where available, we will bring you notable maturities in FX Options of amounts of $100 million-plus, and where these large commutative maturities at specified currency exchange rates often have a magnetic effect on price action, especially in the hours leading to their maturities, which happens daily at 10.00 AM Eastern time. Each option expiry should be considered ‘in-play’ if labelled as Hot, Warm, or ‘out of play’ if labelled Cold with regard to the likelihood of price action meeting the strike price at maturity.

…………………………………………………………………………………………………………………..

FX option expiries for May 7 NY cut

FX option expiries for May 7 NY cut at 10:00 Eastern Time, via DTCC, can be found below.

– EUR/USD: EUR amounts

  • 1.0700 1.0bn
  • 1.0750 673m
  • 1.0775 599m
  • 1.0780 783m
  • 1.0800 2.3bn
  • 1.0805 518m
  • 1.0810 523m

– USD/JPY: USD amounts         

  •  105.25 450m
  •  105.40 430m
  •  105.75 700m
  •  106.00 457m
  •  106.50 1.1bn
  •  106.75 705m
  •  107.00 1.1bn

– AUD/USD: AUD amounts

  • 0.6400 698m
  • 0.6415 1.2bn

………………………………………………………………………………………………………………

If you want to learn how forex option expiries affect price action in the spot FX market see our educational article by clicking here: https://bit.ly/2VR2Nji

DISCLAIMER: Please note that this information is for educational purposes. Also, heat levels may change throughout the day in line with the exchange rate fluctuations due to technical analysis trading and upcoming economic data releases of the associated pairs.

Categories
Forex Options

FX option expiries for May 6 New York cut

Thank you for visiting the Forex.Academy FX Options Expiries Section. Each day, where available, we will bring you notable maturities in FX Options of amounts of $100 million-plus, and where these large commutative maturities at specified currency exchange rates often have a magnetic effect on price action, especially in the hours leading to their maturities, which happens daily at 10.00 AM Eastern time. Each option expiry should be considered ‘in-play’ if labelled as Hot, Warm or ‘out of play’ if labelled Cold with regard to the likelihood of price action meeting the strike price at maturity.

…………………………………………………………………………………………………………………..

FX option expiries for May 6 New York cut

FX option expiries for May 6 NY cut at 10:00 Eastern Time, via DTCC, can be found below.

EUR/USD: EUR amounts

  • 1.0860 519m 


– GBP/USD: GBP amounts   

  • 1.2325 250m
  • 1.2400 327m

………………………………………………………………………………………………………………

If you want to learn how forex option expiries affect price action in the spot FX market see our educational article by clicking here: https://bit.ly/2VR2Nji

DISCLAIMER: Please note that this information is for educational purposes. Also, heat levels may change throughout the day in line with the exchange rate fluctuations due to technical analysis trading and upcoming economic data releases of the associated pairs.

Categories
Forex Fundamental Analysis

Impact Of ‘Consumer Credit’ Economic Indicator On The Forex Market

Introduction

Consumer Credit is one of the economic indicators used by economists to analyze the health of the economy. It can be useful to infer the direction of other economic indicators like Spending, inflation, and standard of living. Although it is a low impact indicator in the trading world, a good understanding of Consumer Credit can be beneficial for strengthening our overall fundamental analysis.

What is Consumer Credit?

Consumer Credit refers to the debt incurred by individuals to serve their immediate needs. Consumer Credit here, in general, applies to the short-term loans given out to spend on their daily requirements like groceries, paying electricity bills. Consumer Credit is different in this context from long-term loans like House Mortgages, which are secured by real-estate. Consumer Credit is usually unsecured with no collateral.

Consumer Credit in these days comes in the form of Credit Cards mostly although there are other variants. The limit of Credit available on a given Credit Card depends on the net-salary of the individual. In general, the Credit limit is 8-12 times the monthly salary. Credit Cards are issued to people usually who can show a consistent flow of income in their bank statements, which generally translates to job-holders and business people as their default rate is lower than that of unemployed people.

Consumer Credit is made available through banks, retailers (like shopping malls, retail chains) and other small agencies to enable customers to be able to fulfill their immediate needs and pay-off at a later date with interest. The credit limit, interest rate, and the time after which the interest comes into effect vary from one lender to another. There are two different types of credits, and let’s discuss them in detail below.

Installment Credit

Installment Credit is given out for a specific purchase, and is issued for a definite amount for a fixed period and fixed monthly installments. The monthly payments are usually equal, and the time frame ranges from 3-month to 5-years generally. Installment Credit is also called EMI (Easy Monthly Installments) nowadays.

It is popular among the general population as it is widely used to make goods and services which are more on the expensive side, like a car, TV, or furniture, etc.  For example, a 3500$ bike could be purchased with an EMI, where the individual may make the initial downpayment of 500$ and choose to pay the remainder 3000$ as 500$ monthly installments in the form of a 6-month tenure EMI plus a little extra service charge for issuing this Credit.

Revolving Credit

Revolving Credits are used for any type of purchase, unlike Installment Credit. Revolving Credit is mostly available in the form of Credit Cards, where the line of Credit is open to the maximum limit set by the lender.

For example, a 50,000 dollar limit Credit Card can be simultaneously used to purchase a 20,000 dollars item and also again for anything else that is worth up to 30,000 dollars. The Credit line stays open as long as the individual pays the minimum amount to settle the interest on the Credit issued. It may even never be paid in full as long as we pay the minimum interest while the overall credit piles up.

This is unsecured Credit, and hence the interest rates on this type of Credit are high, which is risky as once you default, the interests can pile up very quickly, making it very difficult to recover. For example, a 10,000 dollar revolving credit, when you miss payments, let us say for six months, then the total settlement of the Credit can go up to 20,000 dollars also. This can also affect the credit rating of the individual debarring him from future Credit approvals from the agencies.

How can the Consumer Credit numbers be used for analysis?

As Consumer Credit refers to the short-term loans which are usually paid back with a little interest, generally, Consumers take Credit for personal enjoyment or servicing immediate needs. Hence, it tells us the Consumer’s confidence towards repayment of the incurred Credit.

People facing tight monetary situations during job loss generally cut back on Spending and stay away from such Credits. Hence, an increase in Consumer Credit can be seen as a sign of a healthy and growing economy.

Increased Credit numbers also tell us that banks and other retail agencies are willing to lend out money, as they are confident about the repayment and their prospects. High Credit also signifies that the liquidity of the economy is too high, meaning there is enough cash flowing in the system to give Credit lenders confidence to supply Credits to more and more individuals.

Impact on Currency

Consumer Credit number is a proportional indicator. Higher Consumer Credit numbers are good for the economy and thereby for the currency. Lower Consumer Credit signifies tight monetary conditions resulting in deflationary situations in the marketplace, which is depreciating for the economy. When Credit goes down, so does Spending, and thereby, business slowdowns are apparent once the demand is reduced, which is terrible for the economy anyway. 

Economic Reports

In the United States, the Board of Governors of the Federal Reserve System releases the Consumer Credit report around the fifth business day of every month on their official website under the section called G.19. The reports are released in Billions of Dollars in both Seasonally Adjusted and Not Seasonally Adjusted formats. The data report set goes back until 1945. The report details of the type of credits also, like Car loans, personal loans, with which institutions being the lenders of the Credit and the related maturity periods.

Sources of Consumer Credit

Monthly Consumer Credit Reports can be found here.

Fred Consumer Credit & Consumer Credit Owned and Securitized information can be found here & here, respectively.

If you are interested in comparing the Consumer Credit numbers of different nations, you can do that here.

Impact of the ‘Consumer Credit’ news release on the price chart 

In the previous section of the article, we understood and comprehended the Consumer Credit economic indicator, which essentially measures the change in the total value of outstanding consumer credit that requires installment payments. It is also strongly related to consumer spending and credit. Repeated revisions to the methodology result in volatile figures during a specific period of time. Consumer Credit does not majorly affect the value of a currency, and the volatility witnessed during the news release is on the lower side.

The image below shows the latest month-on-month Consumer Credit data of the U.S. that is published by the Federal Reserve. Traders usually have a short term view on the market based on the data, as it is not an enormous event, and it does not have a long-term impact on the currency. A higher than expected reading should be positive for the currency while a lower than expected is considered to be negative. Let us analyze the market reaction.

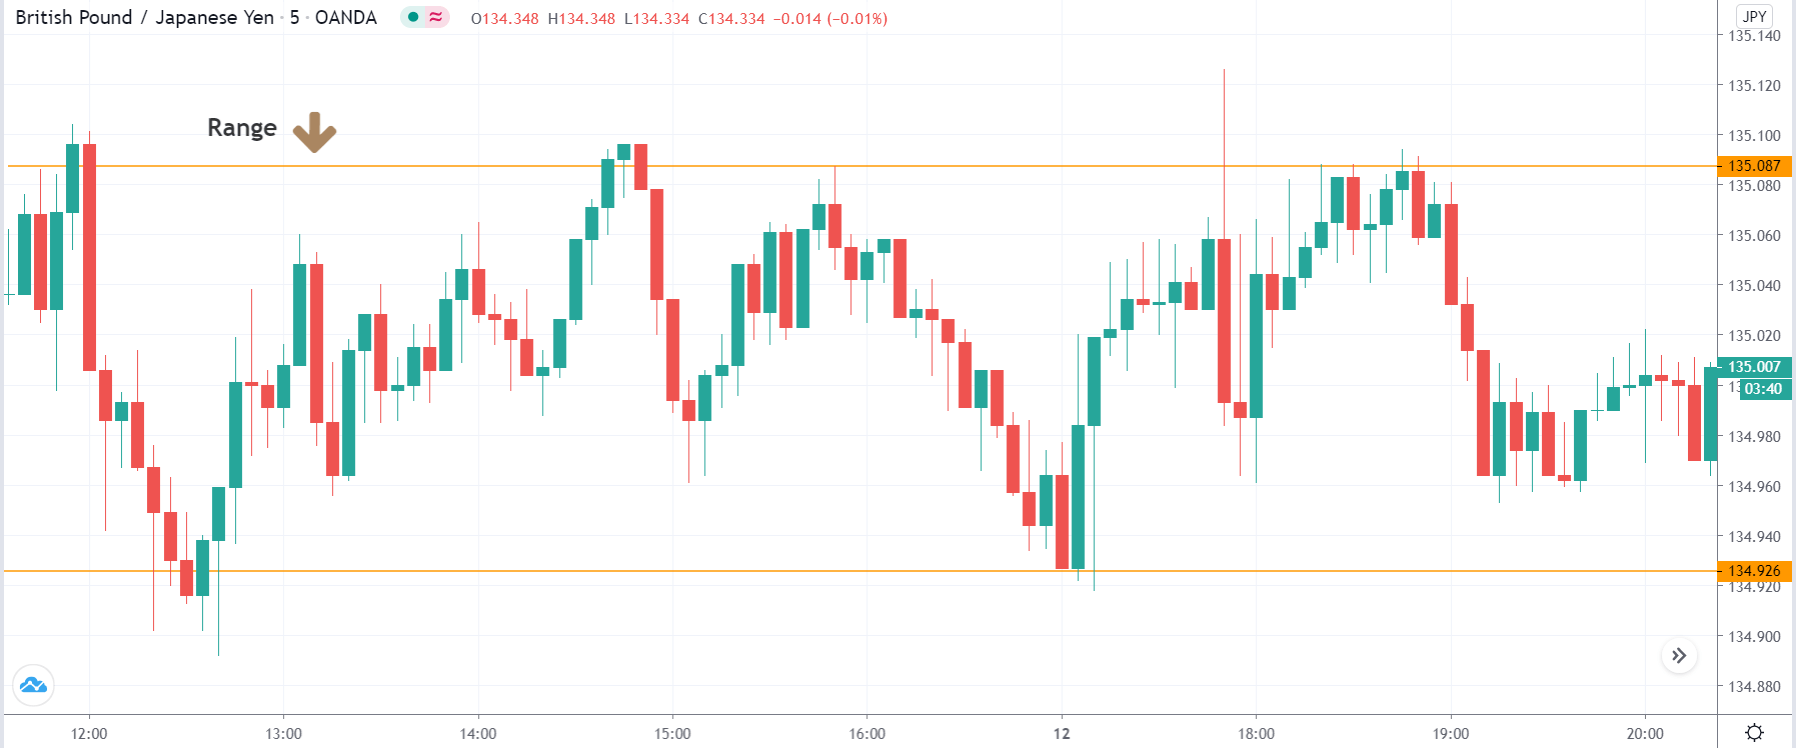
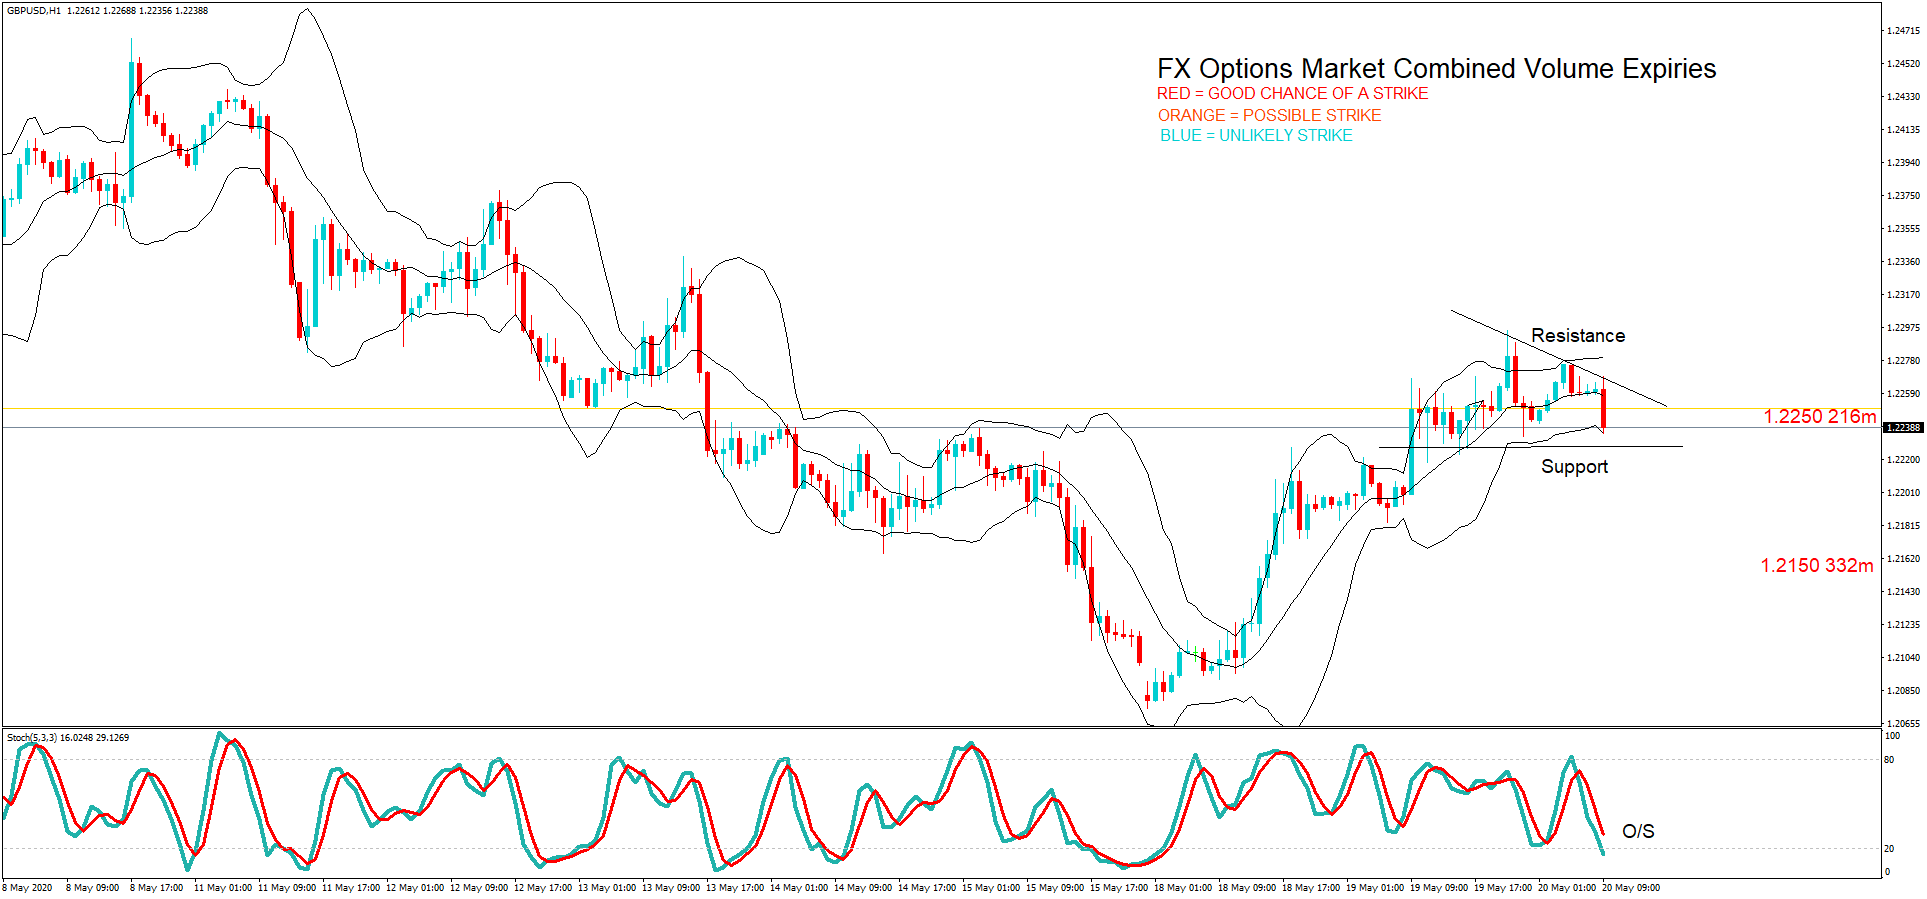
GBP/USD | Before The Announcement

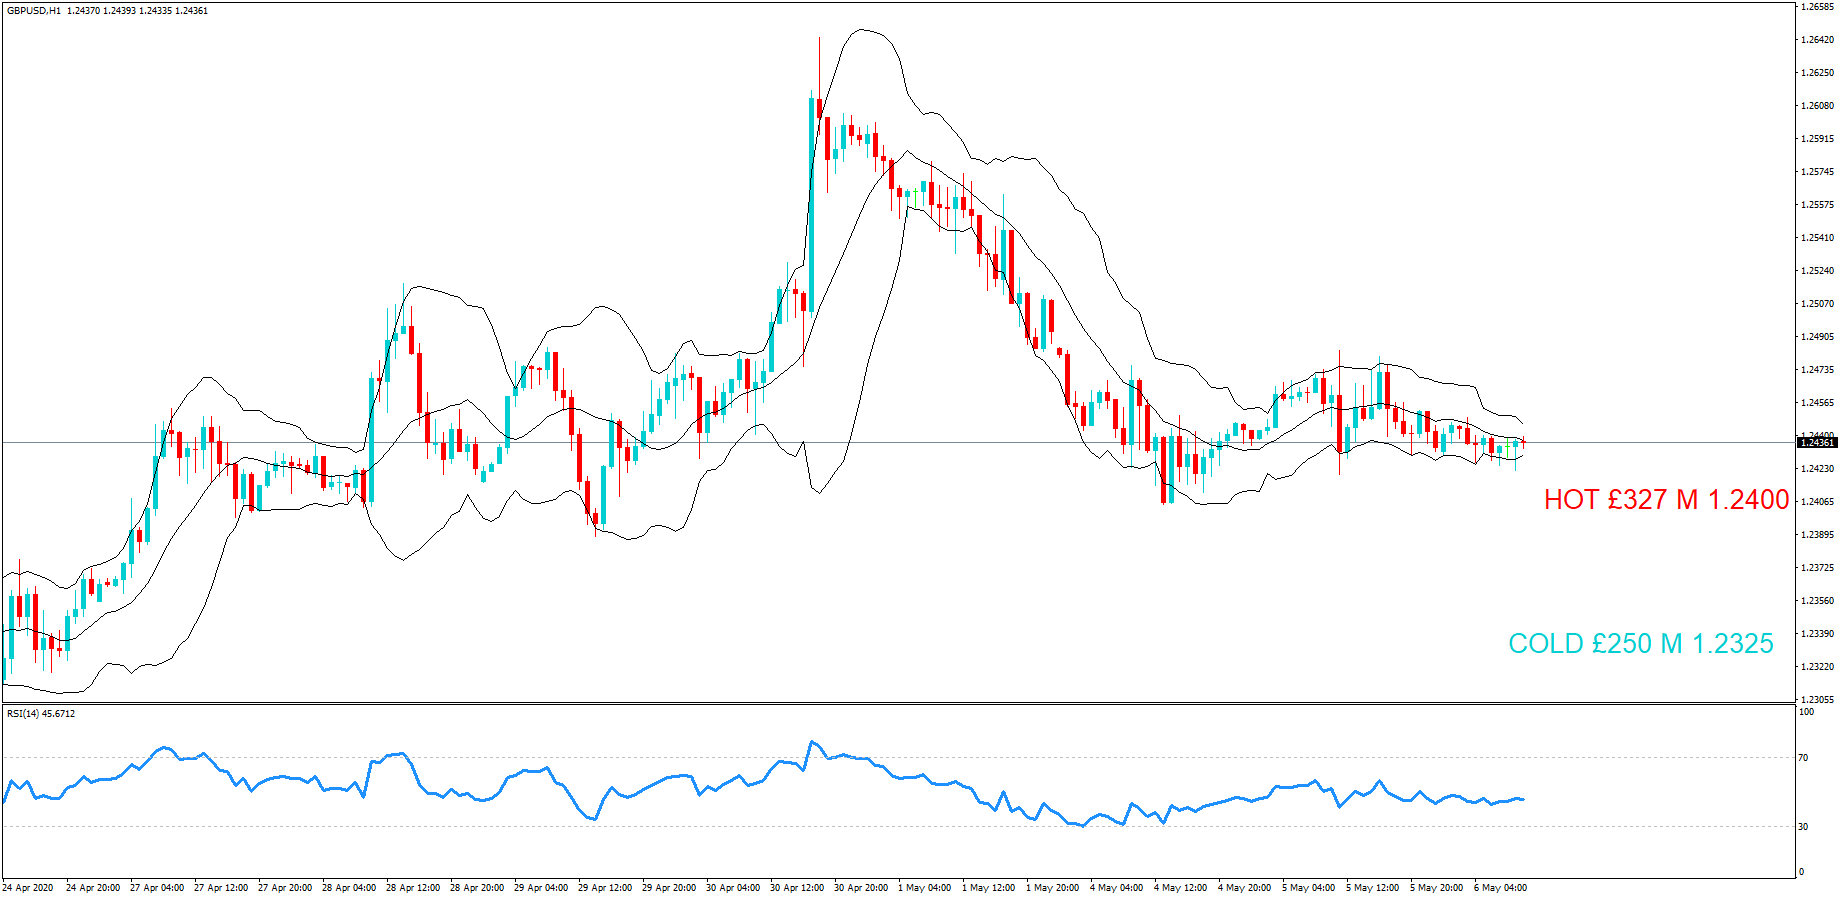
First, we look into the GBP/USD currency pair, where we see that the market is pretty much range-bound, and just before the announcement, price is near the ‘support’ area. The volatility appears to be high both sides, and sudden movement can be expected on any side of the market after the news release. Since the economists have forecasted a lower Consumer Credit this time, as the price is at ‘support’ aggressive traders can enter for a ‘buy’ due to pessimistic expectations. Conservative traders will only be able to take a trade after we get a clear indication from the market.

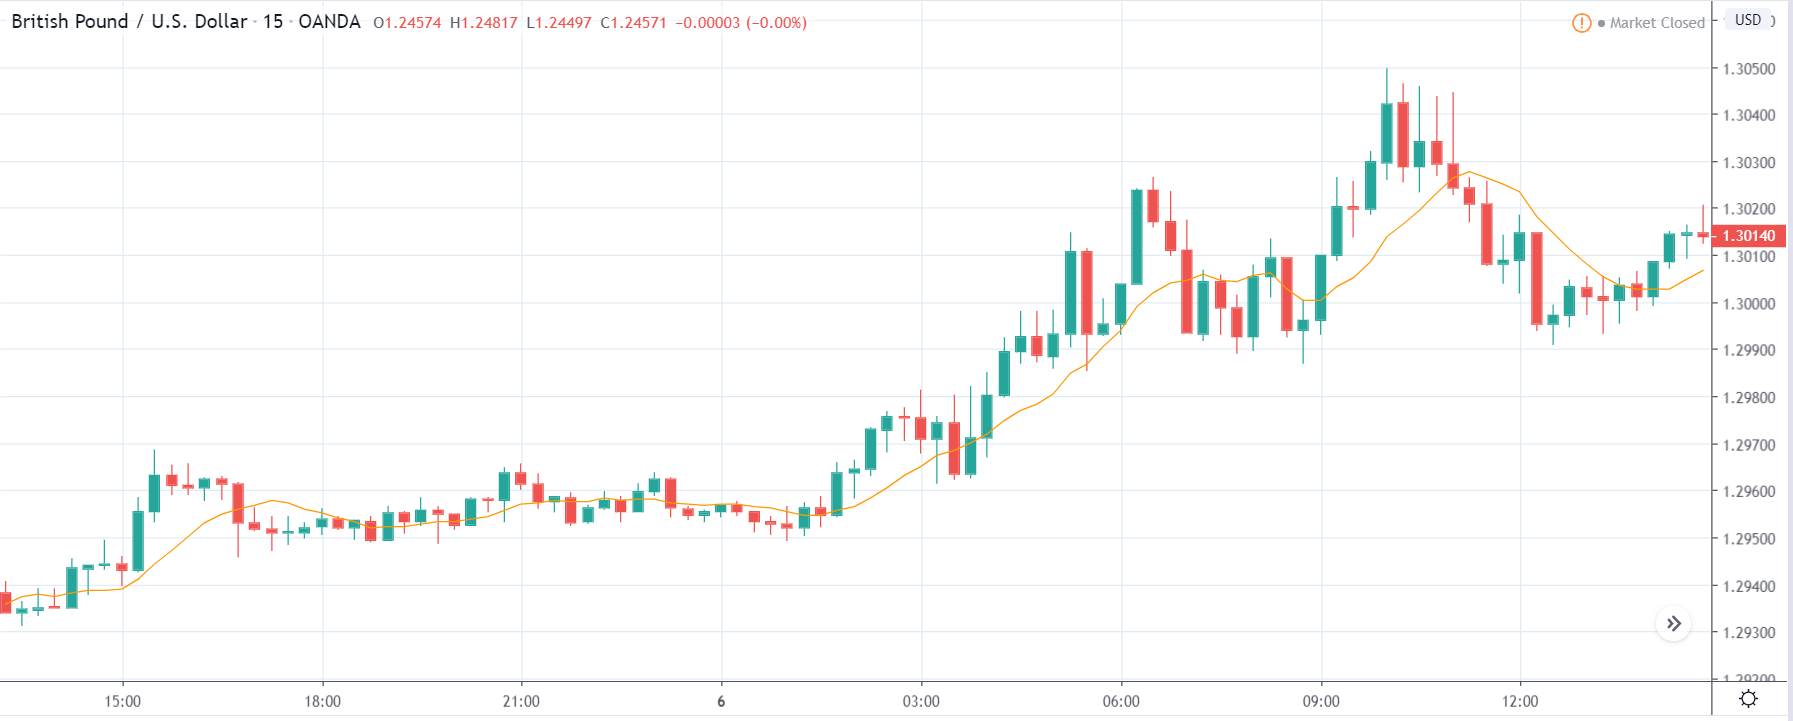
GBP/USD | After The Announcement

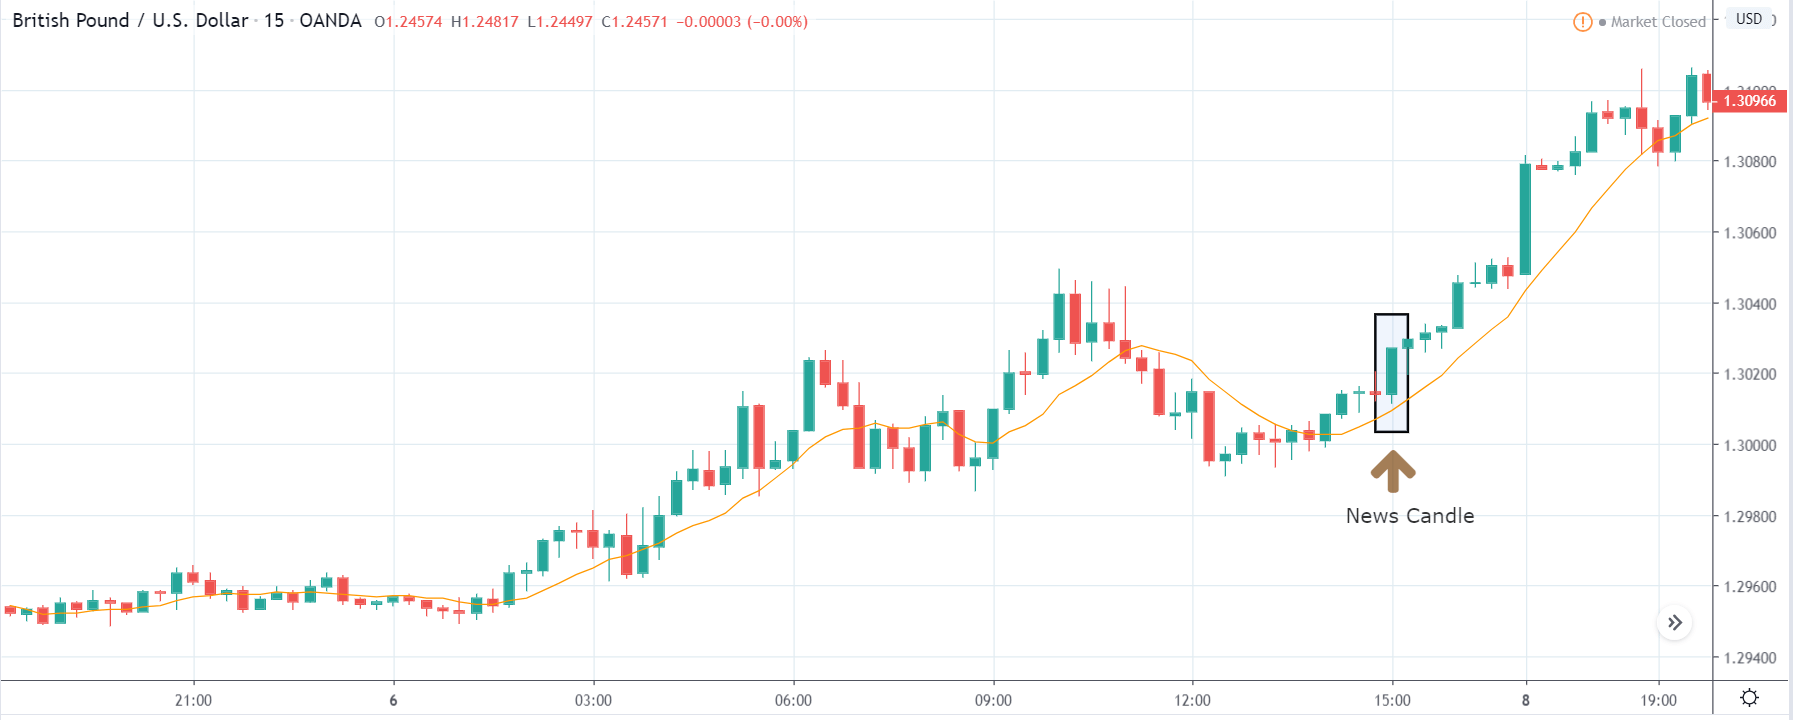
After the Consumer Credit numbers are announced, the market quickly goes higher and shows up a strong bullish candle. The market rightly reacted to the bad Consumer Credit data as the data was much lower than expectations. This made traders and investors sell U.S. dollars, and thus volatility increased on the upside. Now that we have got a clear indication from the market, we can confidently enter for a ‘buy’ as the data was terrible for the U.S. economy. In this case, the market is expected to make new ‘highs,’ and thus, we can hold on our trades as long as we see signs of reversal.

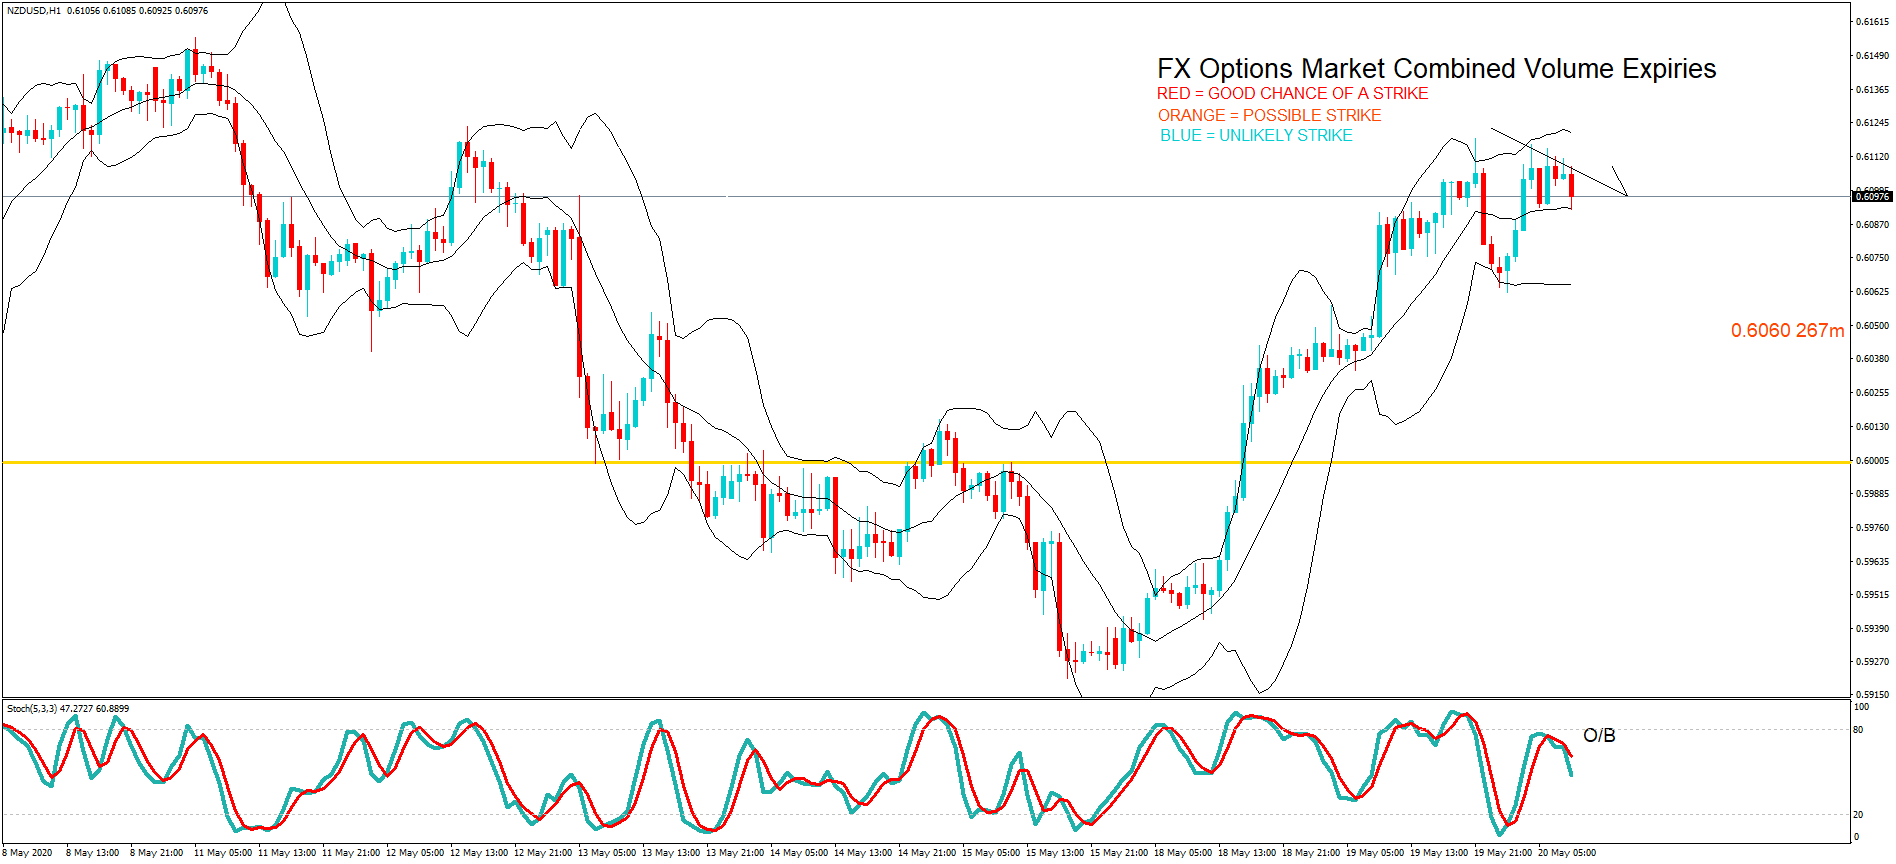
NZD/USD | Before The Announcement

NZD/USD | After The Announcement

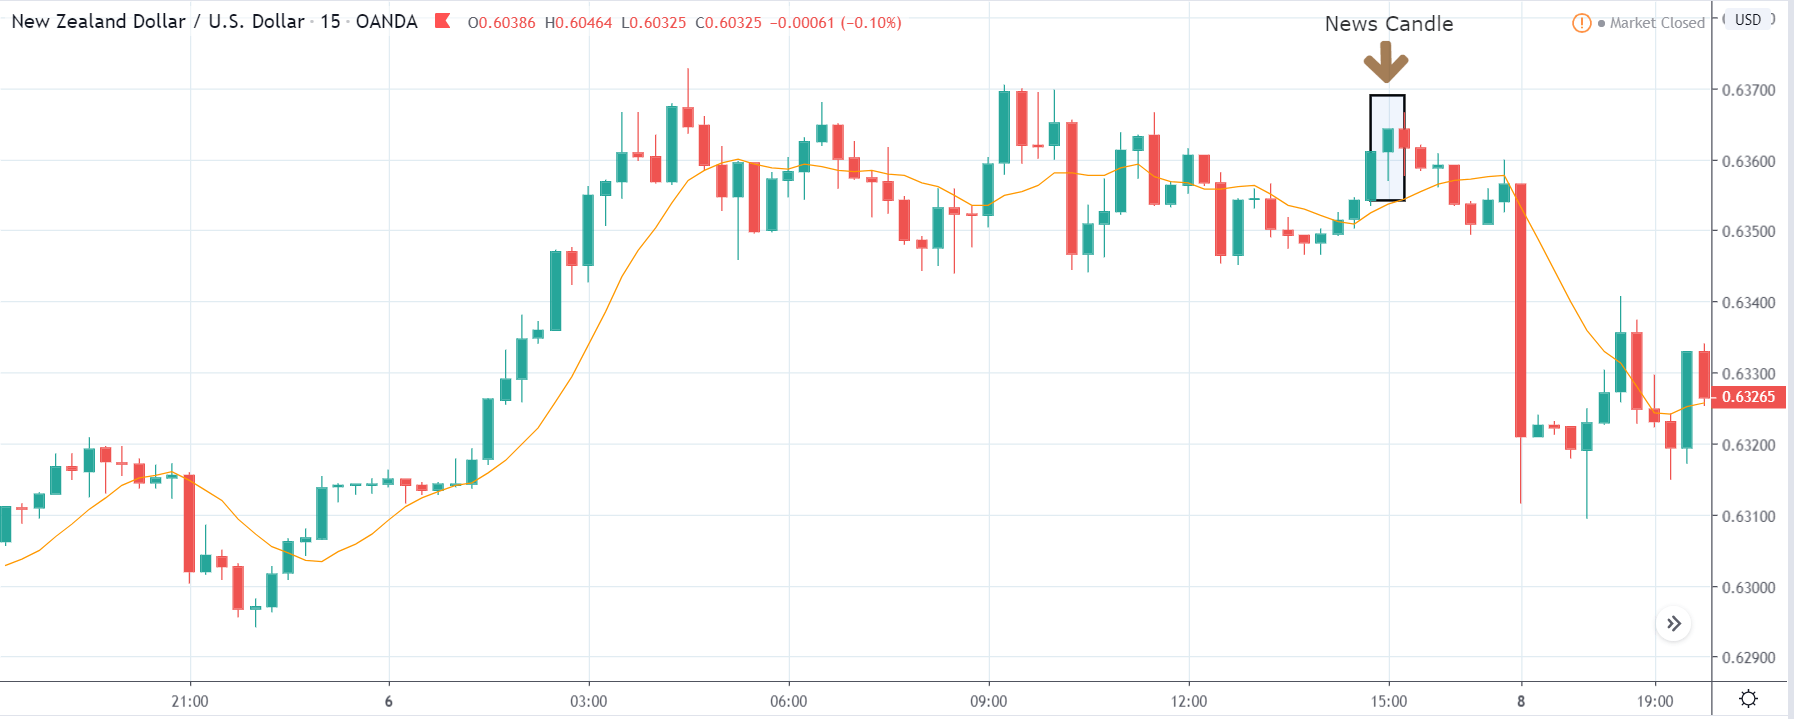
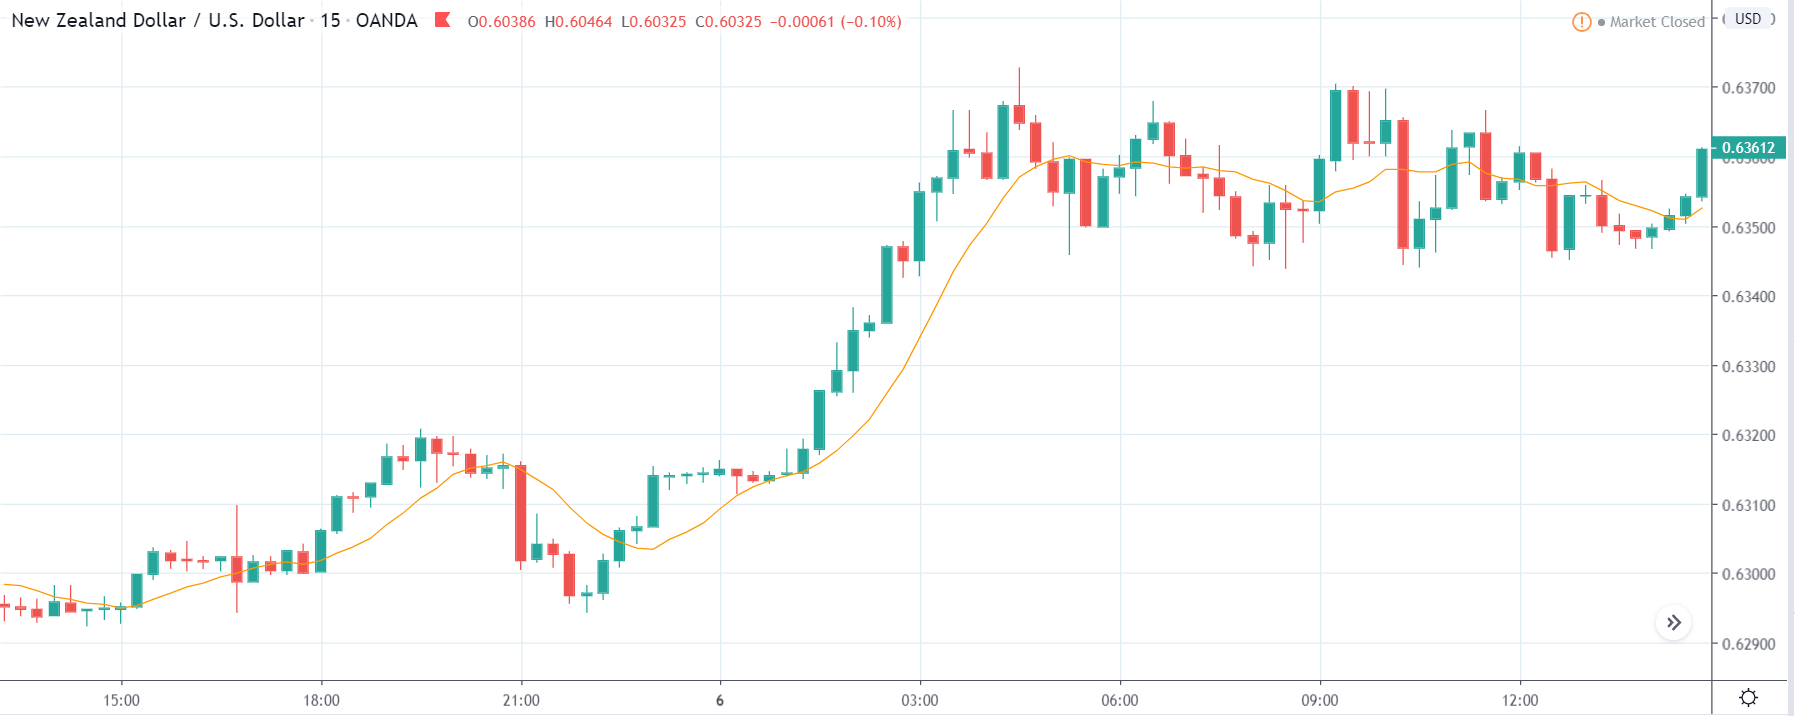
The next currency pair which we will discuss is the NZD/USD pair, and from the first image (before the announcement), we can clearly say that the characteristics of the chart are similar to the previously discussed pair. The reason is that here too, the U.S. dollar is on the right-hand side. One major difference is that, just before the news announcement, price is at the ‘resistance’ area. So, based on the forecasted Consumer Credit numbers, we cannot enter for a ‘buy’ as technically this is where traders sell a currency pair.

After the news release, the price tries to go down, but it gets immediately pushed up, and the candle closes in green. This happens as a consequence of poor Consumer Credit data. In this pair, volatility is seen on both sides after the announcement. However, from a trading point of view, since some selling pressure is seen, it is advised to wait for a breakout above the ‘resistance’ and then go ‘long’ in the market.

USD/SGD | Before The Announcement

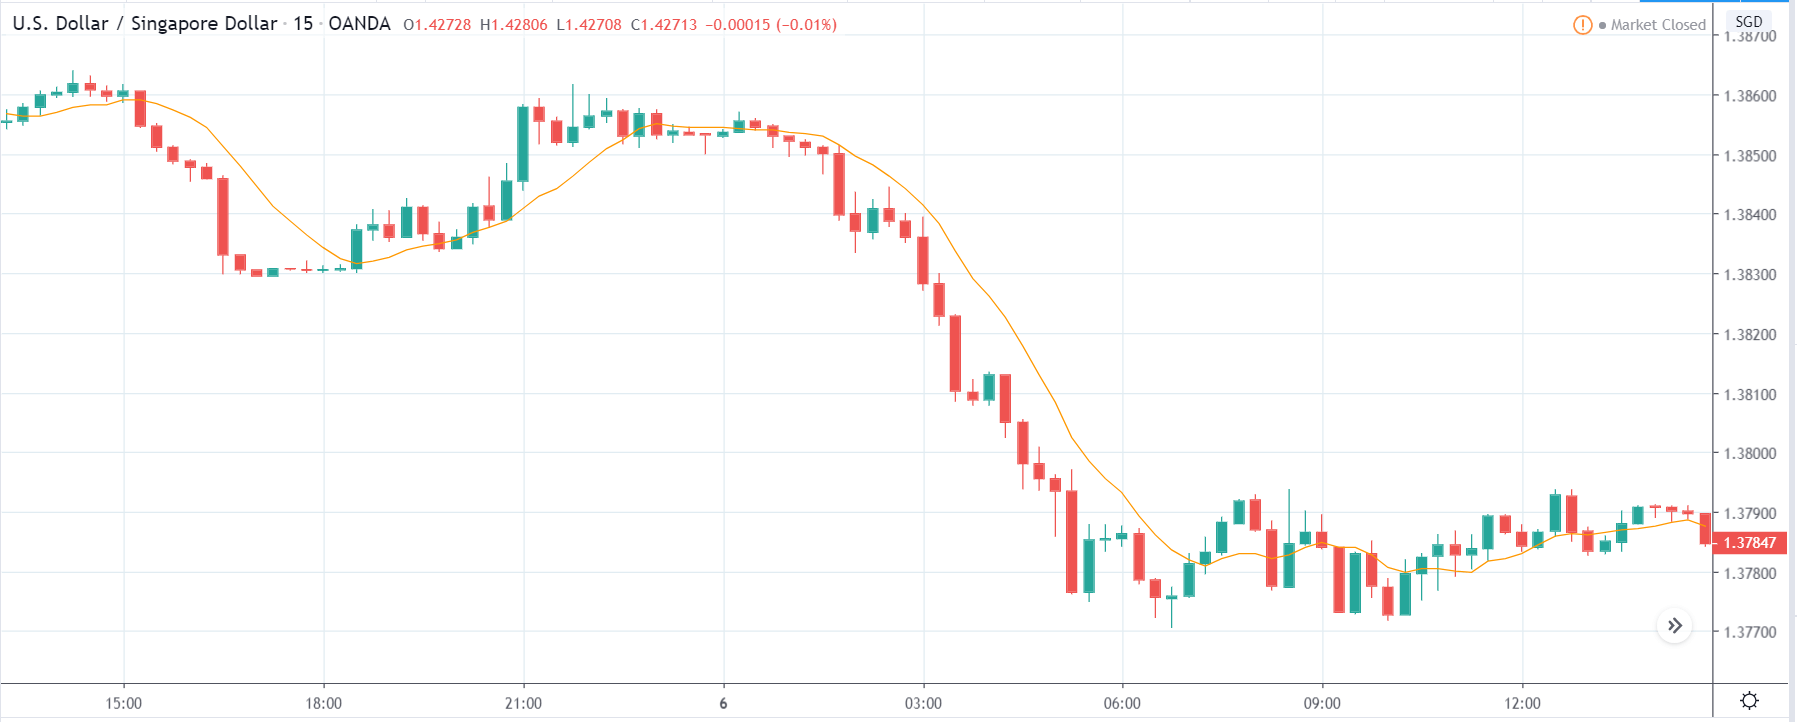
USD/SGD | After The Announcement

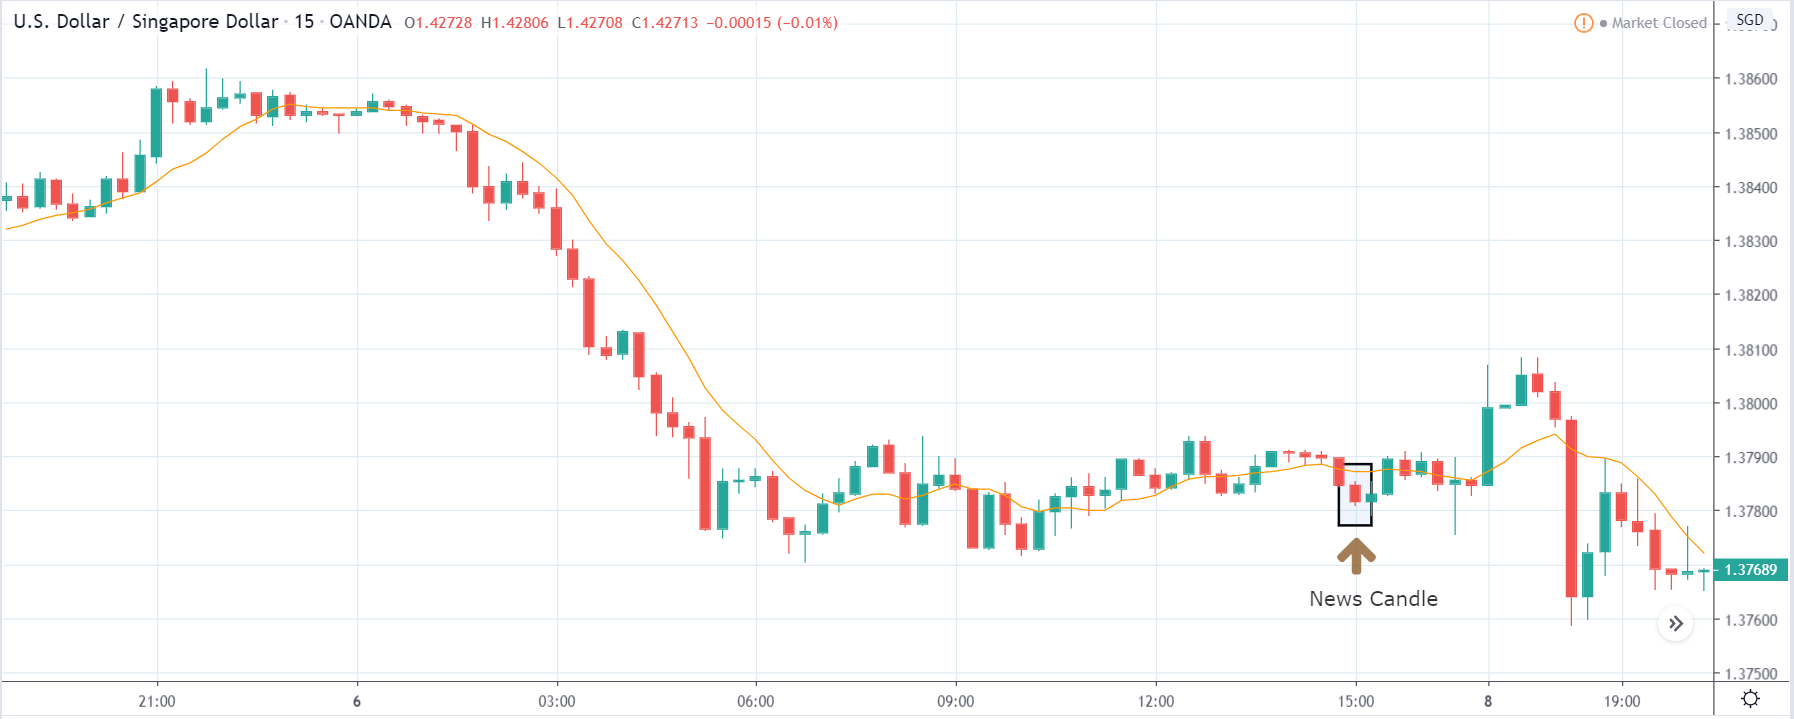
The above images represent the USD/SGD currency pair, and since the U.S dollar is on the left-hand side, we see a down-trending nature of the market and recently is moving in a range. The volatility seems to have slowed a bit before the news announcement, and there are no signs of reversal. Right before the announcement, price is at the bottom of the range, also known as ‘support,’ and hence one cannot go ‘short’ in the pair based on the predicted Consumer Credit data.

We should always use technical analysis along with fundamental analysis to enter a trade. After the news announcement, price falls owing to bad data, but it fails to break the ‘support.’ This illustrates the importance of the amount of impact of an economic indicator on a currency pair. Until the impact is visible, we cannot decide as to which side of the market we should be trading.

That’s about Consumer Credit and the impact of its new release on the Forex market. Please let us know if you have any queries in the comments below. All the best.