GBP Endogenous Analysis – Summary
The GBP endogenous analysis has a score of -9. We can therefore understand that the GBP has depreciated in 2020.

- United Kingdom Employment Change
The UK unemployment change measures the changes in the number of people who are above 16 years and employed. This data is a 3-month moving average of the change in employment, which measures a general trend in the labor industry changes, which typically corresponds to fluctuations in the economy.
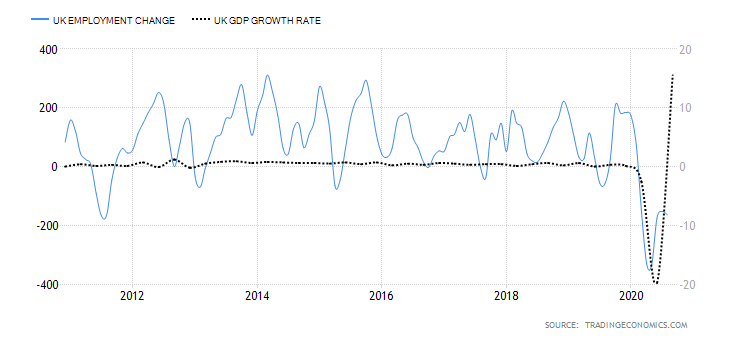
In the three months to September 2020, the number of employed people in the UK dropped by 164,000. The YoY employment change shows a drop of 247,000 jobs, which is the worst in ten years. Based on correlation analysis, we assign a score of -7.
- United Kingdom GDP Deflator
The UK GDP deflator is used as a measure of the comprehensive change in inflation. It filters out any nominal price changes in the entirety of the goods and services produced within the UK.
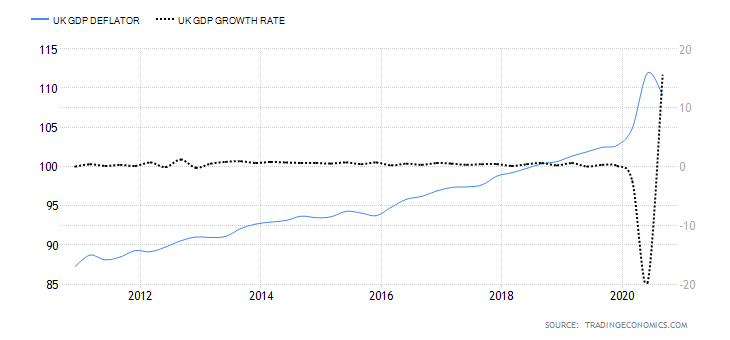
In Q3 of 2020, the UK GDP deflator dropped to 109.12 from 111.9 in Q2 – the highest ever recorded in UK history. The UK GDP deflator has increased by 6.41in 2020. We, therefore, assign a score of 4 based on its correlation with the GDP growth.
- United Kingdom Industrial Production
This indicator tracks the changes in all the firms operating under the industrial sector in the UK. The manufacturing sector accounts for about 70% of the total industrial output. The major components of the manufacturing sector are food, tobacco, and drinks, which account for 11%. The manufacture of transport equipment and basic metals account for 17%, pharmaceuticals and non-metallic 6% each. Quarrying and mining activities account for 12% of the industrial production, with 10% for oil and gas extraction.
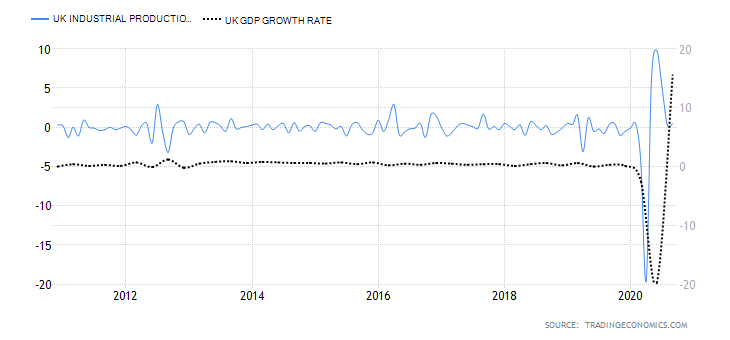
In September 2020, MoM industrial production in the UK rose by 0.5 while YoY dropped by 6.3%. Despite the growth and recovery of industrial activity from the coronavirus pandemic, the output is still 5.6% lower than the pre-pandemic levels. Thus, we assign a score of -3 based on correlation with GDP growth.
- United Kingdom Manufacturing PMI
This index is a result of a survey of about 600 companies in the industrial sector. It is a composite of new orders, which accounts for 30%, output 25%, employment 20%, deliveries from suppliers 15%, and inventory 10%. When the index is above 50, it shows that the manufacturing sector is expanding. Below 50, the manufacturing sector is expected to contract, which impacts the GDP output.
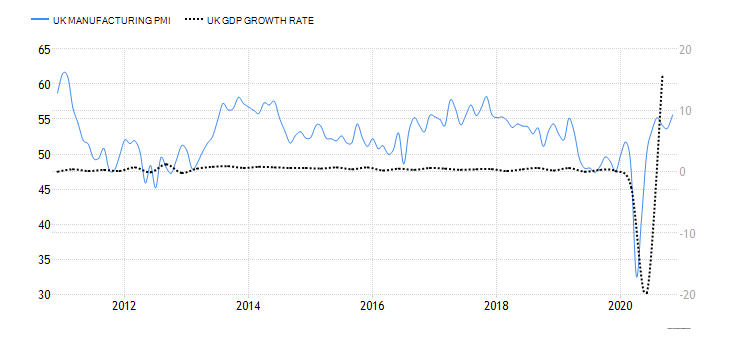
In November 2020, the UK manufacturing PMI was 55.6 – the highest recorded in three years. This was mainly driven by increased inventories and increased new orders as a result of Brexit. We assign a score of 3 based on correlation with the GDP growth rate.
- United Kingdom Consumer Spending
Consumer spending in the UK shows the amount of money that households spent on the purchase of goods and services in the retail sector. Note that expenditure by households is among the primary drivers of GDP growth.
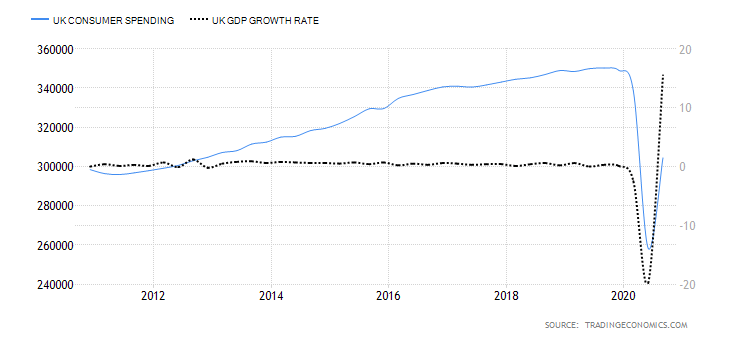
In Q3 of 2020, the UK consumer spending rose to £304.5 billion from £258.32 billion in Q2. This increase is attributed to the restriction imposed at the onset of the coronavirus outbreak, resulting in the economic slowdown. It is, however, still lower than the pre-pandemic levels. Thus, we assign a score of -5 based on correlation with the GDP growth rate.
- United Kingdom Consumer Confidence
In the UK, GfK surveys about 2000 households to establish their opinions about the past and future economic conditions, their financial situation, and prospects of saving. The survey period covers about 12 months into the future, which makes it a leading indicator of consumer spending, and by extension, the overall economy.

In November 2020, the UK consumer confidence dropped to -33 edging closer to yearly lows of -34 registered at the height of the pandemic. We assign a score of -5 based on its correlation with the GDP growth rate.
- United Kingdom Public Sector Net Debt to GDP
This ratio tracks the indebtedness of the UK economy. Based on the economy out, both domestic and foreign investors use the ratio to determine whether the UK can be able to service its debt obligations in the future comfortably.
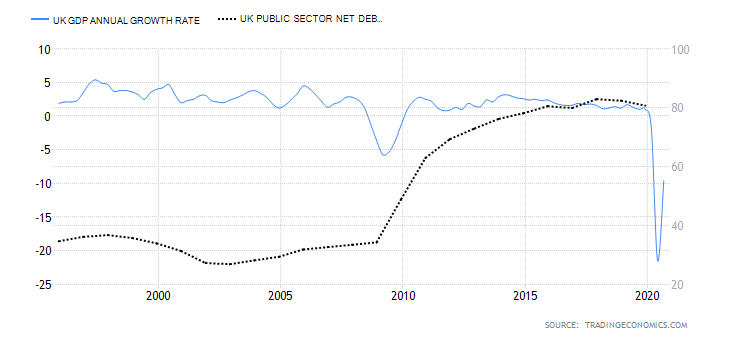
In the financial year 2018 – 2019, the UK’s public sector net debt to GDP was 80.8%, down from 82.4%. In 2020, it is expected to hit 100% with a longer-term average of 91%. We assign a score of 4 since the increased net pubic debt managed to avoid a deeper recession in 2020.
In the next article, we have performed the Exogenous analysis of the EUR/GBP pair and concluded what trend to expect in this currency pair in the near future. Cheers.