Categories
Forex Fundamental Analysis

GBP/CAD Global Macro Analysis – Part 3

GBP/CAD Exogenous Analysis

The UK and Canada Current Account Differential

The current account differential between the UK and Canada can determine if the GBP/CAD pair is bullish or bearish. If the differential is positive, it means that the UK has a higher current account balance than Canada. This would imply that the GBP is in higher demand in the forex market than the CAD; hence, it is a bullish trend for the pair. Conversely, if the current account differential is negative, it means that the UK has a lesser current balance than Canada. It would imply that the GBP has a lower demand than the CAD in the forex market; hence, a bearish trend for the pair.

In Q3 of 2020, the UK had a current account deficit of $20.97 billion while Canada had a $5.83 billion deficit. Thus, the current account differential is -$15.14 billion. We assign a score of -2.

The interest rate differential between the UK and Canada

The interest rate differential is the difference between the Bank of England’s interest rate and that by the Bank of Canada. In the forex market, carry traders use the interest rate differential to decide whether to buy or short a currency pair. When the interest rate differential is positive, traders will earn the differential by going long. If the differential is negative, traders can earn the differential by shorting the currency pair.

Therefore, if the GBP/CAD pair’s interest rate differential is positive, the pair is bound to adopt a bullish trend. Conversely, if negative, the pair is bound to be bearish.

In 2020, the interest rate in the UK dropped from 0.75% to 0.1%. In Canada, the BOC cut interest rates from 1.75% to 0.25%. Therefore, the interest rate differential is -0.15%. The interest rate differential between the UK and Canada has a score of -1.

The differential in GDP growth rate between the UK and Canada

This differential measures the changes in the growth rate between the two economies. It is a preferred method of comparison since economies are of different sizes. Naturally, the economy with a higher GDP growth rate will have its currency appreciate more. Therefore, if the GDP growth rate differential is positive, it means that the GBP/CAD pair is bullish. If negative, then the pair is bearish.

During the first three quarters of 2020, the UK economy has contracted by 5.8%, while the Canadian economy has contracted by 3.3%. This makes the GDP growth rate differential -2.5%. Hence, a score of -1.

Conclusion

Indicator Score Total State Comment
The UK and Canada Current Account Differential -2 10 A differential of – $15.14 The UK has a higher deficit than Canada
The interest rate differential between the UK and Canada -1 10 -0.15% Expected to remain at -0.15% until either economy have recovered
The differential in GDP growth rate between the UK and Canada -1 10 3.30% The Canadian economy contracted at a slower pace than the UK economy
TOTAL SCORE -4

The cumulative score for the exogenous factors is -4. This means that we can expect the GBP/CAD pair to trade in a downtrend in the short term.

However, technical analysis shows the pair adopting a bullish trend with the weekly chart trading above the 200-period MA. More so, the pair is seen bouncing off the lower Bollinger band. Keep an eye on the near-term changes in the exogenous factors.

Categories
Forex Fundamental Analysis

GBP/CAD Global Macro Analysis – Part 1 & 2

Introduction

This analysis will evaluate the endogenous factors that affect the domestic economy in both the UK and Canada. We’ll also cover exogenous factors that influence the price of the GBP/CAD pair.

Ranking Scale

After analysis, we will rank both the exogenous and the endogenous factors on a scale from -10 to +10.

Endogenous factors will be ranked after a correlation analysis with the GDP growth rate. If negative, it means that either the GBP or the CAD have depreciated. If positive, it means that the domestic currency has appreciated.

The exogenous factors are ranked based on their correlation with the GBP/CAD pair’s exchange rate. When negative, it means that the price will drop. The price will be expected to increase if the exogenous analysis is positive.

Summary – GBP Endogenous Analysis

-15 score on Pound’s Endogenous Analysis indicates that this currency has depreciated since the beginning of 2020.

Summary – CAD Endogenous Analysis

  • Canada Employment Rate

The Canadian employment rate measures the percentage of the labor force that is employed during a particular period. The developments in the labor market are a leading indicator of overall economic growth. When the economy is expanding, there are more job openings, hence a higher employment rate. Conversely, when the economy is going through a recession, businesses close down, leading to a dropping employment rate.

In November 2020, the employment rate in Canada rose to 59.5% from 59.4% in October. Although the employment rate has been steadily increasing from the lows of 52.1% in April, it is still lower than in January. Canada’s employment rate has a score of -6.

  • Canada Core Consumer Prices

This index measures the overall change in Canada’s inflation rate based on a survey of price changes for a basket of consumer goods. The rate of inflation gauges the increase in economic activity. Typically, when demand is depressed in an economy, prices drop, resulting in lower inflation. Conversely, when demand increases, prices tend to increase, resulting in a higher rate of inflation.

In November 2020, Canada’s core consumer prices rose to 136.6 points from 136.3 in October. Between January and November, the index has increased by 2 points. It has a score of 3.

  • Canada Manufacturing Production

This index measures the YoY change in the value of the output from the Canadian manufacturing sector. Canadian manufacturing is a significant contributor to the labor market and economic growth. In the age of the coronavirus disruption, changes in manufacturing production show how faster the economy is bouncing back.

In September 2020, the YoY manufacturing production in Canada dropped by 4.24%. This is an improvement compared to the 5.34% drop recorded in August. Canadian manufacturing production has a score of -2.

  • Canada Business Confidence

The Ivey Purchasing Managers Index (PMI) measures monthly business confidence in Canada. In the survey, private and public companies rate whether the current business activity is higher or lower than the previous month. The index survey aspects including inventories, purchases, deliveries from suppliers, output prices, and employment.

When the index is over 50, it means that purchases have increased from the preceding month. Reading of below 50 shows a decrease in purchases.

In November 2020, Canadian business confidence dropped to 52.7 from 54.5 in October. This was the lowest reading since May, when the economy began rebounding from the shocks of  COVID-19. Consequently, Canada’s business confidence has a score of 1.

  • Canada Consumer Spending

This measures the final market value of all household expenditures on goods and services. It also includes expenditure by non-profit organizations that serve households in Canada but excludes purchases of homes. Consumer spending plays a critical role in economic growth.

In Q3 of 2020, consumer spending in Canada rose to CAD 1.13 trillion from CAD 1 trillion in Q2. However, it is still lower than consumer spending recorded in Q1. Thus, Canada’s consumer spending has a score of -4.

  • Canada New Housing Price Index

The Canadian NHPI measures the changes in the selling price of newly built residential houses. The price measured is that paid by the home buyers to the contractors. Note that the price comparison is strictly between houses of the same specification. The NHPI shows the construction sector’s growth trends; hence, it corresponds to changes in the labor market and GDP growth.

In November 2020, the Canadian NHPI rose to 107.9 from 107.3 in October. Thus, we assign a score of 3.

  • Canada Government Budget Value

This indicator tracks the changes in the difference between the Canadian government revenues and expenditures. It shows whether the government is running a surplus or a deficit. It also breaks down the changes in the receipts by the government. This helps to show how the overall economy is fairing.

In October 2020, the Canadian government budget had a deficit of CAD 18.51 billion compared to CAD 27.59 billion in September. Throughout the year, the budget deficits have been due to the economic shocks brought on by the coronavirus pandemic. The Canadian government had to ramp up expenditure through its Economic Response Plan, while revenues dropped in the same period. We assign it a score of -5.

Conclusion

Indicator Score Total State Comment
Canada Employment Rate -6 10 59.5% in November 2020 The employment rate is steadily increasing. It is, however, still below January levels
Canada Core Consumer Prices 3 10 136.6 points in November 2020 Since January, it has increased by 2 points. That shows demand in the economy has kept prices higher
Canada Manufacturing Production -2 10 YoY dropped by 4.24% in September 2020 A slight increase from -5.34% recorded in August. This shows that the manufacturing production is returning to the pre-pandemic levels
Canada Business Confidence 1 10 52.7 in November November level was the lowest since the economy began to recover in May. It’s expected to improve as mass vaccinations against COVID-19 rolls out
Canada Consumer Spending -4 10 Was CAD 1.13 trillion Q3 2020 Recovered from CAD 1 trillion in Q2 but still lower than Q1. This shows that demand is increasing in the economy
Canada New Housing Price Index 3 10 November NHPI was 107.9 It has been increasing, which shows that output in the construction industry is improving
Canada Government Budget Value -5 10 a budget deficit of CAD 18.51 billion in October The deficit widened in 2020, driven by unprecedented fiscal policies to curb recessionary pressure from the pandemic
TOTAL SCORE -10

A score of -10 indicates that the CAD has depreciated since the beginning of the year 2020.

In the next article, you can find the exogenous analysis of GBP/CAD where we have forecasted this pair’s future price movements. Cheers.

GBP/CAD Exogenous Analysis

  • The UK and Canada Current Account Differential

The current account differential between the UK and Canada can determine if the GBP/CAD pair is bullish or bearish. If the differential is positive, it means that the UK has a higher current account balance than Canada. This would imply that the GBP is in higher demand in the forex market than the CAD; hence, it is a bullish trend for the pair. Conversely, if the current account differential is negative, it means that the UK has a lesser current balance than Canada. It would imply that the GBP has a lower demand than the CAD in the forex market; hence, a bearish trend for the pair.

In Q3 of 2020, the UK had a current account deficit of $20.97 billion while Canada had a $5.83 billion deficit. Thus, the current account differential is -$15.14 billion. We assign a score of -2.

The interest rate differential is the difference between the Bank of England’s interest rate and that by the Bank of Canada. In the forex market, carry traders use the interest rate differential to decide whether to buy or short a currency pair. When the interest rate differential is positive, traders will earn the differential by going long. If the differential is negative, traders can earn the differential by shorting the currency pair.

Therefore, if the GBP/CAD pair’s interest rate differential is positive, the pair is bound to adopt a bullish trend. Conversely, if negative, the pair is bound to be bearish.

In 2020, the interest rate in the UK dropped from 0.75% to 0.1%. In Canada, the BOC cut the interest rate from 1.75% to 0.25%. Therefore, the interest rate differential is -0.15%. The interest rate differential between the UK and Canada has a score of -1.

  • The differential in GDP growth rate between the UK and Canada

This differential measures the changes in the growth rate between the two economies. It is a preferred method of comparison since economies are of different sizes. Naturally, the economy with a higher GDP growth rate will have its currency appreciate more. Therefore, if the GDP growth rate differential is positive, it means that the GBP/CAD pair is bullish. If negative, then the pair is bearish.

During the first three quarters of 2020, the UK economy has contracted by 5.8%, while the Canadian economy has contracted by 3.3%. This makes the GDP growth rate differential -2.5%. Hence, a score of -1.

Conclusion

Indicator Score Total State Comment
The UK and Canada Current Account Differential -2 10 A differential of – $15.14 The UK has a higher deficit than Canada
The interest rate differential between the UK and Canada -1 10 -0.15% Expected to remain at -0.15% until either economy have recovered
The differential in GDP growth rate between the UK and Canada -1 10 3.30% The Canadian economy contracted at a slower pace than the UK economy
TOTAL SCORE -4


The cumulative score for the exogenous factors is -4. This means that we can expect the GBP/CAD pair to trade in a downtrend in the short term. However, technical analysis shows the pair adopting a bullish trend with the weekly chart trading above the 200-period MA. More so, the pair is seen bouncing off the lower Bollinger band.

Keep an eye on the near-term changes in the exogenous factors.


Categories
Beginners Forex Education Forex Assets

Fundamentals of the British Pound

The British pound, whose use spans across more than 5000 years, is the oldest currency in the world. Originating from continental Europe under the Roman era, the official currency of the today’s United Kingdom was once also a unit of currency in Anglo-Saxon England, equivalent to 1 pound weight of silver, dating back to as early as 775 AD. Derived from the Latin word poundus which translates as weight, the name of the currency we use today is still in use. 

The symbol £ comes from an ornate L in Libra, whereas the ISO code under which it is recognized globally is GPB. Unlike other currencies, the GBP has endured such a vast portion of history and now tells a tale of how a currency once set the grounds for the future. In 928, the first King of England, Athelstan, adopted sterling as the first national currency, and one unit of the currency could actually buy off 15 heads of cattle. The name sterling, however, came to use only after the Norman Conquest, initially referring only to pennies and not pounds. This anterior name is of vague origin due to its connections to esterlin, a Norman word for little star, and lesterling, an Arab word meaning money

In the late 1600s, upon suffering naval defeat in the Battle of Beachy Head, King William III established the Bank of England to fund the war with France. As the first central bank ever created, the Bank of England and the British helped create laws and principles which are today considered essential for regulating currencies. In 1717, for the first time in history, the country defined the currency’s value in terms of gold rather than silver, and the gold price of £4.25 per fine ounce set by Sir Isaac Newton lasted throughout most of the following two hundred years. 

The country first adopted the gold standard in the 1800s, supporting the idea that the nation should back up its currency with an equivalent quantity of gold reserves. The United Kingdom briefly left the gold standard in 1914 to support itself during the war, yet the heavy borrowing led to high inflation that considerably devalued the pound. In 1925, Winston Churchill returned to the gold standard only to come off of it a few years later, in 1931, when the sterling once again underwent a significant drop. The 20th century gave birth to another nickname of the GDP, the cable, due to the creation of the first trans-Atlantic telecommunications cable used for stock exchanges between New York City and London. The term became part of today’s vernacular to the extent that the phrase what’s the quote on the cable is understood easily as the interest in knowing how many dollars are needed to buy pounds. 

Overall, the British pound holds so much history and truly embodies the qualities of an enduring currency. The British were the first to put together a stable government and currency, which remained a safe haven for hundreds of years. Nowadays, the GBP has lost its previous value and power as it stands approximately third in reserves, right behind the USD and the EUR. The 2016 Brexit led to one of the worst falls of the GBP in history and the attempts to foretell the future of this once great currency seem more challenging than ever before.

The Bank of England

Under the rule of King William and Queen Mary, upon the issuance of the 1694 Royal Charter, the Bank of England was founded in the hope of promoting stability and providing benefits to the people, which are still held as dominant values of the institution. As one of the longest central banks in its entire existence, created right after the Swedish Riksbank, the Bank of England (BoE) served as a model for other central banks around the world. Today the bank’s responsibilities include the issuance of banknotes, control of the country’s gold reserves, and setting the official interest rates. The BoE has a dual mandate consisting of two main objectives – monetary stability and economic stability. The former involves influencing interest rates so as to deliver the objectives of the Monetary Policy Committee (MPC), whereas the latter entails ensuring liquidity, together aimed at promoting growth and employment in the British economy. 

While the Bank of England bears the responsibility for printing money, it only includes the territory of the United Kingdom, while Ireland, which uses the EUR, is exempt from its authority. What is more, the BoE issues notes in both England and Wales, but Scotland and Northern Ireland can also do the same through several other banks. Coins are, however, manufactured by the Royal Mint, an export mint located in Llantrisant, South Wales. Since its opening by the Queen in 1968, the Royal Mint has been in charge of making and distributing the United Kingdom coins and supplying blanks and official medals. This government-owned institution now makes coins and medals for approximately 60 countries a year. 

Another important segment of the bank involves the Monetary Policy Committee (MPC) that consists of nine members – the Governor, the three Deputy Governors for Monetary Policy, Financial Stability and Markets and Banking, the Chief Economist, and four external members appointed directly by the Chancellor. These members are selected based on their expert knowledge of economics and monetary policy in order to decide on the best monetary policy action for the Bank of England to keep inflation low and stable. As of March 16, 2020, Andrew Bailey is the Governor, replacing Mark Carney. The new Governor was said to be the favorite choice in a number of media due to his extensive experience in the field of banking and, in particular, previous responsibilities and successes at the Bank of England. 

Some say that the BoE has been the main pillar of support of the United Kingdom during the past crises. The country’s economy is believed to fall into crisis approximately every 70 years and some past events, such as the Great Fire of London or the aftermath of the tea hegemony collapse, can support this viewpoint. It appears that every time the economy collapses the Bank of England steps in to provide support and safeguard the country and the currency against complete destruction. The Bank of England now has another task of helping the UK’s economy withstand the outcomes of Brexit-related decisions, which will be discussed later in the text, as one of the strongest factors impacting the country in the past few years.

UK Economic Reports

  • GDP Report

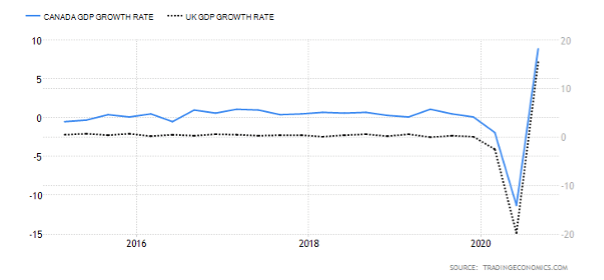
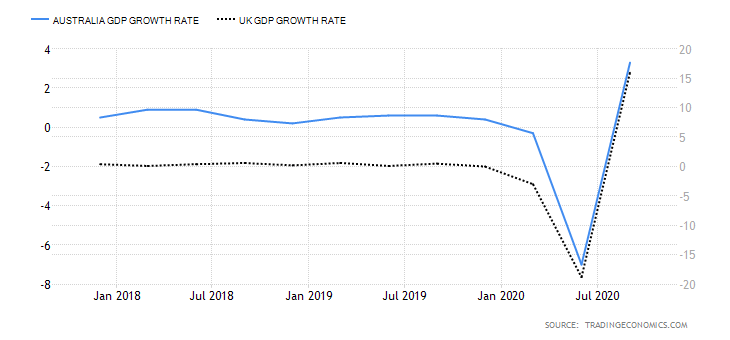
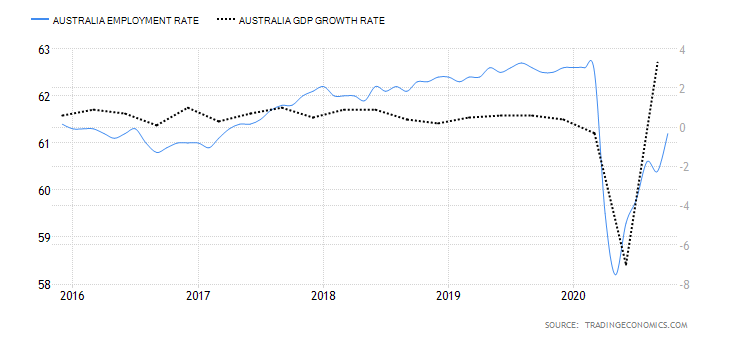
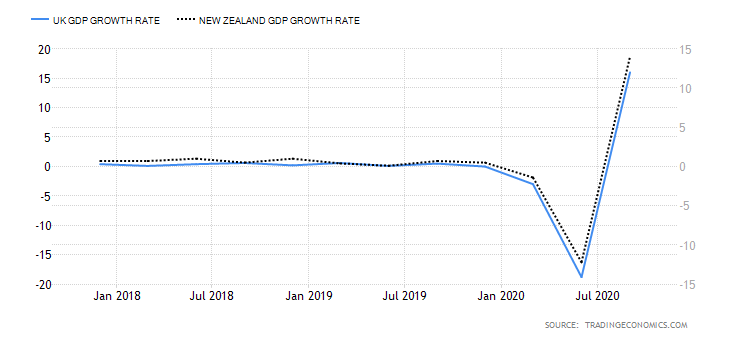
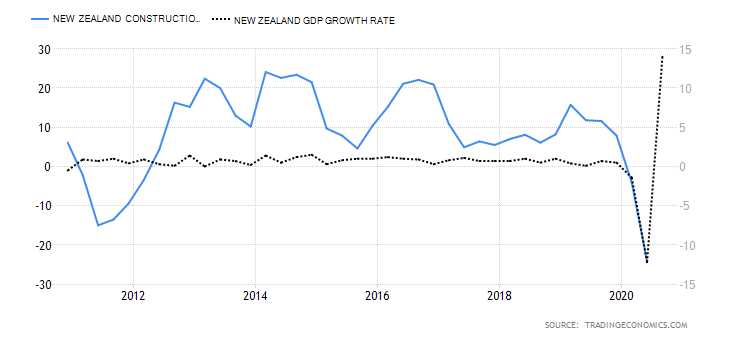
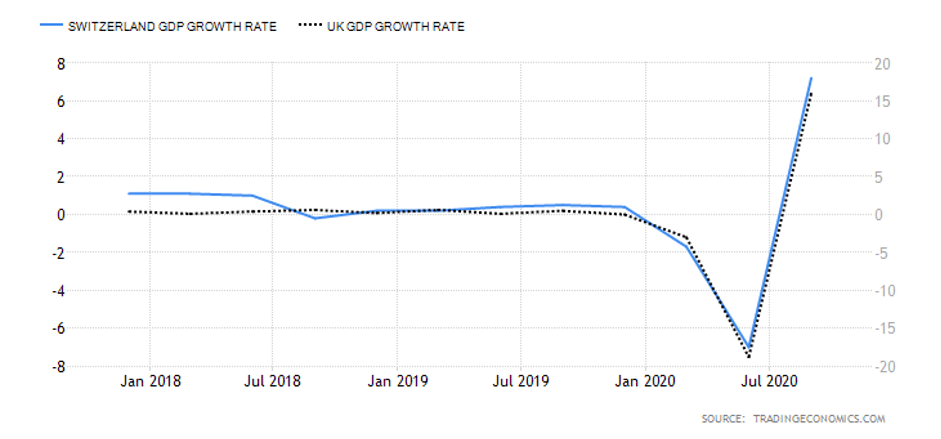
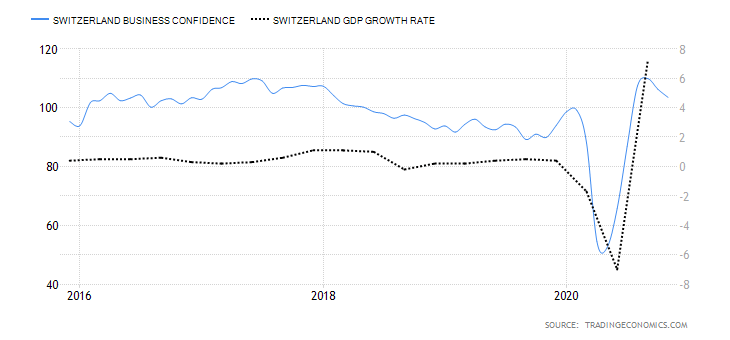
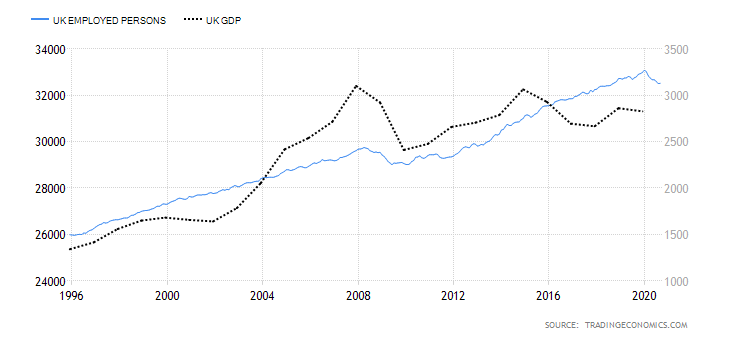
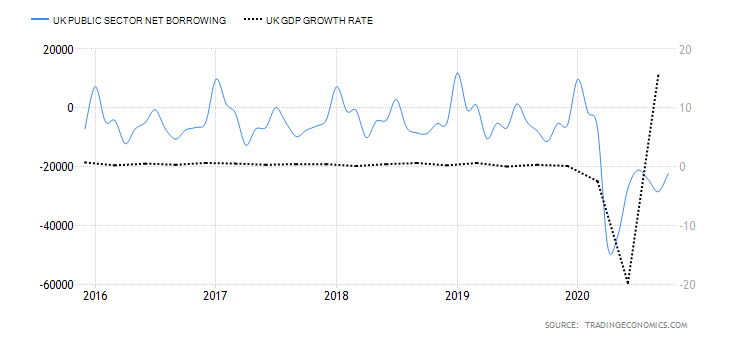
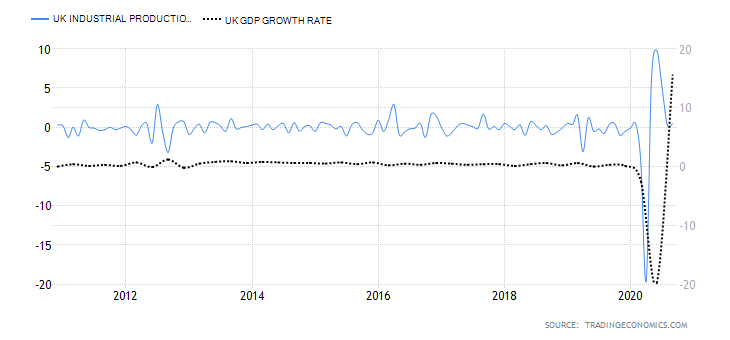
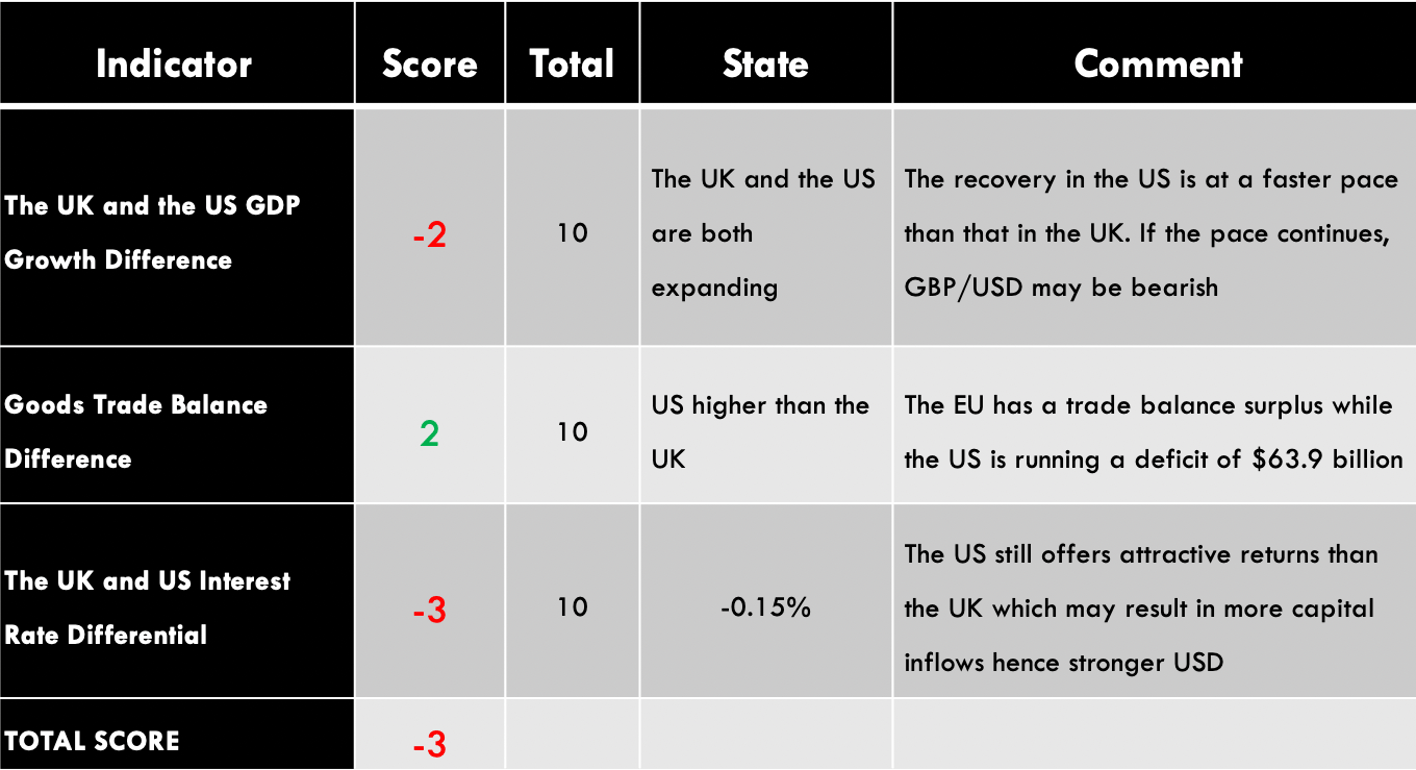
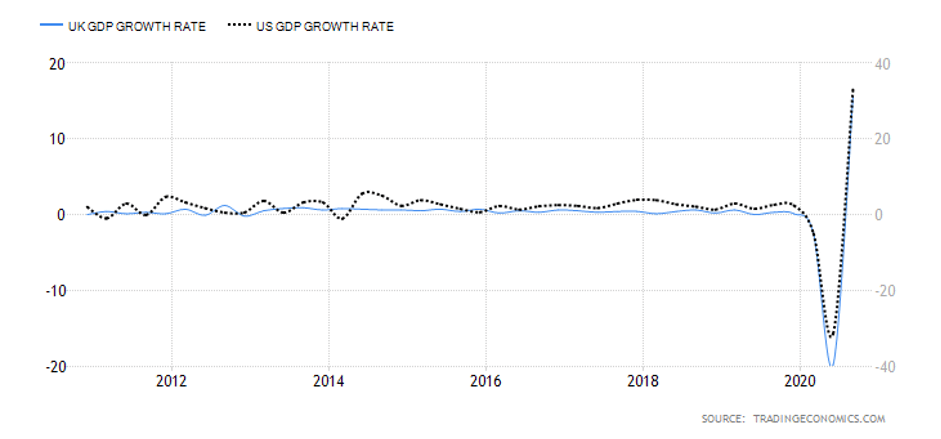
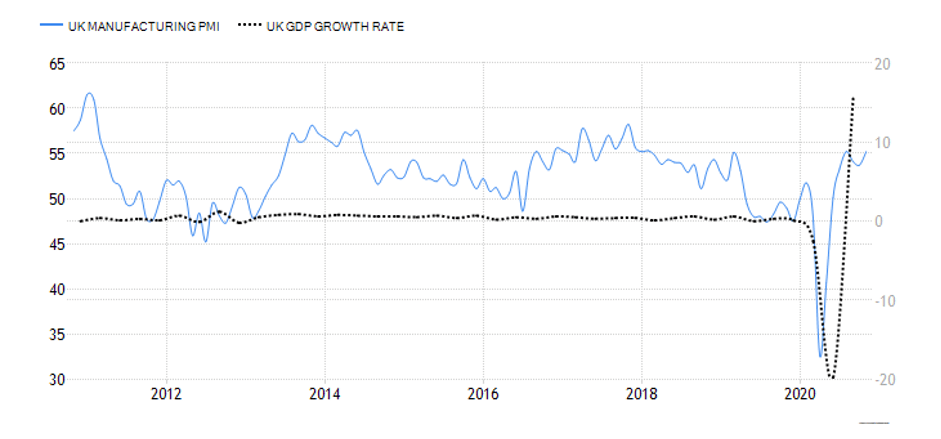
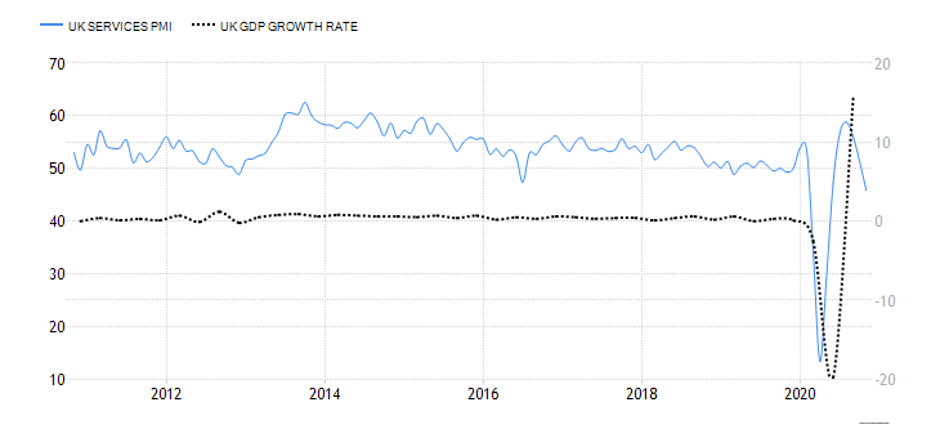
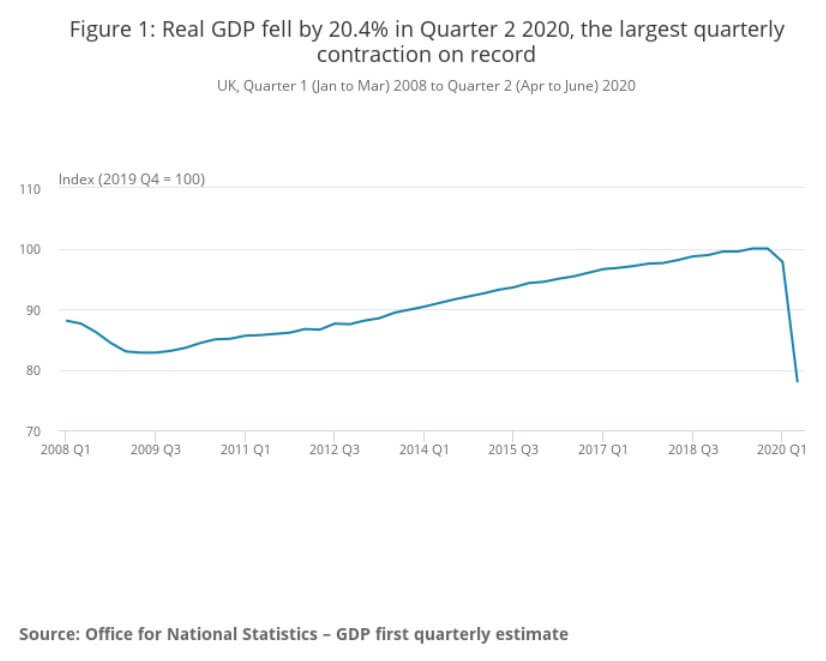
The GDP reports come out in three stages: the initial, the actual, and the final. Similar to the US GDP reports, the preliminary estimate is the most relevant piece of information as it first produces insight into the country’s economy. At the same time, this initial GDP report is also the least accurate, which is why the data is then revised in the following two reports. The current data shows how GDP is estimated to have fallen by a record of 20.4% in Quarter 2 (April to June), which was the second quarterly decline in a row after falling by 2.2% in the first quarter (January to March) this year. Despite the poor performance in the second quarter, the UK’s economy did see some improvement in June upon the easing of governmental decisions on lockdown (see the chart below). Currently seen as the worst in all G-7 states, the country’s GDP is estimated to fall by 8.3% in 2020, with a 6% annual growth rate anticipated in 2021. The UK’s economy is believed to rely heavily on social outdoor activities and the implications of the pandemic and related decisions can already be felt, as seen from the latest GDP report.

  • Claimant Count Change

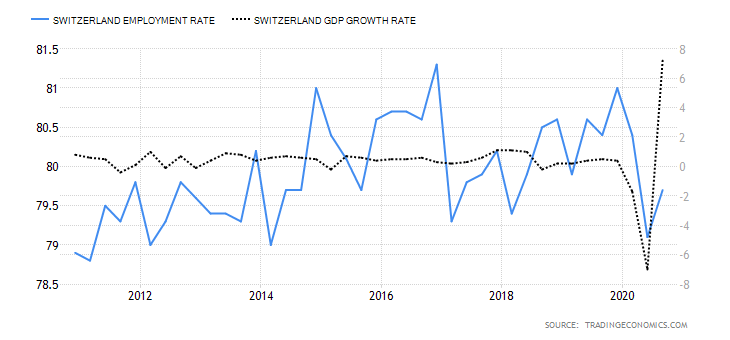
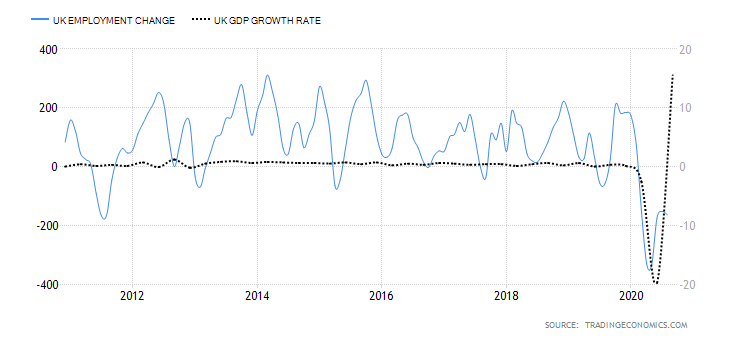
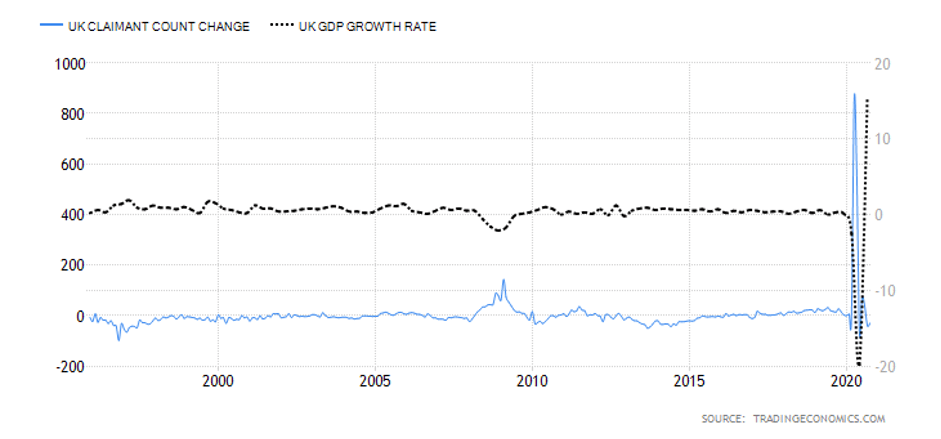
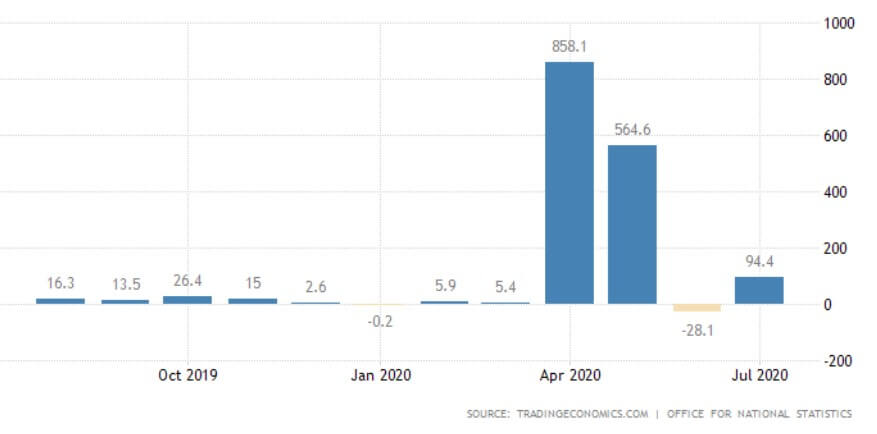
Claimant Count Change is a monthly report that provides information on the employment changes upon measuring the number of unemployed people in the UK during the reported month. It is interesting to note how the Claimant Count Change averaged 3.70 thousand between 1971 and 2020, reaching an all-time high of 858.10 thousand in April of this year. The last report issued on August 11, 2020, signaled weakness in the labor market, with the number of people claiming unemployment benefits having gone up by 94.4 thousand to 2.7 million in the previous month.

  • Inflation/Monetary Policy Reports

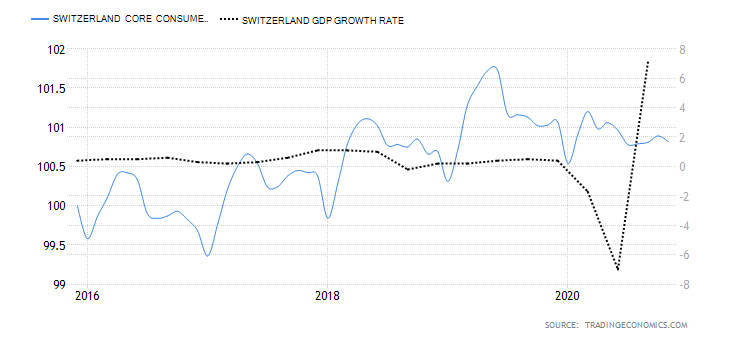
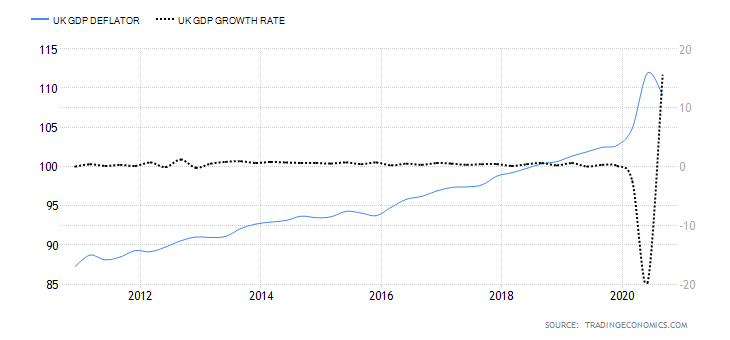
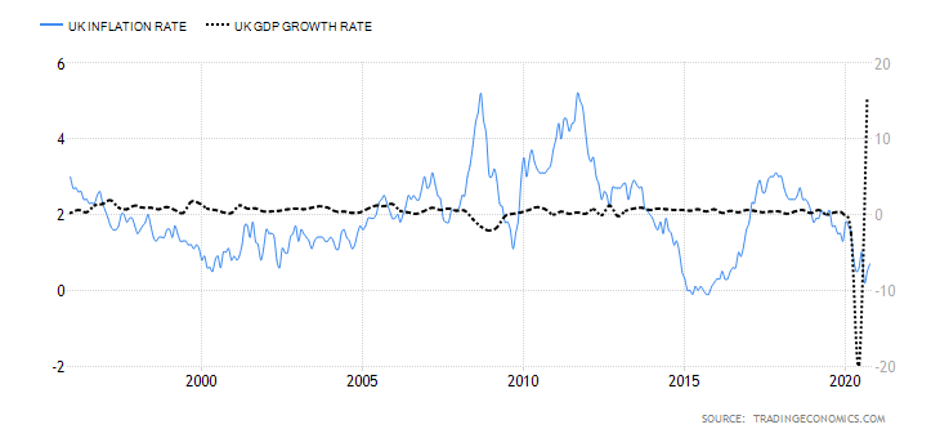
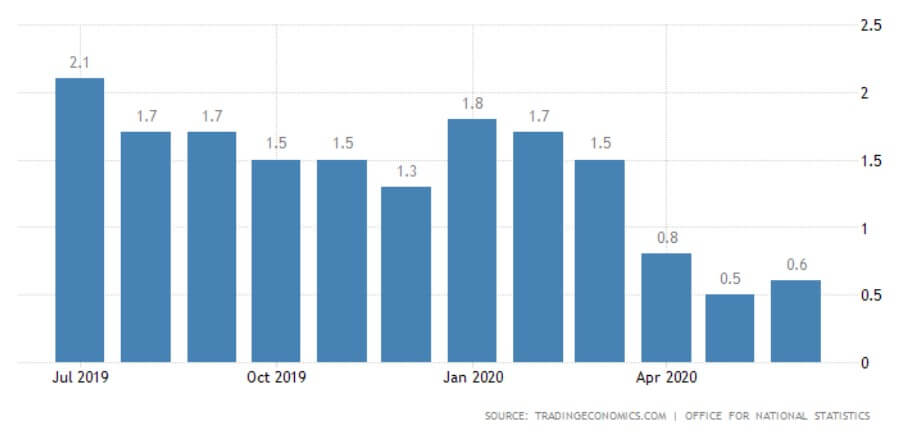
The quarterly Inflation Reports comprise the Monetary Policy Committee’s economic analyses and inflation forecasts that are further utilized in making interest rate decisions. As of November 2019, the Inflation Report is called the Monetary Policy Report, yet its purpose has remained the same. The last Monetary Policy Report that came out on August 6, 2020, reported the impact of the COVID-19 pandemic on reducing jobs and incomes in the country. The report includes information on the assistance provided by the Bank of England to UK citizens. Moreover, the Monetary Policy Report states where the economy is in comparison to the overall monetary policy of the BoE. The Bank of England has already put effort into returning inflation to the 2% target which aligns with its 1989—2020 average of 2.53%. Inflation is considered as one of the key indicators used in trading in the spot forex market. Traders are generally advised to keep informed in order to understand the situation in the country at the time for trading.

  • Retail Sales

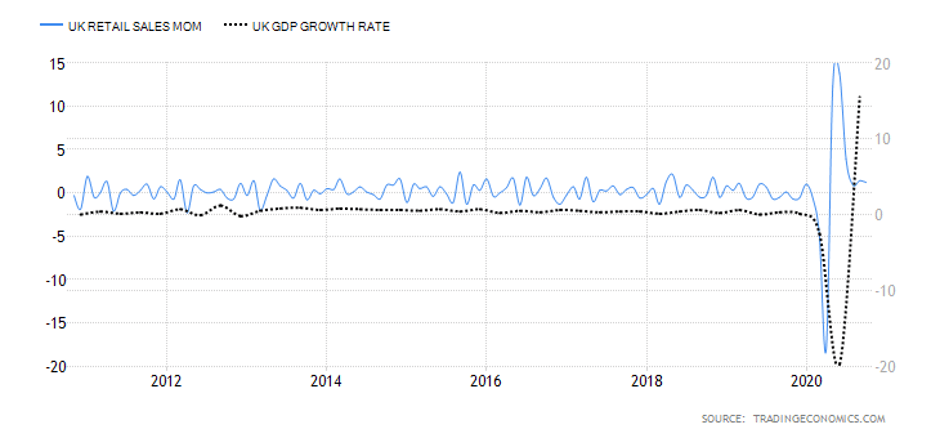
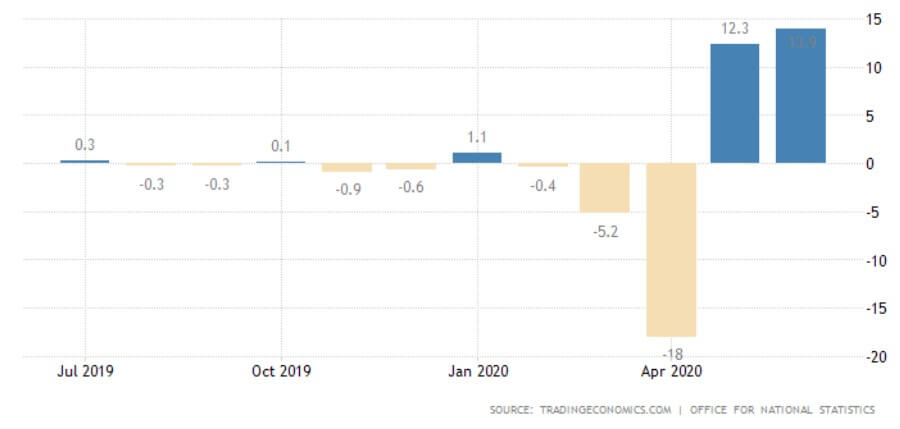
The Retail Sales report is an in-depth analysis of the latest macroeconomic and consumer trends affecting the UK retail industry. The last report issued in June 2020 indicated a 13.9% retail sales increase, which marks the second monthly increase in a row, resulting from the early economy recovery stages from the effects of the pandemic. Quite interestingly, while the United Kingdom’s retail sales averaged 0.23% between 1996 and 2020, they reached their all-time high of 13.90% in June 2020 and a record low of -18% in April of the same year. The next release of the report will be issued on August 21, which should give more information on whether the previous two-month increases will continue, further maintaining total sales to the pre-pandemic levels.

  • Manufacturing Report

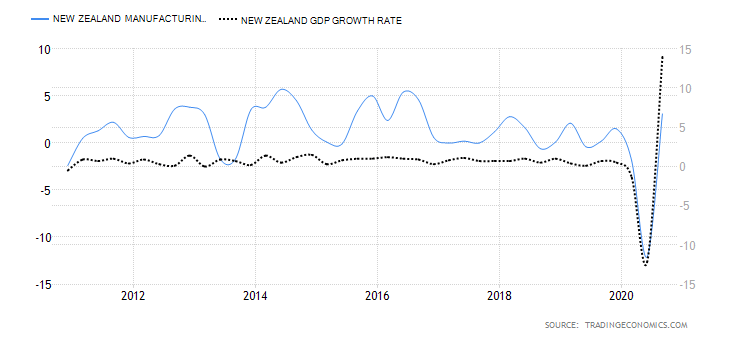
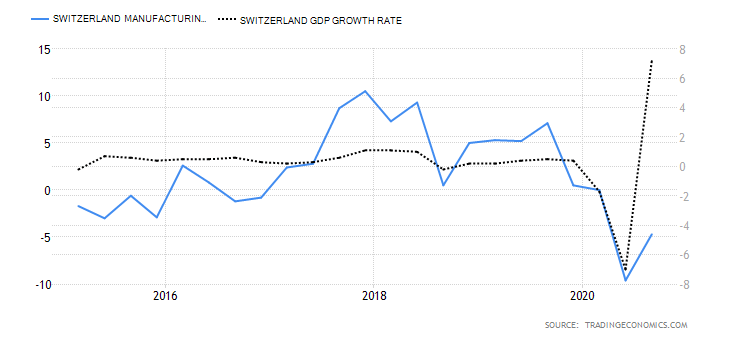
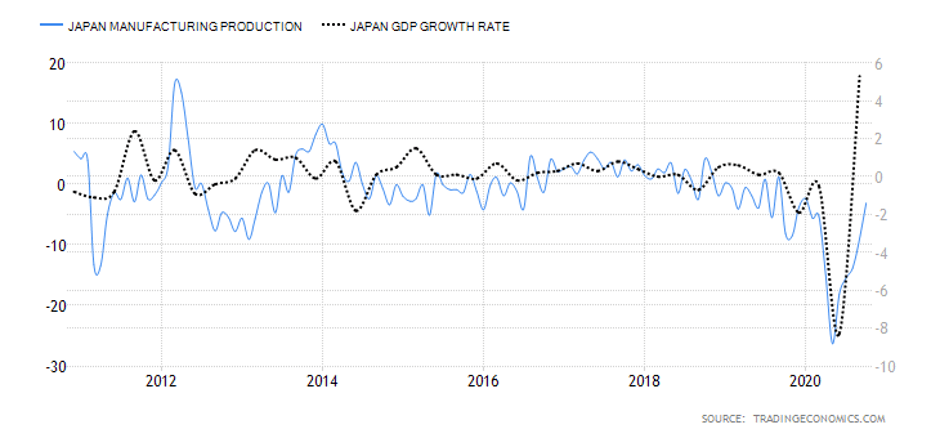
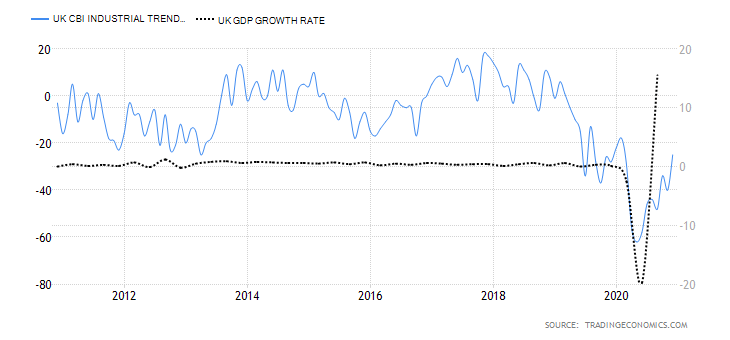
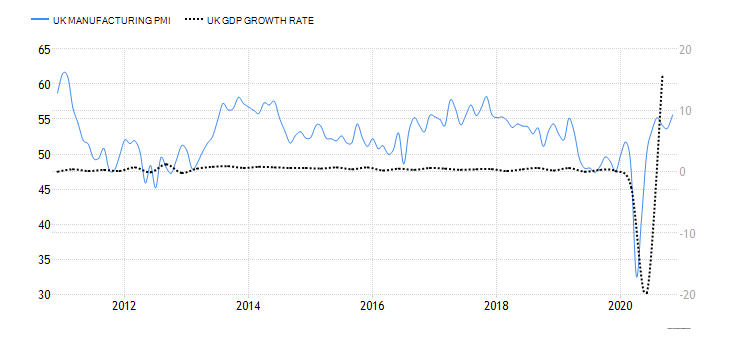
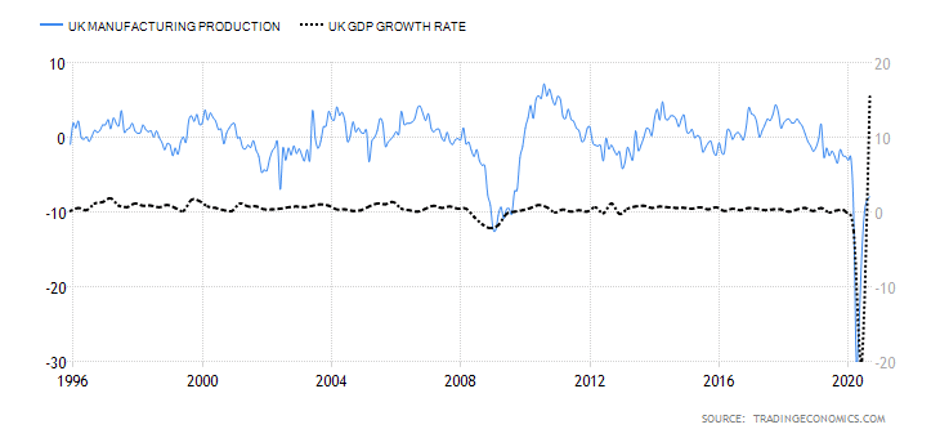
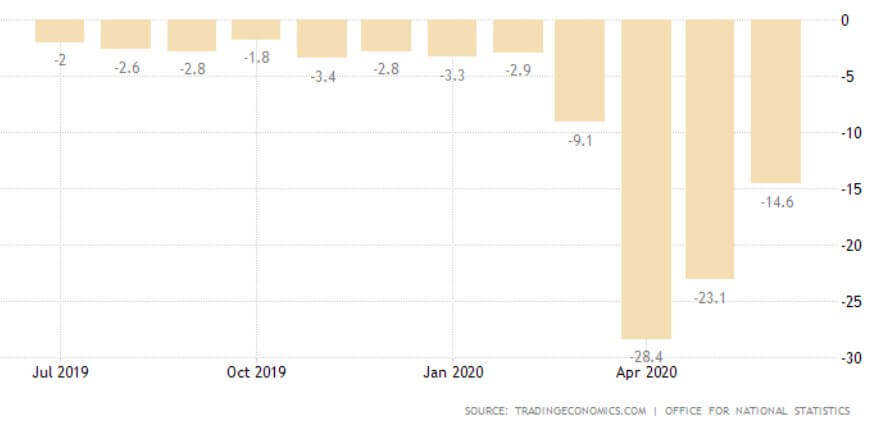
Deemed the most vital indicator for the UK manufacturing industry, the Manufacturing Report reveals the manufacturers’ contribution to the country’s regions with regards to past 12-month output, jobs, investment, and business confidence and export. Over the last year, the UK has been largely affected by the attempts to leave the European Union and the impact of the COVID-19 pandemic, which have caused prolonged industry volatility. UK manufacturing production’s 1969—2020 average of 0.42% was exceeded by far in April of this year with an all-time low of -28.40%. The last statistics in June indicate a fall of 14.6% in comparison to the previous year, but the forecasts seem to be more positive for the following 12-month period.

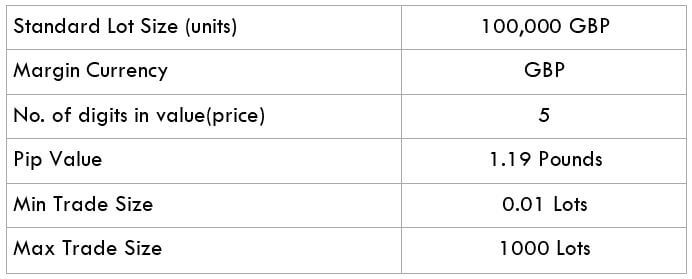
The Most Traded Pairs

  • GBP/USD

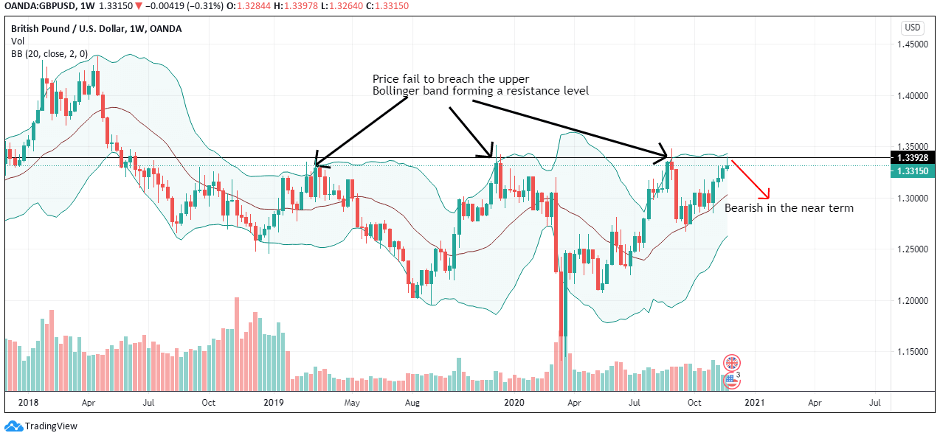
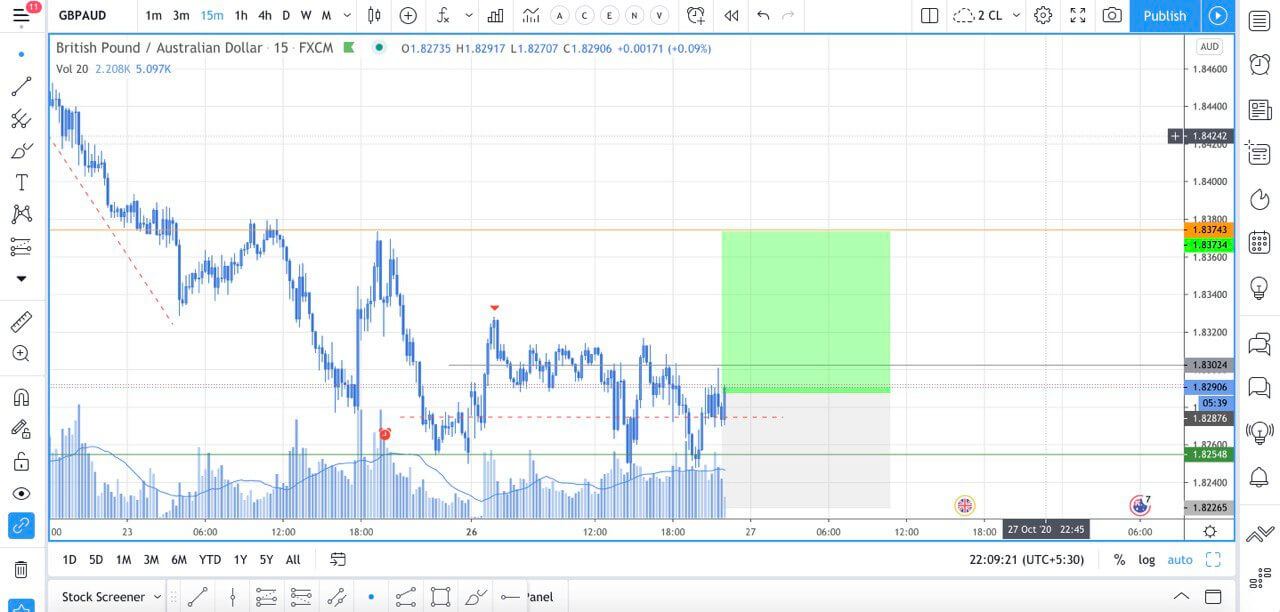
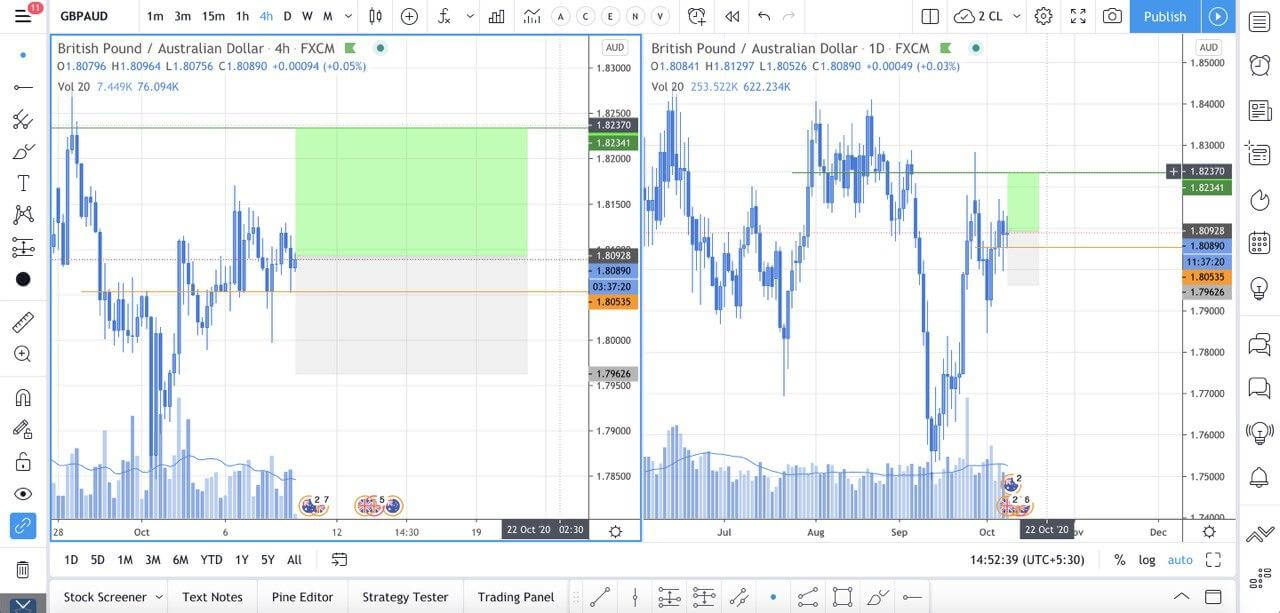
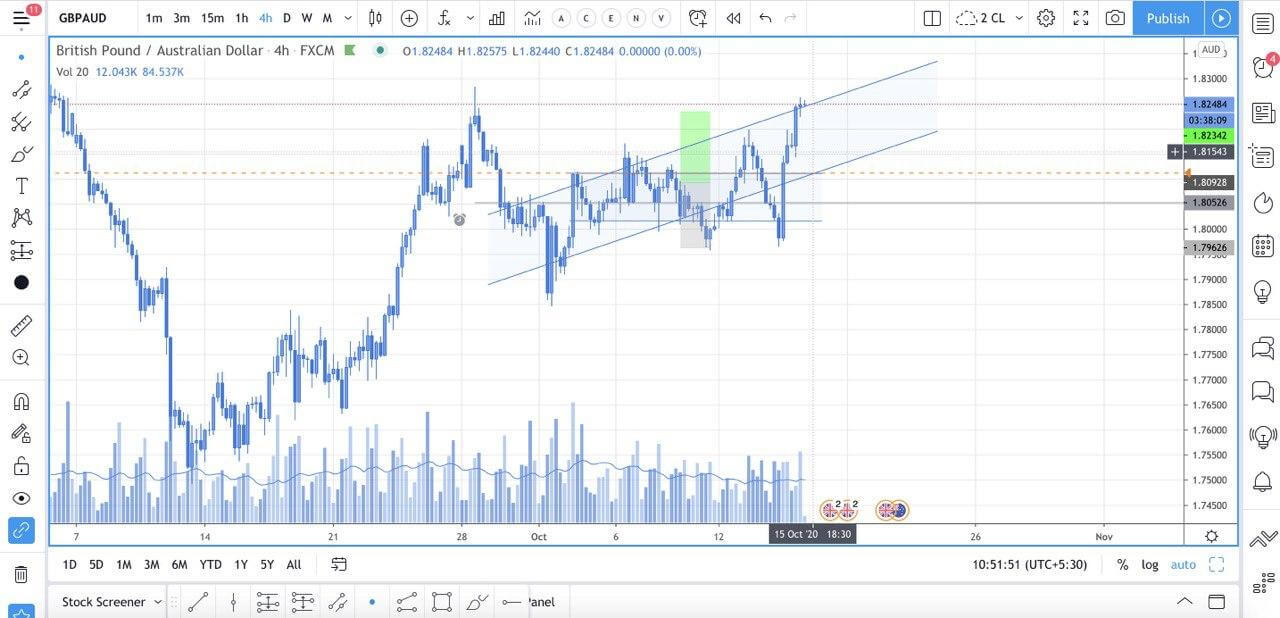
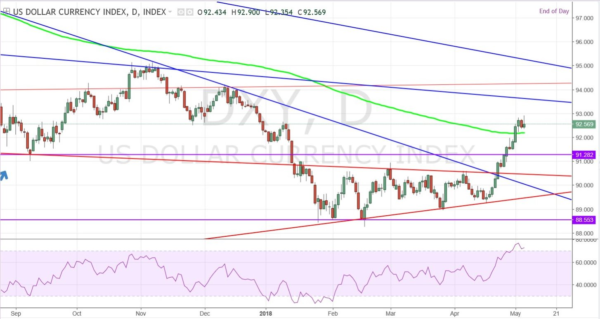
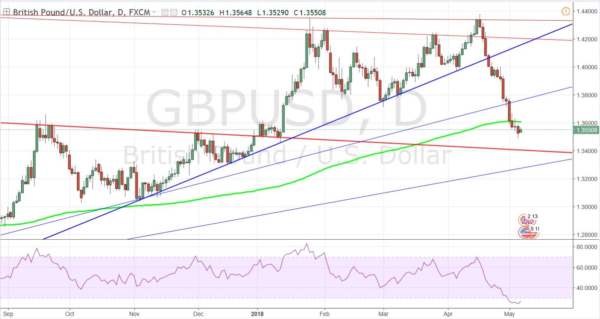
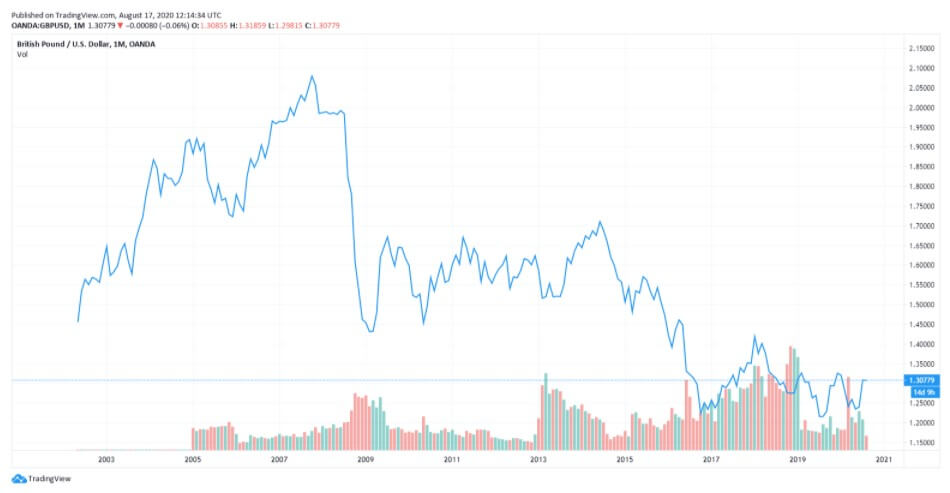
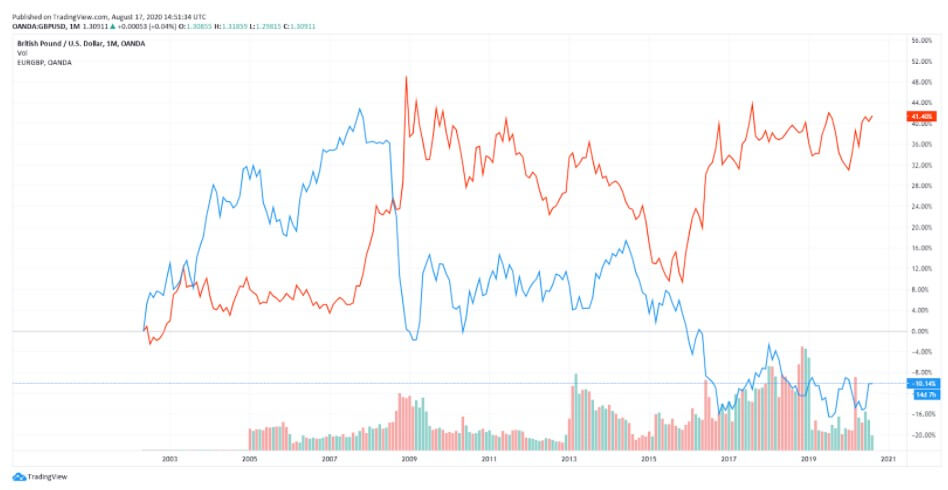
GDP/USD or the cable is probably the most frequent currency pair traded that, like EUR/GBP, has a lot of volume with an estimated 15% of the total daily volume of forex transactions. As it comprises two of the most traded currencies in the world, the focus of attention is often pointed towards this particular cross. This week’s economic calendar is rather quiet and the chart below reveals a continuation of a bullish pattern. Nonetheless, with the Brexit talks ever-present, the pair could overall entail slightly more volatility than usual.

  • GBP/EUR

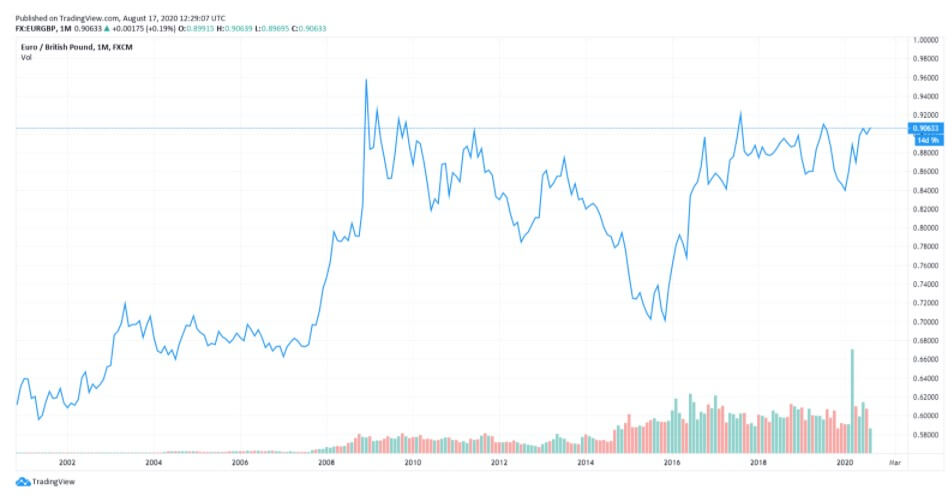
These two major currencies rank as one of the top eight most frequently traded currencies in the world. From the perspective of daily forex volume, the EUR is second only to the USD, with a market share of 39.1%, whereas the GBP ranks fourth with a 12.9% market share. This currency pair is said to be significantly less volatile than other EUR- or GBP-based crosses due to the economic closeness and interdependence between them. Nonetheless, the (ongoing) changes in monetary policy between the central banks of the UK and Europe can make this pair highly sensitive. 

  • GBP/JPY

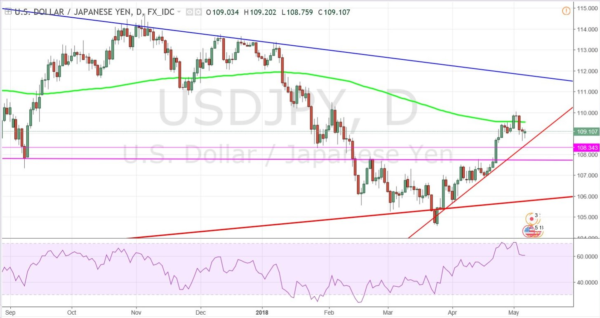
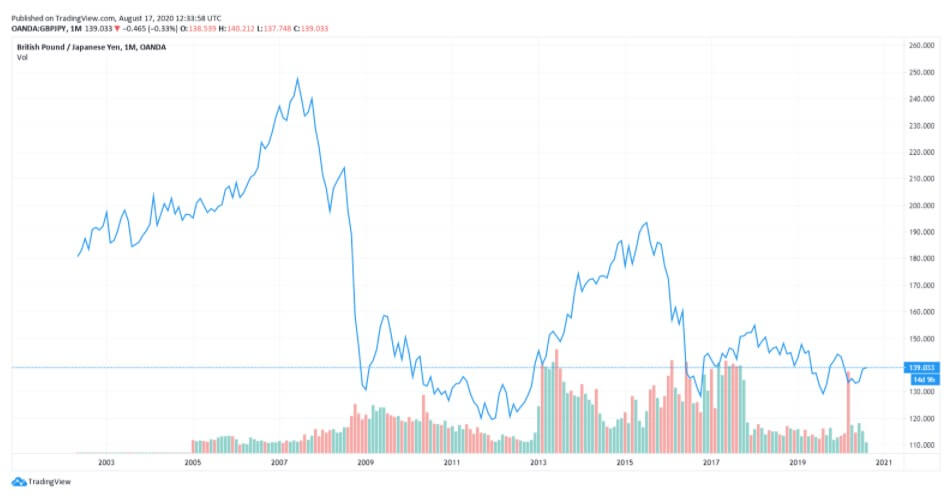
The GBP/JPY currency pair is said to be quite a volatile pair. As a low yielding currency, the JPY is commonly used as a funding currency of trade. Therefore, since the GBP belongs to one of the biggest economies in EUT, this particular pair can reveal the state of the global economy. It also reveals risk-off moves in the market resulting in the development of strong trends exceeding thousands of pips.

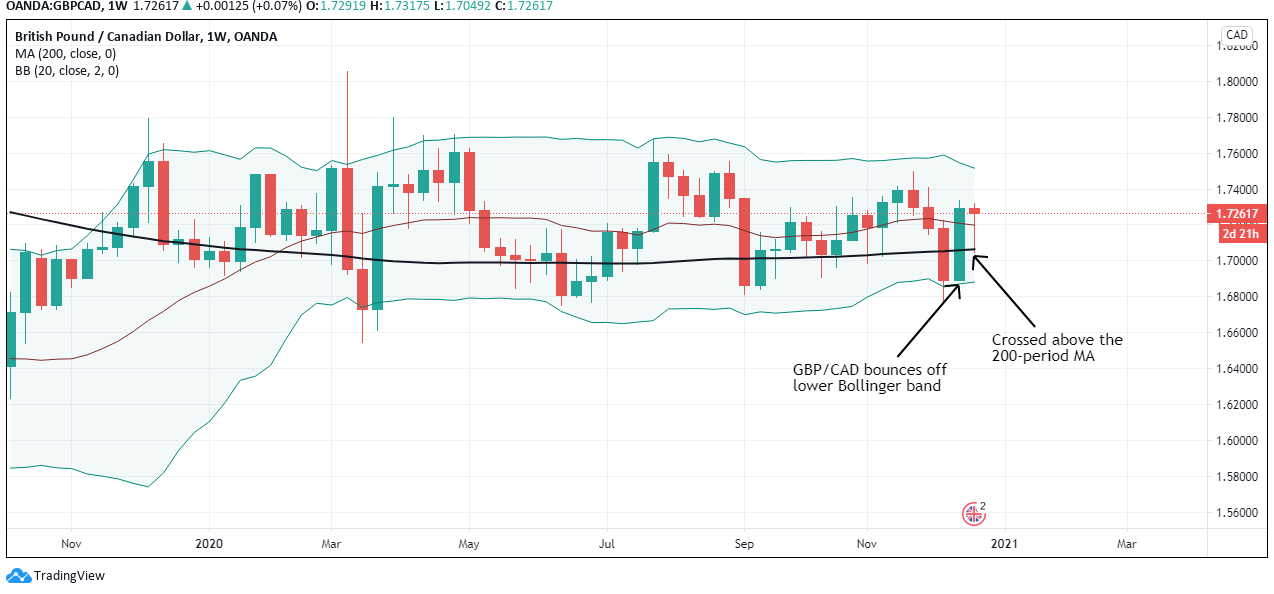
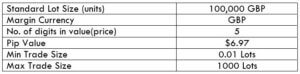
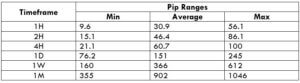
The lower volatility of the pair is said to originate from the economic and geographic proximity of the two nations with both the GBP and CHF used as reserve currencies around the globe. This pair along with the ones mentioned above fall under the more liquid group of pairs, whereas outside this particular set, one can find some more exotic crosses.

  • GPB/AUD

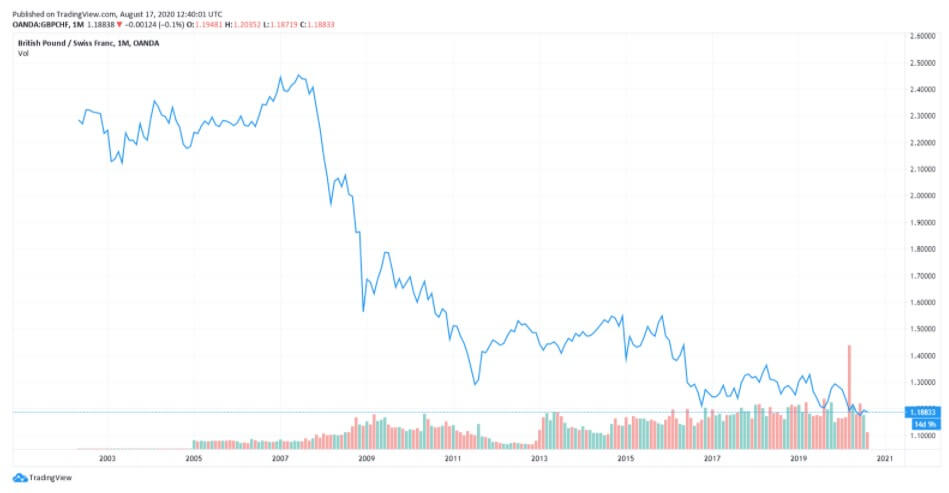
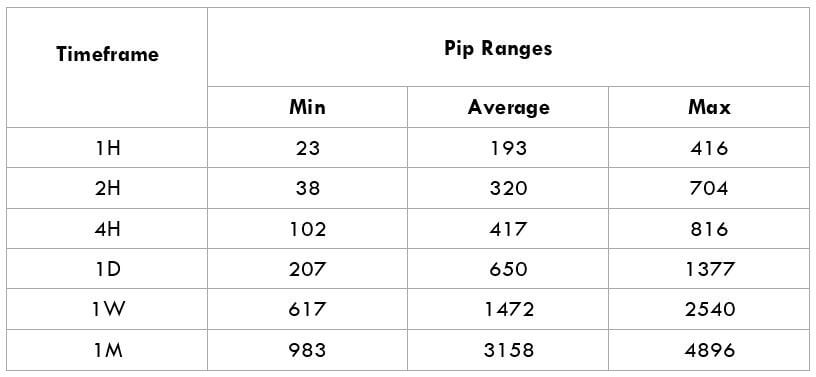
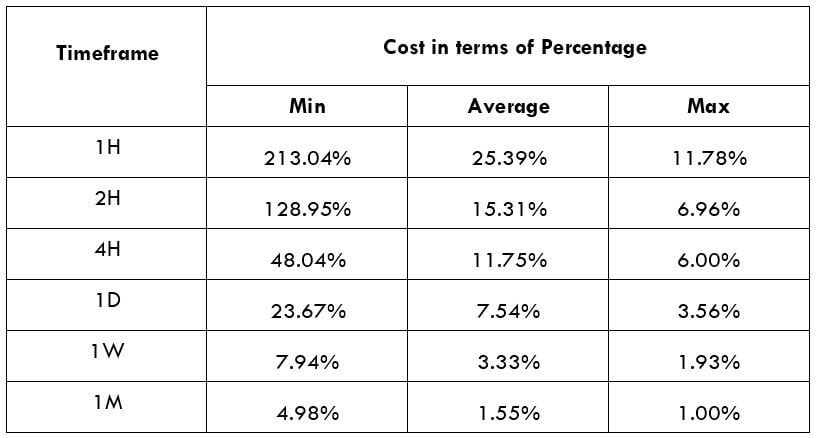
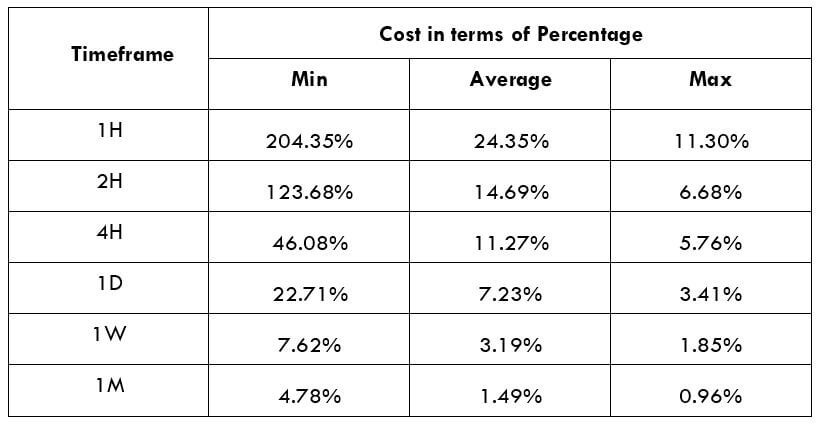
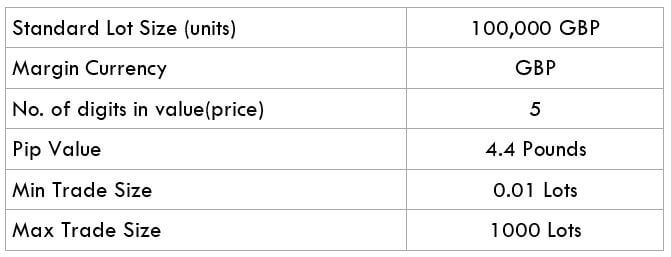
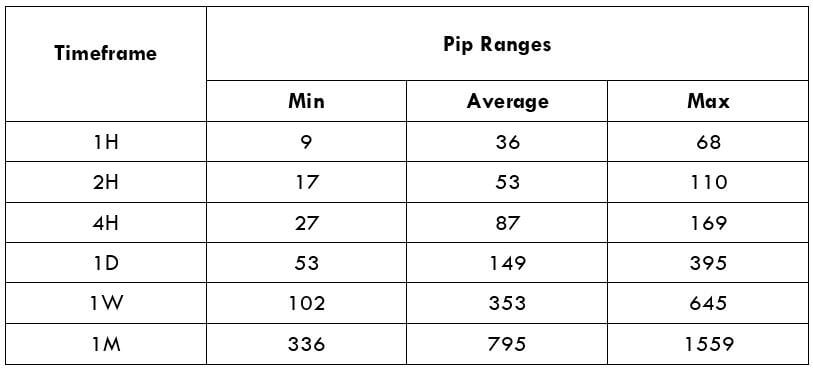
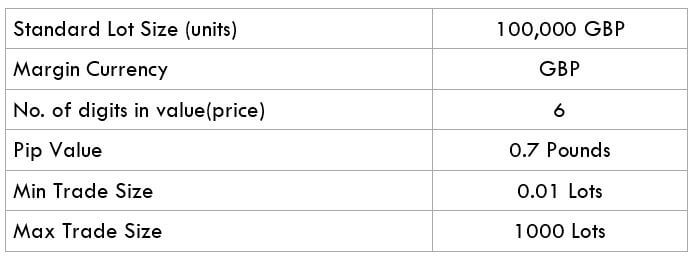
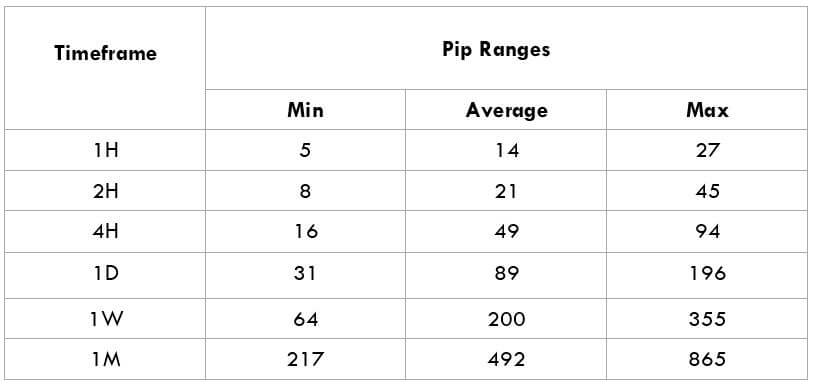
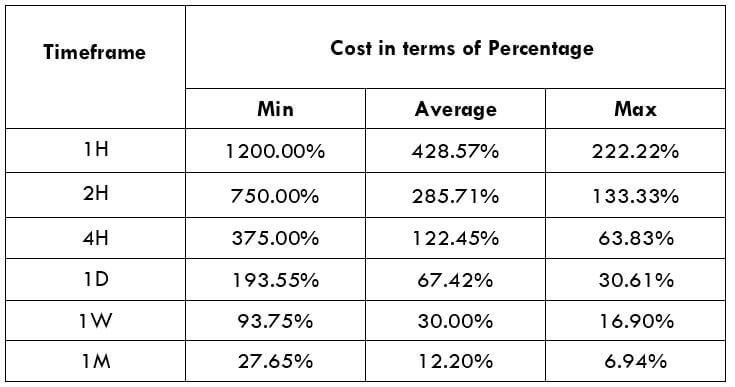
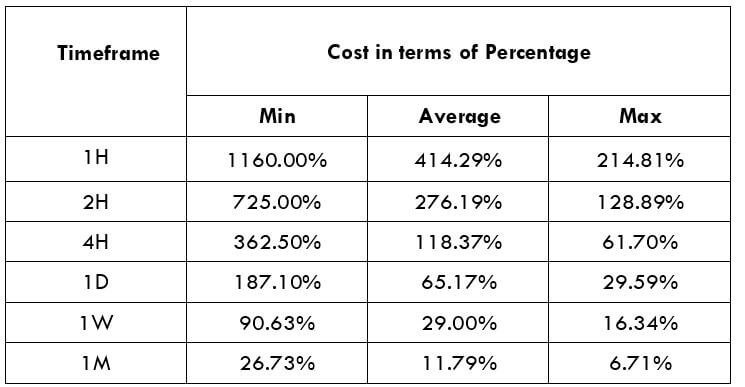
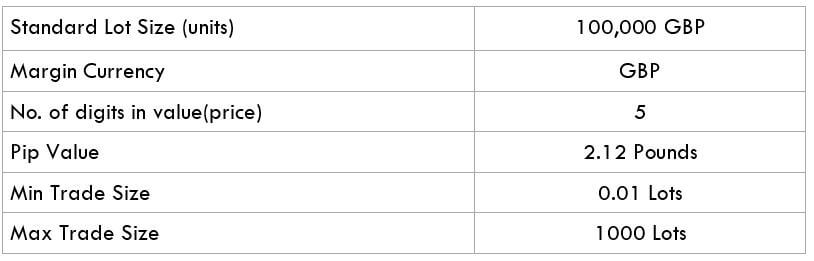
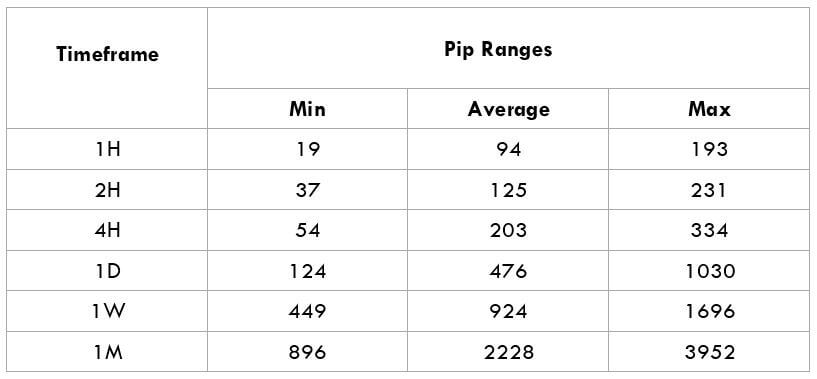
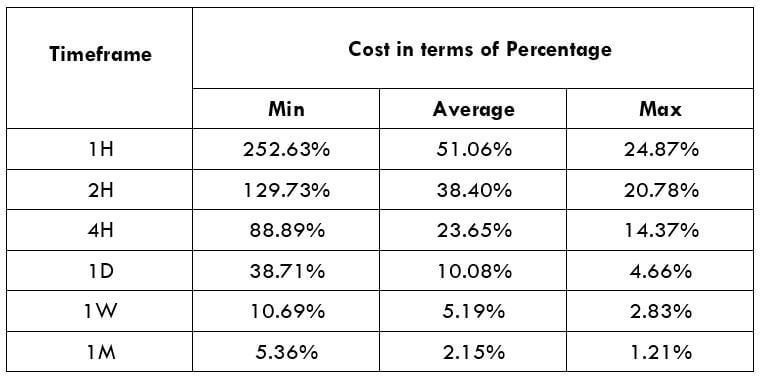
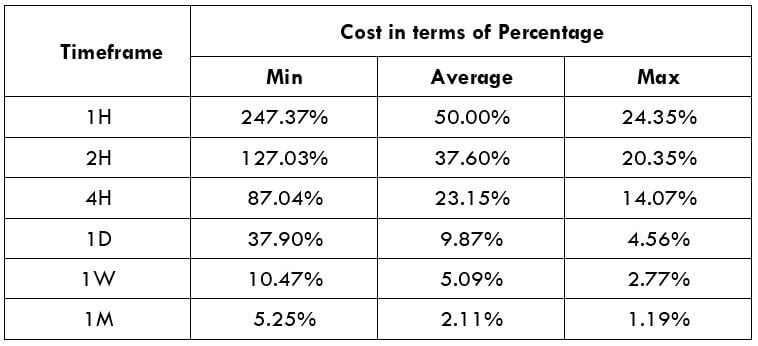
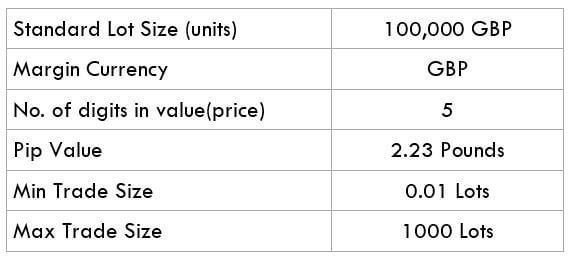
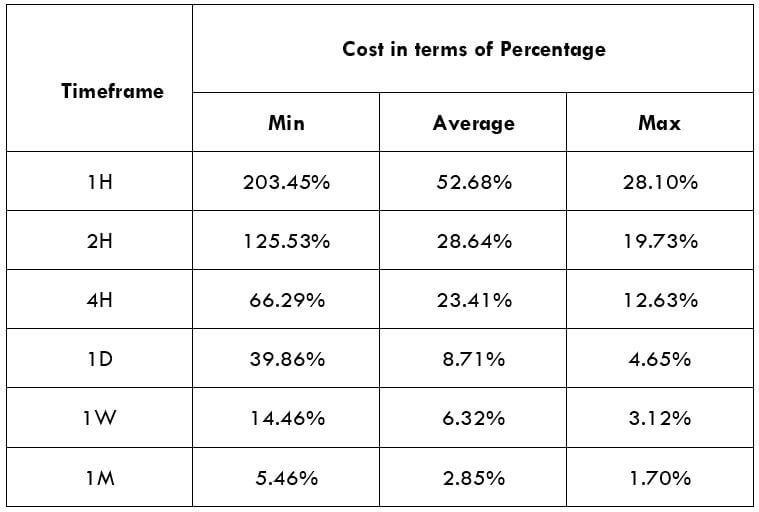
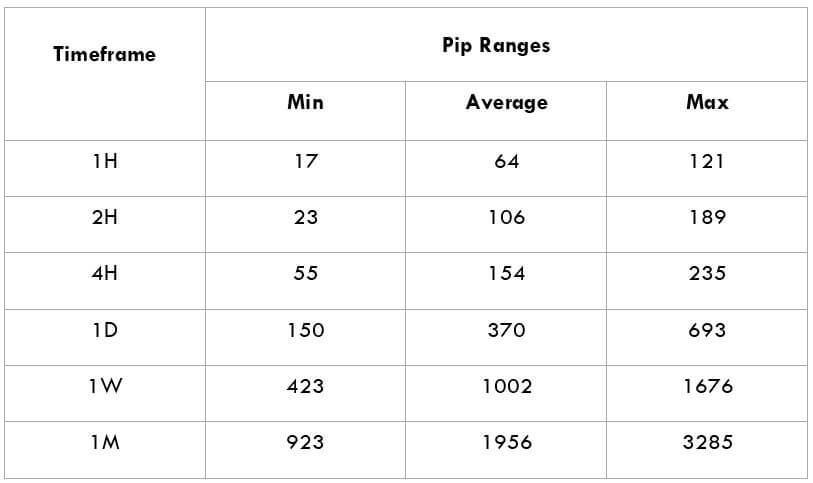
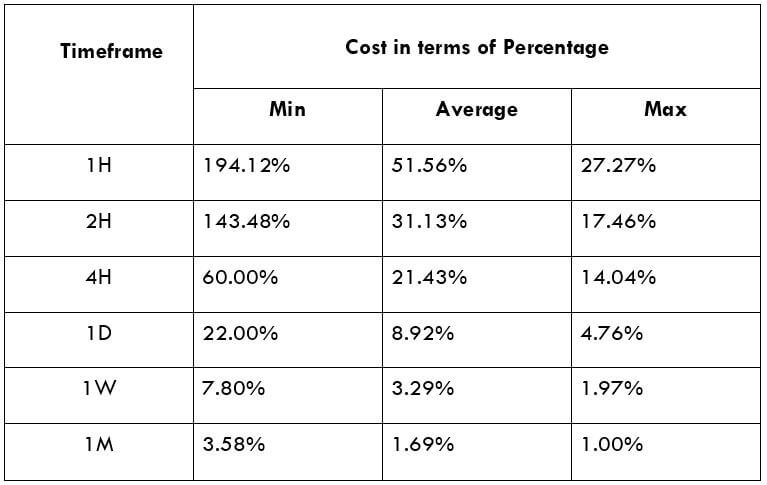
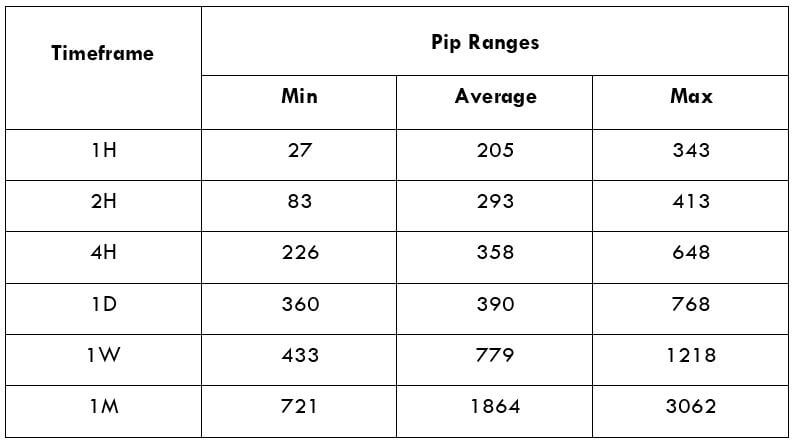
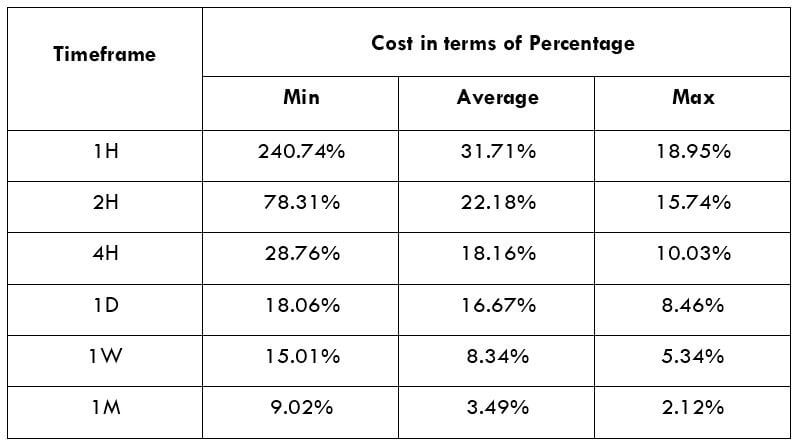
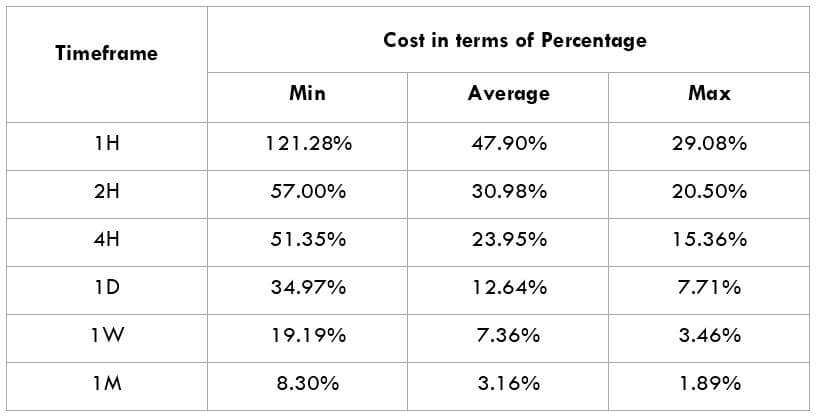
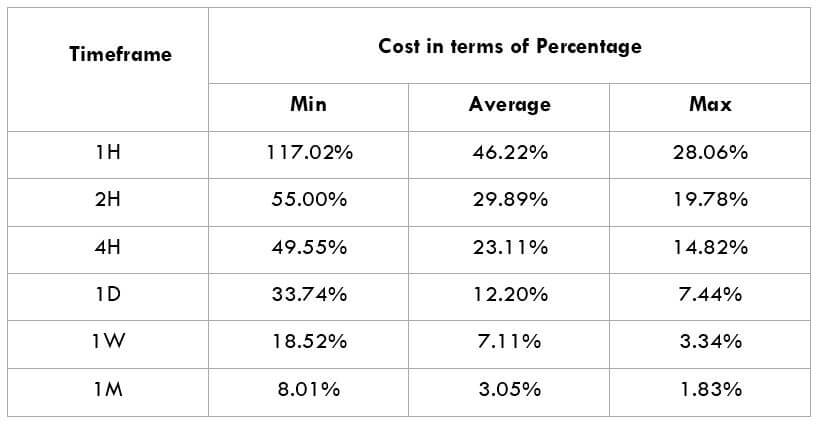
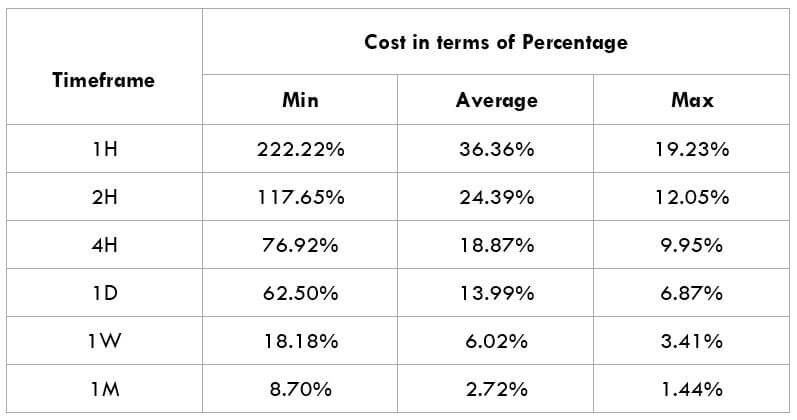
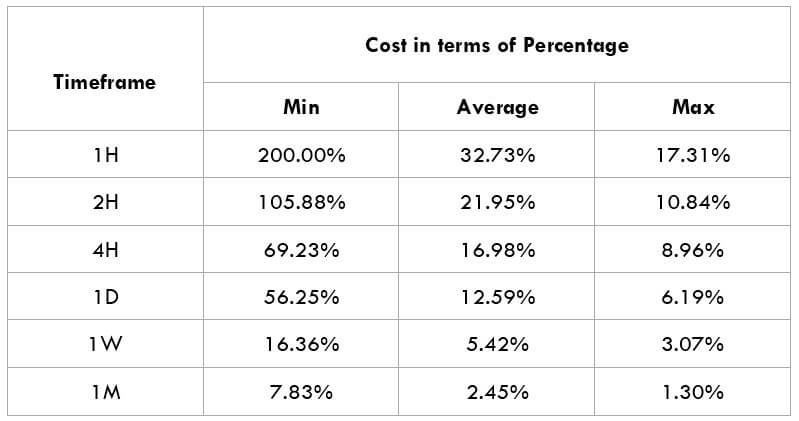
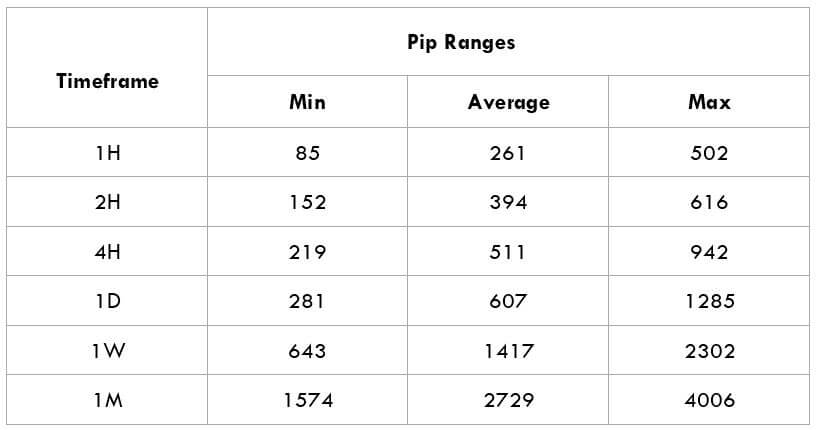
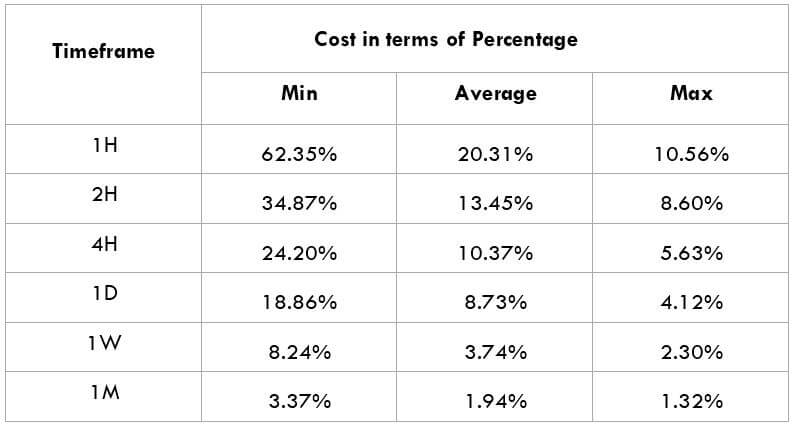
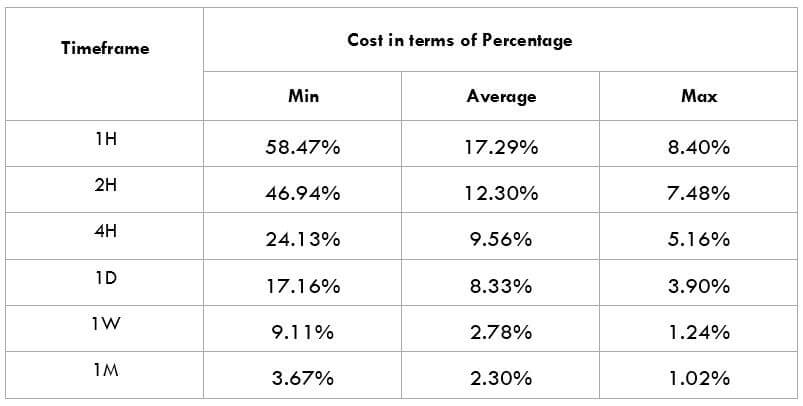
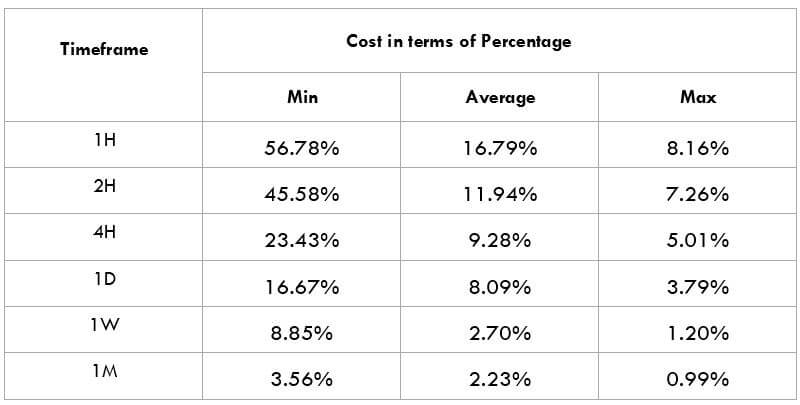
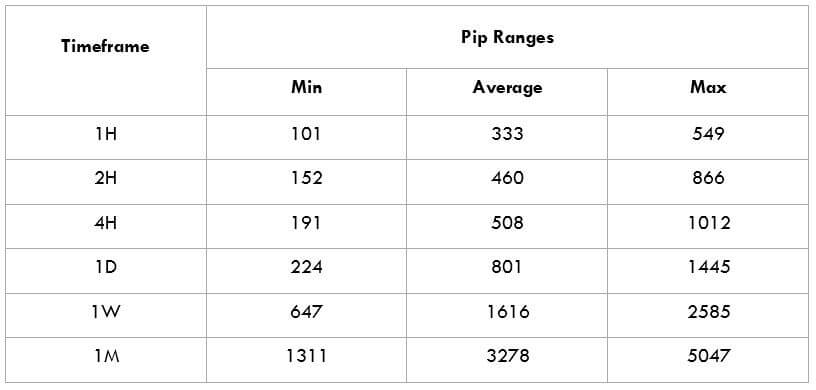
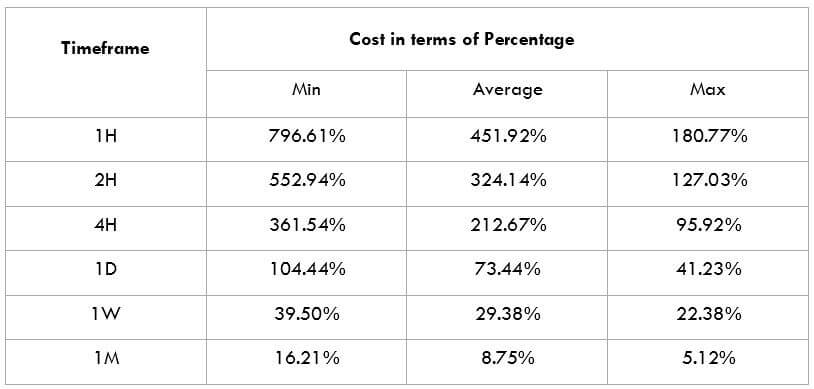
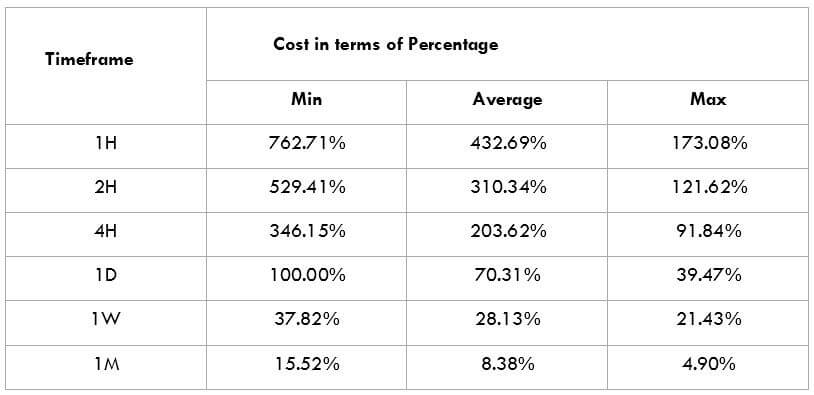
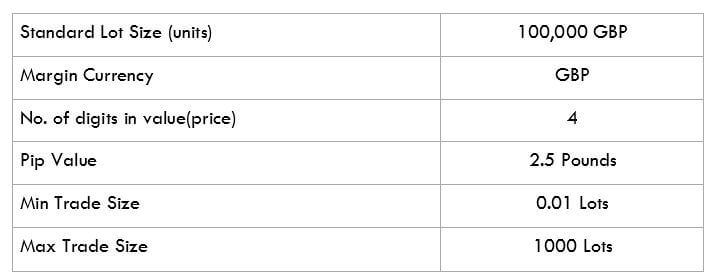
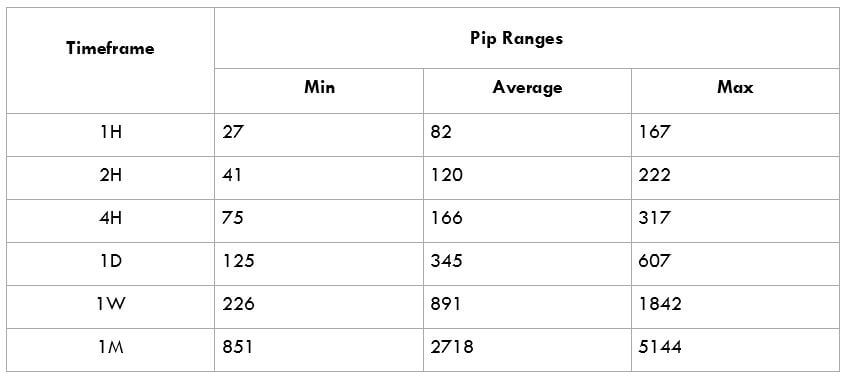
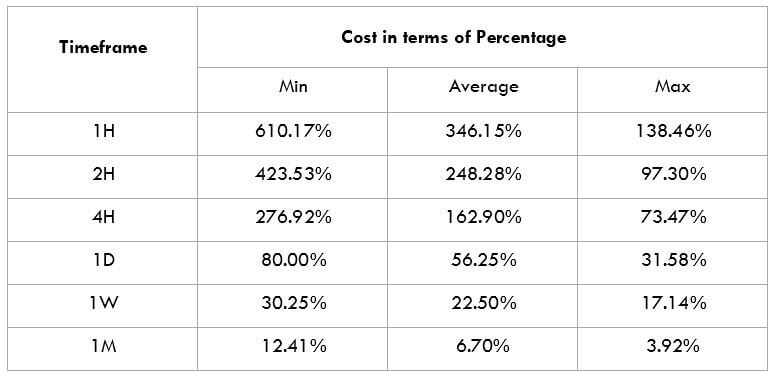
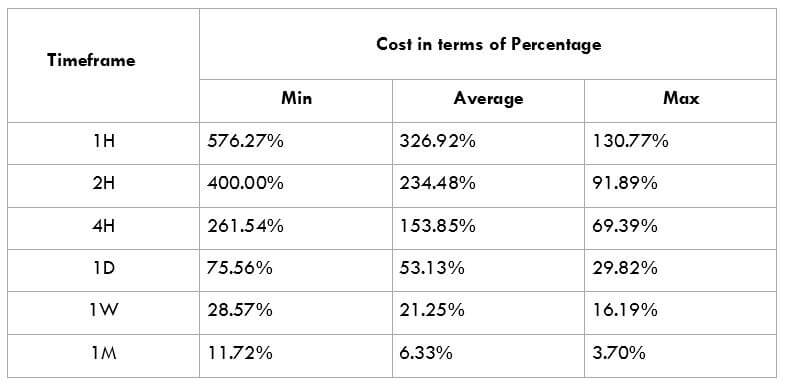
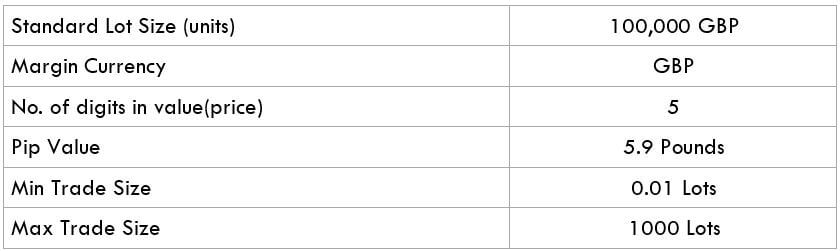
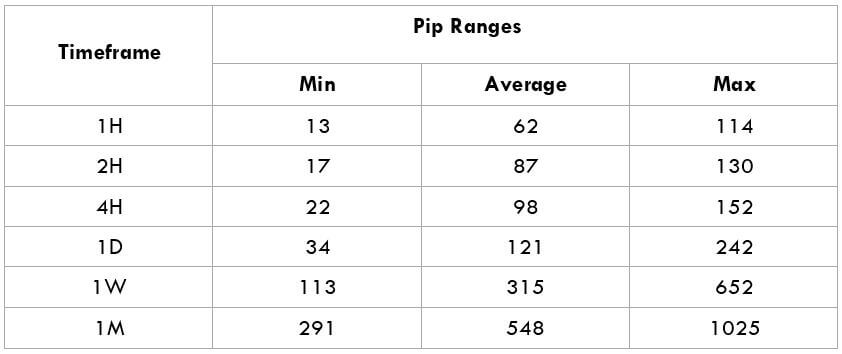
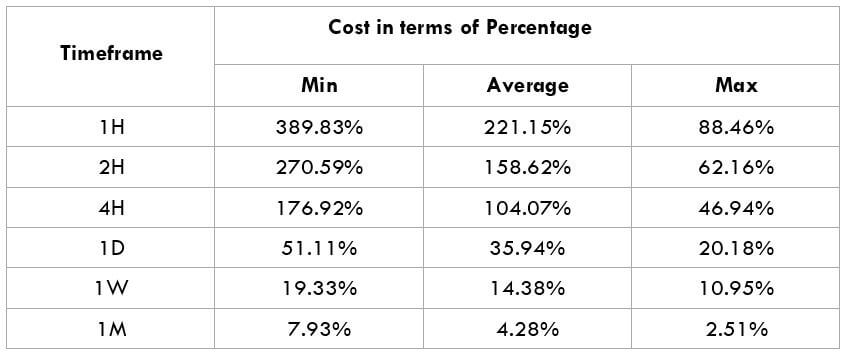
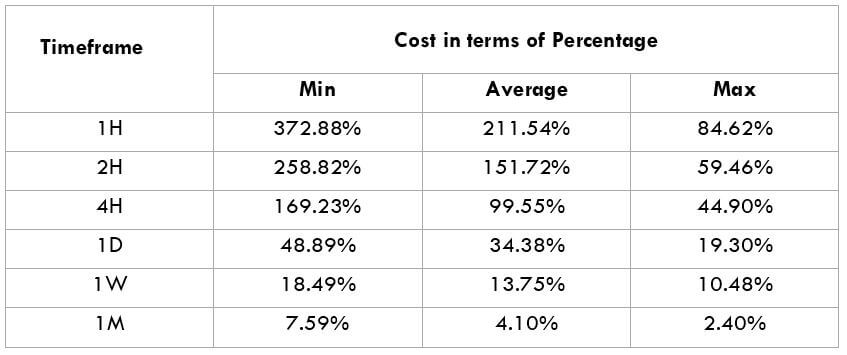
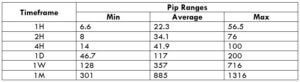
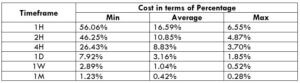
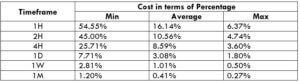
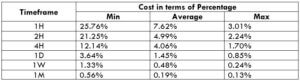
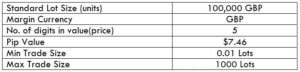
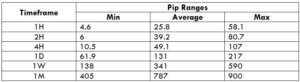
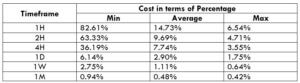
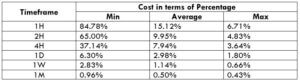
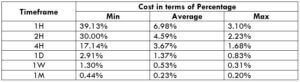
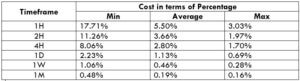
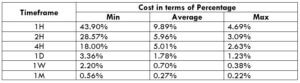
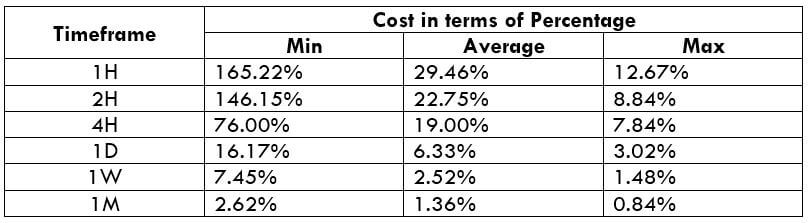
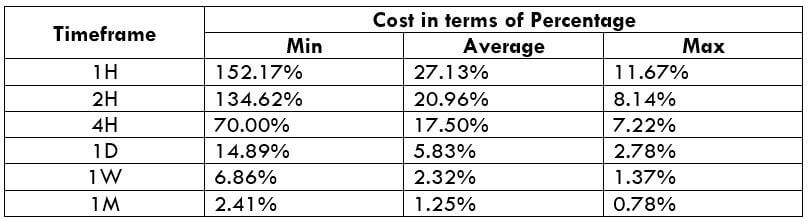
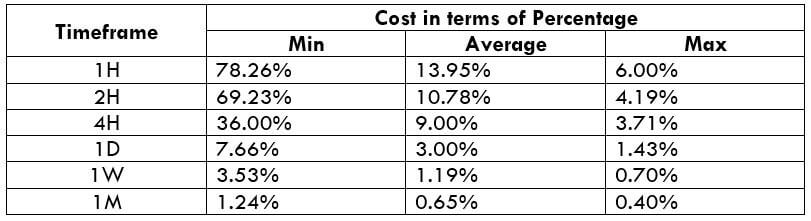
This currency pair reveals a lot of big moves that signal a much lower value of 100 pips than in pairs such as NZD.JPY for example, where 100 pips would equal a 1.3% move. In this currency pair, however, the same number of pips would turn out to be only a 0.5% move up or down. The percentage return will demonstrate the amount that a trader can expect to get. A number of GBP crosses typically entail many pip moves and, whenever the GBP is traded, smaller position sizes are to be expected owing to the fact that the base currency is as high. 
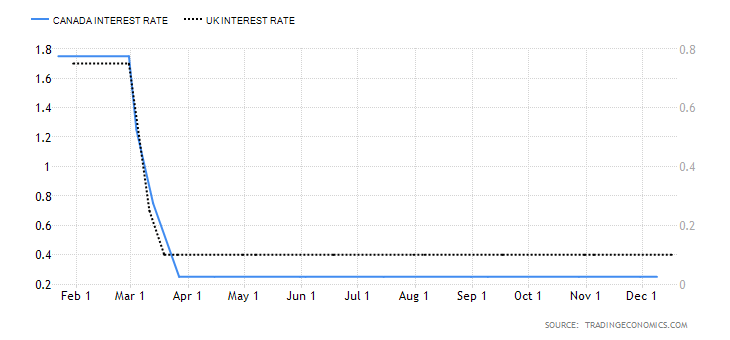
Interest Rates

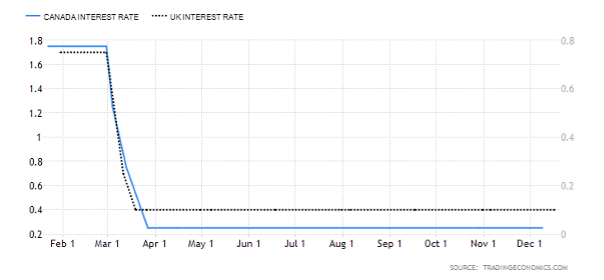
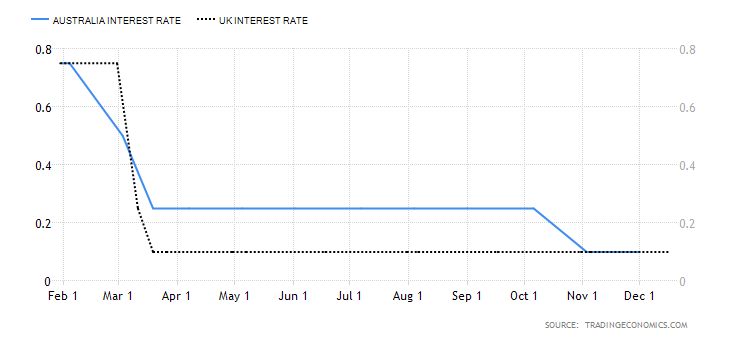
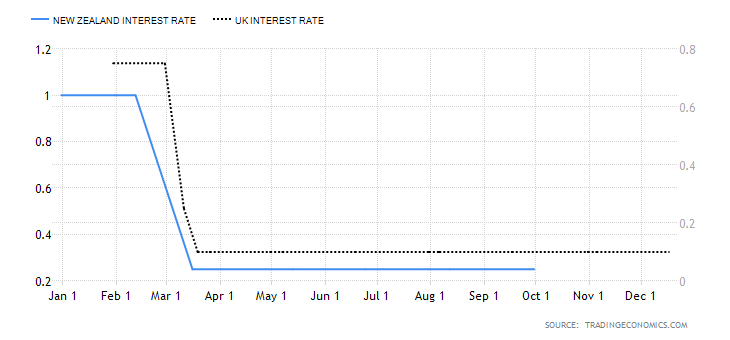
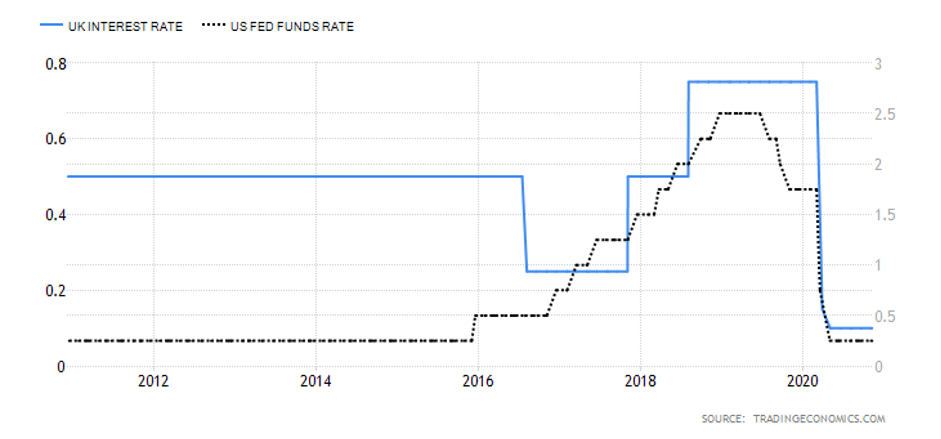
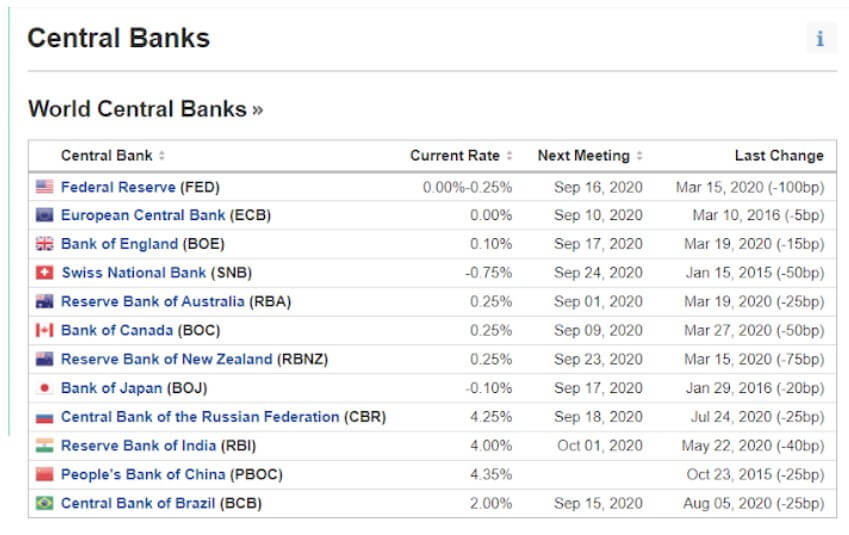
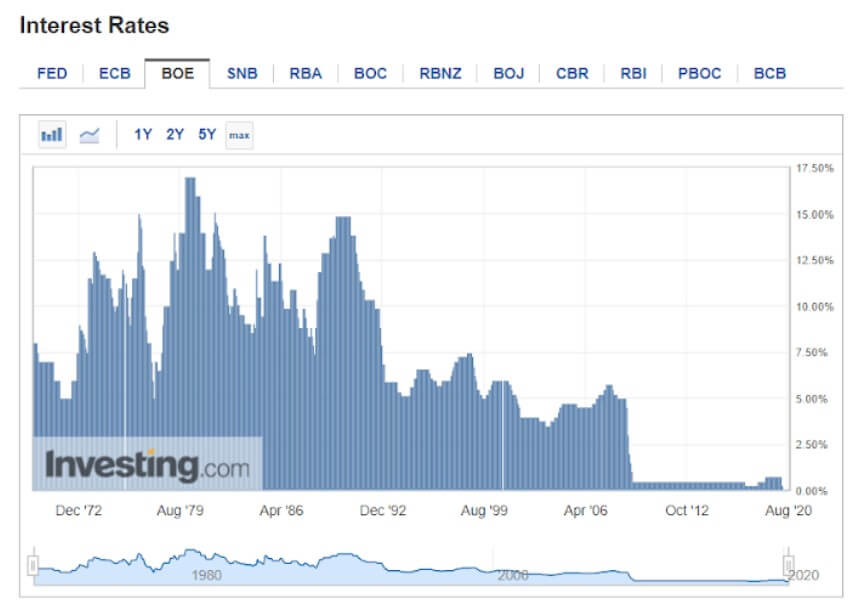
The GBP is generally believed to be doing better than the USD or JPY similar to other risk-on European currencies. Compared to other central banks, the Bank of England’s current 0.10% does reveal it to be one of the lower interest rates on the spectrum. At the same time, the current interest rate of the United Kingdom poses as a record low in the 1971—2020 average of 7.36%.

Trade Deficit

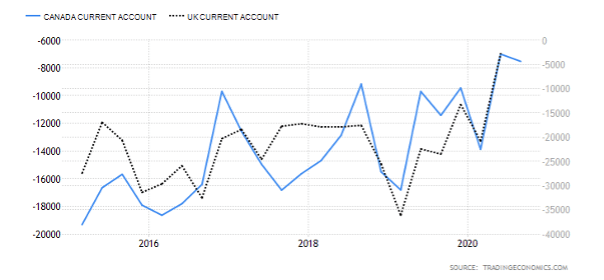
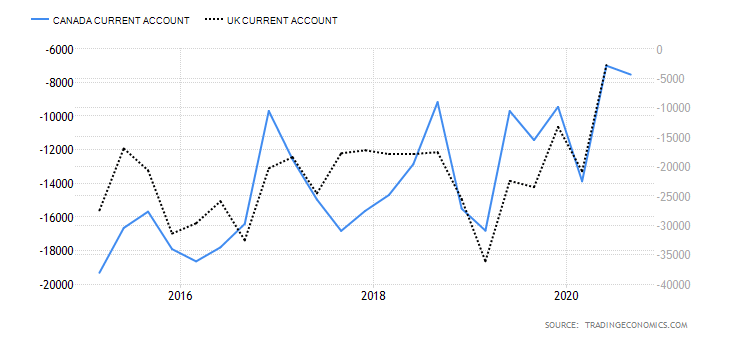
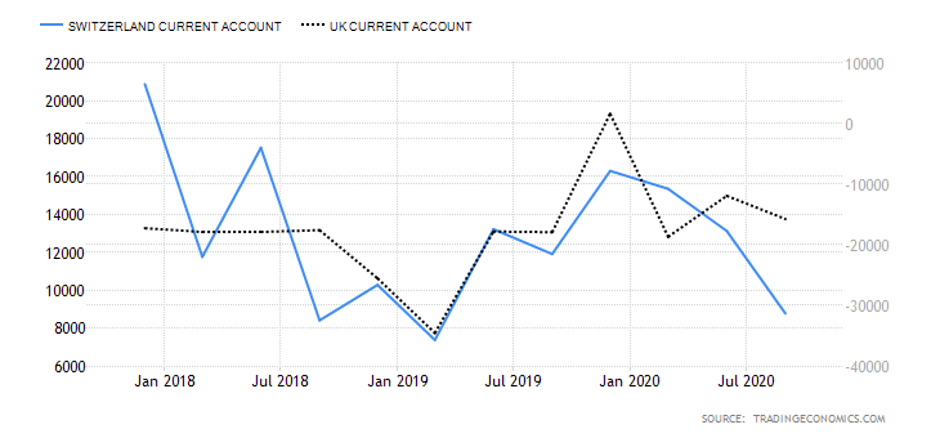
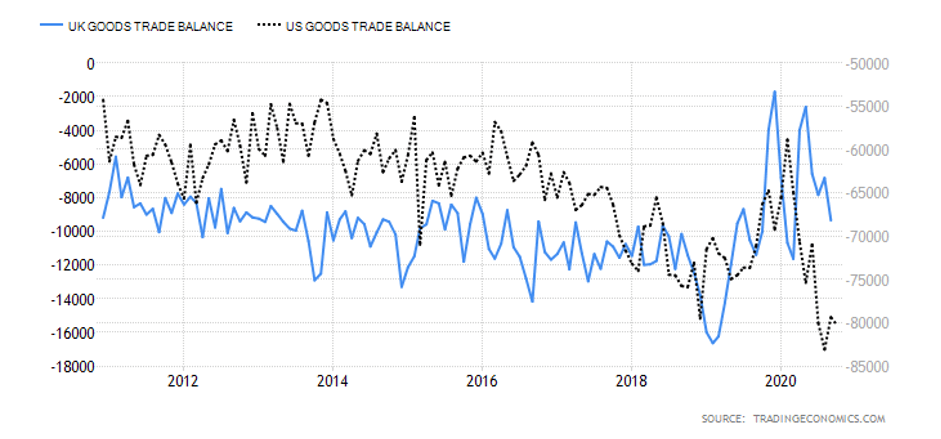
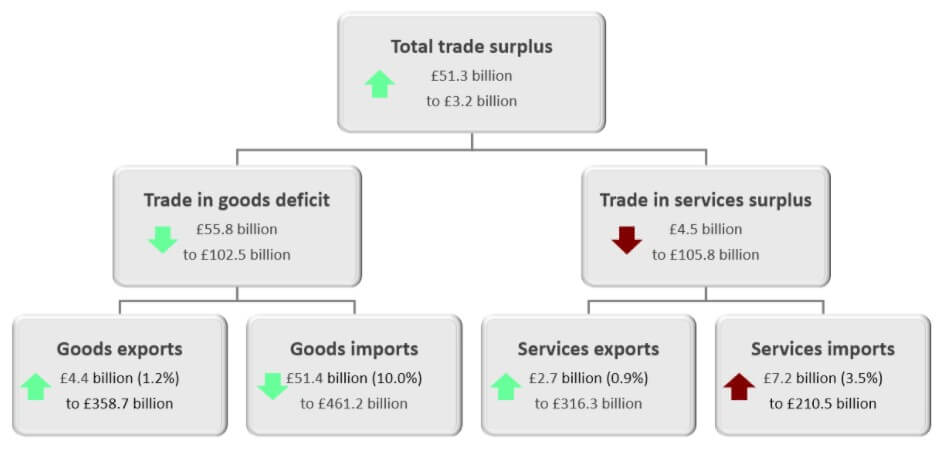
Like the US, the UK imports more than it exports which leads to large trade deficits with foreign countries.  In April of 2020, the total trade deficit of goods and services, without non-monetary gold and other precious metals, dropped down to 7.4 billion GBP in the past 12 months, with imports falling by 34.6 billion GBP and exports falling by 7.8 billion GBP. The total trade deficit for March 2020 was revised up by £2.7 billion to £4.0 billion, driven by a £2.2 billion downwards revision to services imports. These revisions also include the impact of the adjustments of GDP balancing applied to component series (including trade) to improve the alignment of the quarterly GDP position. The overall changes in the trade of the United Kingdom are presented in the image below and were certainly impacted by the strained relations with the EU and the overall state of the global trade under COVID-19.

Economic Activity

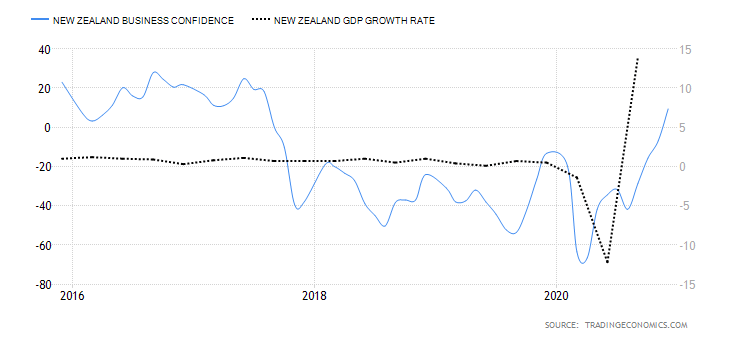
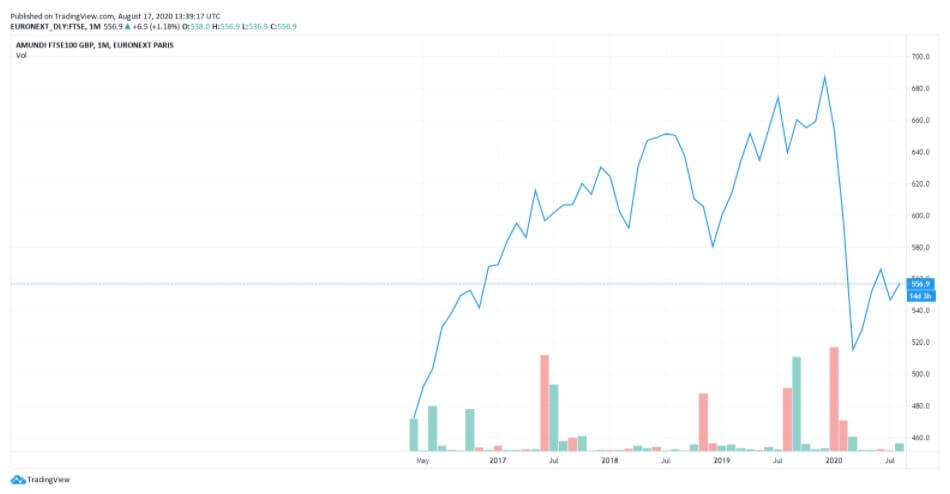
In order to understand the general state of the economy of the United Kingdom, one should look into the previously discussed GDP reports as well as FTSE (Financial Times Stock Exchange). FTSE 100 is the index of the 100 companies listed on the London Stock Exchange that will generate insight into the UK’s stock market. The chart below is an example of how the set of indices can provide market participants with information on the performance of the UK equity market. The current situation seems to have improved since the major drop in March of this year, but the likelihood of the return to the pre-pandemic state is still questionable.

Brexit

When Britain voted to leave the European Union in 2016, its currency plunged on world markets and 2020 still offers no actual resolution. The UK has officially rejected the notion of extending the transition period until December 31, 2020. After the video conference between UK PM Boris Johnson, European Commission President Ursula von der Leyen, and European Council President Charles Michel, both the UK and the EU came to terms with having more negotiations in the summer months so as to come to an agreement ahead of the EU summit on October of the same year. With both sides showing a willingness to mitigate the tension, the EUR/GBP currency pair seems to be caught in between the risk sentiment and Brexit. GBP improves along with the improvement of risk sentiment, yet the lack of Brexit progress drags the currency in the other direction.

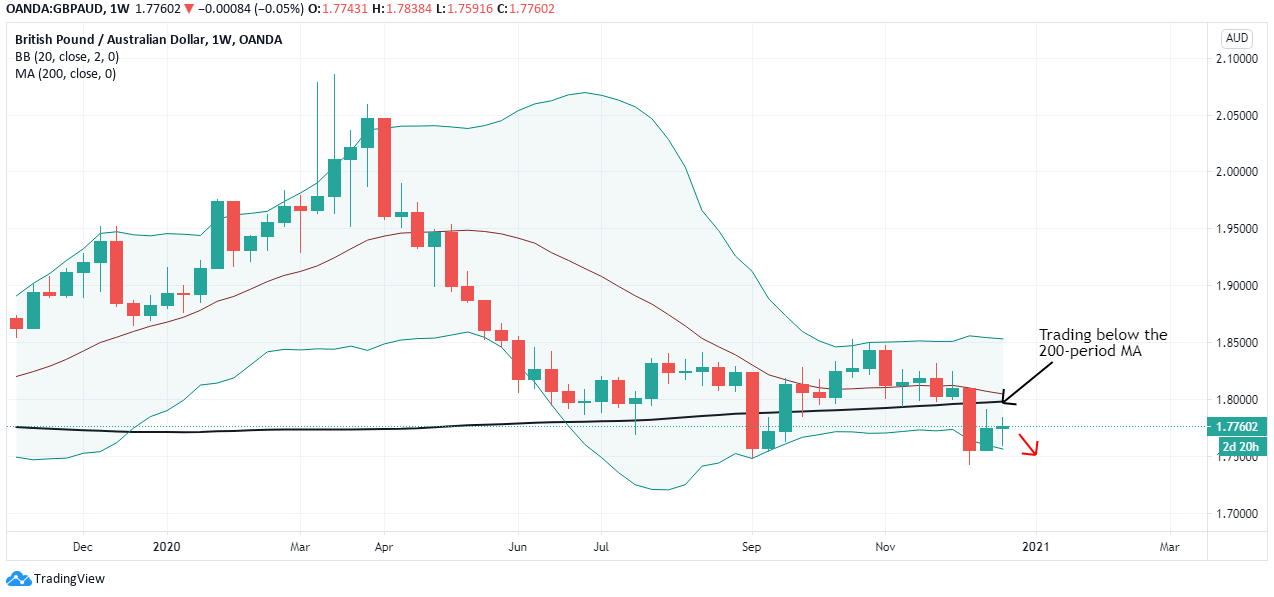
The various currency pair charts above reveal the progression of the GDP across the years. It appears that the UK’s official currency has suffered quite a lot in the past few years. Upon the 2016 referendum, the GBP fell 8% against the USD and 6% against the EUR. The initial hopes of a weaker currency to increase exports and raise demand for the UK goods/services did come through to a certain degree, but the trade deficit is still very much present. The exports have been increased by the weaker GBP and the unexpected increase in import prices has led to a reduction in pay and, therefore, a drop in consumer demand. Some predictions of the future of the British pound are quite gloomy as some economists believe that the GBP could drop to the 1.10—1.19 USD range should the UK leave the EU without a deal.

Furthermore, without the trade agreement, the economy could shrink by 8%, which would lead to an employment crisis. The overall implications of the unresolved relationship challenges between the UK and the EU are already vivid; for example, after the Brexit referendum, the Dow Jones decreased 600 points, removing $2 trillion from the global markets. A sharp increase in the USD versus a weakened GBP and EUR could obstruct US exports, causing difficulty in the US manufacturing sector, already encumbered by the trade war with China. Apart from the US, the JPY was also feared to experience a major surge in value due to investors’ tendency to flock to domestic currency.

The past December election in the UK was believed to be able to bring some relief, yet 2020 witnessed more negotiations and equally unresolved questions. The possibility of coming to a mutually beneficial deal (termed soft-Brexit in the media) may help the GBP surge in the following months. The currency market is expected to remain unpredictable until the resolution of current matters and the economy was publicly described as high risk by Governor Andrew Bailey himself. The long-term consequences of the UK leaving the EU are largely unknown, very much like the realization of the Brexit supporters’ hopes of economic growth and the pound’s appreciation.

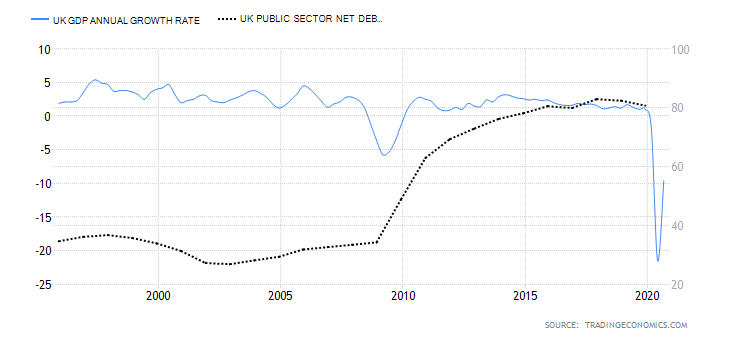
The UK appears to be putting extra efforts in maintaining and preserving the economy, especially with the support of 300 billion GBP of quantitative easing. Combined with the COVID-19 pandemic, the UK’s Brexit struggles seem to be magnified despite the country’s attempts to keep the economy under control.

2007 Financial Crisis

The British economy was said to have been booming with UK tourists visiting the US and the financial sector enjoying the golden days before the financial crisis of 2007. The GBP soared from 2002’s 1.40 up to 2.10 USD in October of 2007, when it decreased by 35% to 1.40 USD at the beginning of 2009. The United Kingdom is believed to have been affected by the crisis more than other countries due to several factors: without a big manufacturing base, the economy depended on financial services, real estate, and retail sales for development. The growth was not based on strong grounds and it heavily relied on credit borrowing/lending.

The bubble burst in 2007 and once the housing prices dropped and credit sources dried up, the economy of the United Kingdom was left in dire straits. The impact of the 2007 crisis would remain long-felt with numerous consequences. The moment the big banks understood what was happening, bank-to-bank lending was reduced immediately.

The number of financial institutions that would still borrow discovered that the interbank lending interest rate doubled and the credit ensuring costs increased as well. Once the lending ceased, the effects were already felt across all sectors and especially in the housing industry. The FTSE 100 dropped by 5.5% in January 2008, which was perceived as the greatest loss since the crash of 2001. Soon people found it difficult to pay mortgages, resulting in fewer retail sales. Cutbacks in housing and retail sales were followed by a number of redundancies and unemployment was staggeringly high.

All of the events further aggravated the already weekend UK economy. With such a vast number of people unemployed, there was a decrease in tax revenue and the downturn continued with the fourth consecutive quarterly drop of GDP at the end of 2008.
In the hope of jump-starting the economy, the UK government reduced the VAT rate, but the effects of the crises were already too severe. The 31.3% FTSE decrease in 2009 was the biggest annual drop since 1984 and the economy just kept shrinking. The financial crisis caused a global recession with many assuming that it resulted from the recklessness of bankers.

The UK’s GDP fell more during the 1930s’ Great Depression and the GBP overall experienced elevated volatility during the entire period of the crisis. The GBP/USD hit a 26-year high in 2007 and the pound kept revealing difficulties in equities and the banking industry. Soon after, in January of 2009, the GBP market hit a 24-year low against the USD, repeating a similar scenario to the one with the EUR in 2008.

Conclusion

With the virus spreading across China in December and January, most UK businesses seemed to be preoccupied with Brexit. The ramifications of these external factors are yet to be seen, but one may see the current GBP struggles as part of its long-lived pattern. The Bank of England has once again stepped in to help the troubled economy and the benefits of those steps are already noticeable. The pound has indeed lost its safety position, placed somewhat in the middle. The currency tends to appreciate more during an economic expansion, so we have yet to see some major moves as the UK’s economy further stabilizes. 

The negative impact of Brexit on the GBP has been extensively documented over the past years, but considering the current selloff, one cannot but recall a previous episode of intense Sterling selling: the financial crisis. Investors seem to be fearful of the GBP difficulties and history seems to be repeating. The UK’s deficit is masked by a secure flow of investor capital, which in turn maintains the value of GBP above where it would be if it only reflected imports/exports. The pound largely struggled towards the beginning of the month of August, with the number of virus-inflicted patients rising across the country. 

The global economy also went through a difficult period, but the GBP experienced some bigger moves against the USD, returning to 1.30. Looking throughout August, the final resolution of Brexit is still far ahead and the expectations of a new trade deal between the UK and the EU keep the tension up.  Aside from the Brexit-related challenges, the virus pandemic also affected the currency market, making it even more unpredictable. August is witnessing the release of several important reports (GBP already came out a few days ago) and traders should pay attention to market volatility and adjust position sizing accordingly. At 1.31 USD, the GBP stands firm ahead of new Brexit negotiations.

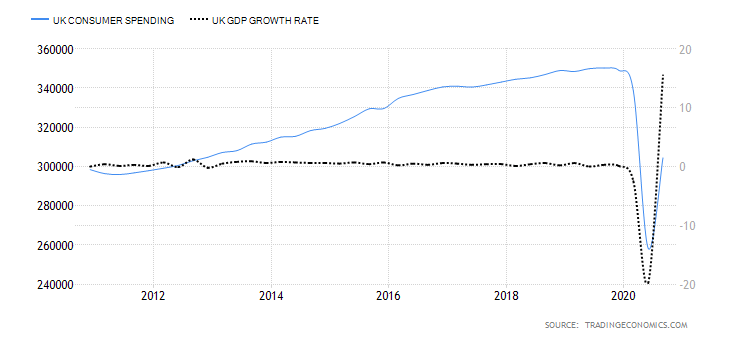
Policymakers are said to be meeting soon to discuss the relationship between London’s financial sector and the EU market. The past weekend economy was predicted to be soon seeing a rapid recovery from the impact of the virus on consumer spending. Last, the British pound is estimated to be trading at 1.30 by the end of this quarter and at 1.28 in the upcoming 12 months.

Categories
Forex Daily Topic Forex Fundamental Analysis

GBP/AUD Global Macro Analysis – Part 3

GBP/AUD Exogenous Analysis

  1. The UK and Australia Current Account Differential

In this case, the current account differential is derived by subtracting Australia’s current account balance from that of the UK. The current account shows the net value of a country’s exports. Remember that the value of a currency is determined by its demand. Theoretically, the country’s domestic currency with a higher current account balance will have a higher demand. Therefore, its value will be higher in the forex market than in currencies with lower current account balances.

In this case, if the current account differential is positive, it means that the GBP is in higher demand than the AUD, hence a bullish trend for the GBP/AUD pair. Conversely, if the differential is negative, the GBP/AUD pair will have a bearish trend.

Australia had a $7.5 billion current account surplus in Q3 2020, while the UK had a $20.97 billion deficit. The current account differential is -$28.47 billion. Consequently, the current account differential between the UK and Australia has a score of -4.

  1. The interest rate differential between the UK and Australia

This interest rate differential is the difference between the interest rate in the UK and Australia. Typically, investors prefer to buy currencies with a higher interest rate. Therefore, if the interest rate differential for the GBP/AUD pair is positive, it means that the UK offers higher interest rates than Australia. Traders would then sell AUD and buy the GBP, which implies that the GBP/AUD pair will have a bullish trend. Conversely, if the interest rate differential is negative, Australia offers a higher interest rate. Thus, traders would sell the GBP and buy the AUD, which will force the GBP/AUD pair into a downtrend.

In 2020, the Reserve Bank of Australia cut interest rates from 0.75% to 0.25% and finally to 0.1% in December. The BOE cut interest rates from 0.75% to 0.1%. As of December 2020, the interest rate differential for the GBP/AUD pair is 0%. Thus, we assign a score of -1.

  1. The differential in GDP growth rate between the UK and Australia

The differential in GDP growth rate measures the difference in domestic economic growth in the UK and Australia. It is expected that the domestic currency of the country whose GDP is expanding at a faster pace will appreciate faster. Therefore, if the GDP growth differential between the UK and Australia is positive, we should expect a bullish trend for the GBP/AUD pair. Conversely, we should expect a downtrend in the pair if the differential is negative.

The Australian economy has contracted by 4% in the first three quarters of 2020, while the UK has contracted by 5.8%. Thus, the GDP growth rate differential is -1.8%. Hence, the score of -3.

Conclusion

Indicator Score Total State Comment
The UK and Australia Current Account Differential -4 10 A differential of – $28.47 Australia has a current account surplus while the UK is running a deficit. The differential is expected to increase as COVID-19 restrictions ease
The interest rate differential between the UK and Australia -1 10 0.00% Neither the RBA nor the BOE intends to change the interest rate policy in the near term. The differential of 0% is expected to persist in the near term
The differential in GDP growth rate between the UK and Australia -3 10 -1.80% The Australian economy contracted slower than the UK’s
TOTAL SCORE -8

Since the cumulative exogenous score for the GBP/AUD pair is -8, we can expect the pair to continue a bearish trend.

According to the above picture’s technical analysis, this pair is trading below the 200-period MA and attempting to breach the lower Bollinger band, supporting our fundamental analysis. Cheers.

Categories
Forex Daily Topic Forex Fundamental Analysis

GBP/AUD Global Macro Analysis – Part 1 & 2

Introduction

This analysis will look into endogenous factors that influence economic growth both in the UK and Australia. We will also analyze the exogenous factors that impact the exchange rate of the GBP/AUD pair.

Ranking Scale

We will conduct correlation analysis, which we will use to rank the endogenous and exogenous factors on a scale of -10 to 10.

In ranking the endogenous factors, we will conduct a correlation analysis against the GDP growth rate. If the score is negative, the endogenous factor has resulted in depreciation of either the GBP of the AUD. Conversely, if the score is positive, then the factor has resulted in an appreciation of the local currency.

When the exogenous analysis is negative, the factor has resulted in a decline of the GBP/AUD exchange rate. If the score is positive, then the factor has led to an increase in the exchange rate.

Summary – GBP Endogenous Analysis

-15 score indicates that the Pound has depreciated since the starting of 2020.

Summary – AUD Endogenous Analysis

A score of -8 indicates that the Australian dollar has depreciated as well since the beginning of 2020.

Indicator Score Total State Comment
Australia Employment Rate -3 10 61.2% in October The employment rate hit 20-year lows during the pandemic. It’s expected to continue recovery as the economy recovers
Australia Core Consumer Prices 2 10 117.49 in Q3 2020 The inflation rate still lower than Q1, but the demand is increasing in the economy
Australia Manufacturing Production -3 10 Q3 projected to drop by 3.5% Q2 dropped by 6.2%. Production expected to improve in Q3 as business operation resume some normalcy
Australia Business Confidence 6 10 NAB business confidence was 12 in November It’s the highest level since April 2018. This shows that businesses are highly optimistic about their future operations
Australia Consumer Spending -3 10 Was 253.648 billion AUD in Q3 2020 Q3 levels still lower than Q1 domestic expenditure. Expected to increase further when the economy recovers to pre-pandemic levels
Australia Construction Output -3 10 Q3 output dropped by 2.6% Q3 drop caused by a reduction in residential and non-residential construction, engineering, and building works
Australia Government Budget Value -4 10 a budget deficit of 10.974 billion AUD in October The government budget deficit is improving. This shows that the revenue stream is improving as businesses resume operations
TOTAL SCORE -8
  1. Australia Employment Rate

This indicator shows the number of working-age Australians who are employed during a particular period. As an indicator of growth in the labor market, the employment rate shows if the economy is adding or shedding jobs. Thus, it is used to show periods of economic growth and contractions.

The Australian labor market has been recovering from the coronavirus pandemic shocks when the employment rate hit a 20-year low of 58.2%. In October 2020, Australia had an employment rate of 61.2%, up from 60.4% in September. However, it is still lower than January’s 62.6%. Australia’s employment rate has a score of -3.

  1. Australia Trimmed Mean Consumer Prices

This indicator is also called core consumer prices. It measures the price changes of goods and services that are frequently purchased by Australian households. The computation of the trimmed mean consumer prices excludes goods and services whose prices are volatile.

In Q3 2020, the core consumer prices in Australia rose to 117.49 from 117.04 in Q2. Q3 levels are also higher than the 117.17 points recorded in Q1. This shows that the economy is recovering since an increase in prices implies an increase in domestic demand for goods and services. We assign a score of 2.

  1. Australia Manufacturing Production

This indicator shows the YoY change in the value of output from the manufacturing sector. The Australian economy is heavily dependent on industrial production; hence, manufacturing production changes provides invaluable insights into the domestic economic growth. It also shows how the economy is recovering from the impact of COVID-19.

In Q2 2020, the YoY manufacturing production in Australia dropped by 6.2%, compared to 2.7% growth in Q1. Q3 YoY manufacturing production is expected to drop by 3.5%. Consequently, Australian manufacturing production has a score of -3.

  1. Australia Business Confidence

Business confidence in Australia is measured by conducting a monthly survey of about 600 businesses. They include small, medium, and large companies operating in non-agricultural sectors. The survey gauges the businesses’ expectations in terms of profitability, trading volume, and employees. The index is derived by considering the percentage of respondents who have good and very good expectations and those who have a bad and very bad outlook.

In November 2020, the NAB business confidence increased to 12 from 3 in October, which has been the highest since April 2018. Australia’s business confidence has a score of 6.

  1. Australia Consumer Spending

The indicator records the quarterly change in the value of goods and services consumed by domestic households. It includes expenditure by non-profit organizations that provide goods and services to Australian households and the value of backyard productions.

In Q3 of 2020, consumer spending in Australia rose to AUD 253.648 billion from AUD 235.131 billion in Q2. Although it’s lower than Q1 expenditure, domestic demand in the economy is rebounding from the slump of COVID-19. Consequently, Australian consumer spending has a score of -3.

  1. Australia Construction Output

This indicator shows the quarterly change in the value of construction work in Australia. The total value involves both private and public sector building and engineering work.

In the third quarter of 2020, Australia’s construction output dropped by 2.6% from a 0.5% growth in Q2. This drop was caused by output drop in residential and non-residential construction, engineering, and building works. Thus, we assign a score of -3.

  1. Australia Government Budget Value

The government budget value measures whether the Australian government has a budget surplus or deficit. A budget surplus implies that the government’s expenditure is less than its revenue. Similarly, a budget deficit means that the government spends more than it collects in terms of revenue.

In October 2020, Australia had a budget deficit of AUD 10.974 billion, up from a deficit of 33.613 billion in September. We assign a score of -4.

In the next article, you can find the Exogenous analysis of the GBP/AUD currency pair and also our forecast on its price movement in the near future. Cheers.

Categories
Forex Fundamental Analysis

GBP/NZD Global Macro Analysis – Part 3

GBP/NZD Exogenous Analysis

  1. The UK and New Zealand Current Account Differential

The current account differential between the UK and NZ is the value of the subtraction of the NZ current account balance and the UK’s current account. For the GBP/NZD pair, if the current account differential is positive, it means that the UK has a higher current account balance than NZ. Thus, the price of the GBP/NZD pair will increase. Conversely, if the differential is negative, NZ has a higher current account balance than the UK. Theoretically, this means that traders would be bullish on the NZD; hence, the GBP/NZD pair price would drop.

In Q3 2020, NZ had a current account deficit of $2.48 billion while the UK a deficit of $20.97 billion. This means that the current account differential is -$18.49 billion. Thus, we assign a score of -5.

  1. The interest rate differential between the UK and New Zealand

The interest rate differential for the GBP/NZD pair is the difference between the UK and NZ’s interest rate. Carry traders and investors would direct their money to the currency, which offers higher interest rates. Therefore, if the interest rate differential for the GBP/NZD pair is positive, it means that the UK offers a higher interest rate than NZ. Hence, traders will be bullish on the GBP/NZD pair. Conversely, if the interest rate differential is negative, it means that NZ has a higher interest rate than the UK. This means that traders would be bearish on the GBP/NZD pair.

In 2020, the Reserve Bank of New Zealand cut its official cash rate from 1% to 0.1%, while the BOE cut the interest rate from 0.75% to 0.1%. In this case, the interest rate differential is 0%. Thus, we assign a score of 0.

  1. The differential in GDP growth rate between the UK and New Zealand

This differential shows which economy is expanding faster between the NZ economy and the UK economy. Comparing domestic economies using their GDP growth rates is more effective than using absolute GDP figures since they vary in size.

If the GDP growth rate differential is negative, the NZ economy is growing faster than the UK economy. This would result in a bearish trend for the GBP/NZD pair. Conversely, the pair will have a bullish trend if the differential is positive since it would mean that the UK economy is expanding more than the NZ economy.

The first three quarters of 2020 saw the NZ economy expand by 0.4% and the UK contract by 5.8%. In this case, the GDP growth rate differential is -6.2%. Hence, the score of -4.

Conclusion

Indicator Score Total State Comment
The UK and New Zealand Current Account Differential -5 10 A differential of – $18.49 NZ has a lower current account deficit than the UK.
The interest rate differential between the UK and New Zealand 0 10 0.00% The 0% interest rate differential is expected to persist in the short-term. That’s because neither the RBNZ and the BOE have scheduled changes in the monetary policy
The differential in GDP growth rate between the UK and New Zealand -4 10 -6.20% New Zealand’s economy expanded by 0.4% in the first three quarters of 2020, while the UK contracted by 5.8%
TOTAL SCORE -9

GBP/NZD exogenous factors have a cumulative score of -9. It means we should expect a continued downtrend in the pair for the short term.

In the above image, we can see that this pair’s weekly chart trading below the 200-period MA for the first time since August 2019. Cheers.

Categories
Forex Fundamental Analysis

GBP/NZD Global Macro Analysis – Part 1 & 2

Introduction

In this analysis, we will analyze endogenous factors that influence both the UK and New Zealand economies. The analysis will also include exogenous factors that impact the exchange rate between the GBP and the NZD.

Ranking Scale

We’ll rank the endogenous and exogenous factors on a scale from -10 to +10.

The score of the endogenous factors will be determined from correlation analysis between the GDP growth rate. If the score is negative, the endogenous factor had a devaluing effect on the domestic currency. Conversely, if the score is positive, the factor led to the appreciation of the domestic currency.

Similarly, we’ll do a correlation analysis between the exogenous factors and the GBP/NZD exchange rate. If the correlation is negative, the factor results in a drop in the exchange rate. If positive, then the exogenous factor increases the exchange rate.

Summary – GBP Endogenous Analysis

-15 score on Pound’s Endogenous Analysis indicates that this currency has depreciated since the beginning of 2020.

Summary – NZD Endogenous Analysis

A positive 5 indicates that the New Zealand dollar has appreciated since the beginning of this year.

Indicator Score Total State Comment
New Zealand Employment Rate -7 10 66.4% in Q3 2020 The NZ labor market is yet to recover from the economic disruptions of the pandemic
New Zealand Core Consumer Prices 1 10 1054 points in Q3 2020 From Q1 to Q3, inflation has increased by 1 point
New Zealand Industrial Production 5 10 A 3.1% increase in Q3 The NZ industrial sector is rebounding from a 12.1% drop in Q2.
New Zealand Business Confidence 7 10 Was 9.4 in November November showed the first positive reading in ANZ business confidence since August 2018
New Zealand Consumer Spending 5 10 Q3 spending was 41.335 billion NZD. Q3 consumer spending was the highest recorded in 2020. This shows that the domestic demand has recovered beyond the pre-pandemic period
New Zealand Construction Output -4 10 Q2 output dropped by 24.2% The worst decline in construction output in about 18 years. It’s bound to increase as COVID-19 restrictions ease
New Zealand Government Budget Value -2 10 2020 projected deficit of 4.5 billion NZD This would be a drop from a surplus of 7.5 billion NZD in 2019. Attributed to the increase in government spending during the pandemic
TOTAL SCORE 5
  1. New Zealand Employment Rate

The employment rate shows the growth in New Zealand’s labor market. The change in the labor market shows how the economy is performing – especially in the coronavirus pandemic. The labor market shows if the economy is churning out new jobs or if jobs are lost. Thus, the growth of the labor market is a leading indicator of economic growth.

In Q3 2020, New Zealand’s employment rate dropped to 66.4% from 67.1% in Q2 and 67.7% in Q1. This shows that the labor market is yet to recover from the economic shocks of the pandemic. The New Zealand employment rate has a score of -7.

  1. New Zealand Core Consumer Prices

This indicator samples the price changes in a basket of the most commonly purchased goods and services by households. The price changes represent the rate of inflation in the overall economy. Note that the computation of the core consumer prices excludes goods and services whose prices tend to be volatile. It helps avoid seasonal distortions in the index.

In Q3 of 2020, the core consumer prices in New Zealand rose to 1054 points from 1048 in Q2. The index had only increased by 1 point in 2020. Thus, we assign a score of 1.

  1. New Zealand Industrial Production

Industrial production in New Zealand refers to the YoY change in total manufacturing sales. It measures the YoY change in sales volume in the manufacturing sector. A survey of 13 industries across the manufacturing sector is surveyed to derive the YoY manufacturing sales data for the whole sector. Some of these industries include; petroleum and coal products, metal products, machinery, equipment and furniture, and food and beverage. Naturally, expansion in industrial production corresponds to the expansion of the economy.

New Zealand manufacturing sales rose by 3.1% in Q3 2020 from a drop of 12.1%. This is the largest YoY increase in manufacturing sales in three years. It shows that the economy is rebounding. We assign a score of 5.

  1. New Zealand Business Confidence

NZ business confidence is a survey of about 700 businesses. They are polled to establish their expectations about the future business operating environment and economic growth in general. Some aspects surveyed include; activity outlook, employment prospects, capacity utilization, and investment decisions.

In December 2020, the NZ ANZ business confidence rose to 9.4 from -6.9 in November. This shows an increased optimism in NZ businesses since it is the first positive reading since August 2018. Thus, we assign a score of 7.

  1. New Zealand Consumer Spending

This measures the value of the quarterly consumer expenditure in NZ. Changes in consumer expenditure go hand in hand with domestic demand changes in the economy, which drive GDP growth.

In Q3 2020, the NZ consumer spending increased to NZD 41.335 billion from NZD 35.197 billion in Q2. More so, the Q3 consumer spending is more than the NZD 40.04 billion recorded in Q1. Consequently, the NZ consumer spending has a score of 5.

  1. New Zealand Construction Output

This indicator shows the overall change in the value of all construction work done by contractors in NZ. It compares the YoY quarterly change, which helps to show if the economy is expanding or contracting.

In Q2 2020, the NZ construction output dropped by 24.2% compared to the 4.1% drop in Q2. This is the worst drop in over 18 years. Thus, we assign a score of -4.

  1. New Zealand Government Budget Value

This is the difference between the revenues that the NZ government collects and the amount it spends. Deficits arise if the revenues are less than expenditures, while surplus occurs when the revenues exceed expenditure.

In 2019, the NZ government had a budget surplus of NZD 7.5 billion. In 2020, it was projected that the budget would hit a deficit of NZD 4.5 billion. This is due to increased government expenditure to alleviate the pandemic’s economic shocks while revenues have been depressed due to nationwide shutdowns. Thus, we assign a score of -2.

For the exogenous analysis of both of these currencies, you can check our very next article. In case of any queries, let us know in the comments below. Cheers.

Categories
Forex Fundamental Analysis

GBP/CHF Global Macro Analysis – Part 3

GBP/CHF Exogenous Analysis

  1. The UK and Switzerland Current Account Differential

A country’s current account shows the sum of its net exports, net secondary income, and net primary income. In this case, the current account differential is the difference between the UK’s current account balance and Switzerland.

In international trade, when a country has a current account surplus, it means the value of its exports is higher than imports. Thus, its domestic currency is in higher demand in the forex market. Therefore, if the current account differential is positive, it implies that the UK has a higher current account than Switzerland. We can then expect that the price of the GBP/CHF pair will increase. Conversely, a negative differential would mean that Switzerland has a higher current account than the UK. In this case, the price of the GBP/CHF pair is expected to drop.

Switzerland had a current account surplus of $10.11 billion in the third quarter of 2020, while the UK had a $20.97 billion deficit. The current account differential is -$31.08 billion. Hence a score of -7.

  1. The interest rate differential between the UK and Switzerland

Interest rate differential is the swiss interest rate subtracted from the interest rate in the UK. Forex carry traders use a pair’s interest rate differential to establish whether to buy or short the pair. For GBP/CHF, if the interest rate differential is positive, it means that the UK’s interest rate is higher than in Switzerland. This makes traders and investors go long on the pair; hence, a bullish trend.

Conversely, if the interest rate differential is negative, it means that Switzerland’s interest rate is higher than in the UK. Thus, forex traders will short the GBP/CHF pair; hence, a bearish trend.

The Swiss National Bank has maintained the interest rate at -0.75%, while the UK’s interest rate is 0.1%. Therefore, the GBP/CHF interest rate differential is 0.85%. It has a score of 3.

  1. The differential in GDP growth rate between the UK and Switzerland

GDP growth rate differential is the difference between the economic growth in the UK and Switzerland. A negative differential means that the UK’s economy is expanding faster than that of Switzerland. Consequently, the GBP/CHF pair will adopt a bullish trend. Conversely, if the GDP growth rate differential is negative, the swiss economy is growing faster than that of the UK. Hence, the GBP/CHF pair will adopt a bearish trend.

The UK economy has contracted by 5.8% in the first three quarters of 2020, while the swiss economy has contracted by 1.5%. That means the GDP growth rate differential is -4.3%. We assign a score of -3.

Conclusion

Indicator Score Total State Comment
The UK and Switzerland Current Account Differential -7 10 A differential of – $31.08 Switzerland has a $10.11 billion current account surplus, while the UK has a deficit of $20.97 billion
The interest rate differential between the UK and Switzerland 3 10 0.85% The differential is expected to remain at 0.85% all through 2021
The differential in GDP growth rate between the UK and Switzerland -3 10 -4.30% Switzerland’s economy contracted by 1.5% in the first three quarters of 2020 while the UK by 5.8%
TOTAL SCORE -7

The exogenous analysis of the GBP/CHF pair has a cumulative score of -7. Thus, we can expect a short-term downtrend in the pair.

In technical analysis, GBP/CHF’s weekly price is seen bouncing off from the upper Bollinger band.

We hope you find this analysis informative. Let us know if you have any questions in the comments below. Cheers.

Categories
Forex Fundamental Analysis

GBP/CHF Global Macro Analysis – Part 1 & 2

Introduction

The global macro analysis of the GBP/CHF currency pair will involve analysing endogenous and exogenous factors. Endogenous factors drive the domestic GDP growth in the UK and Switzerland. Exogenous factors influence the exchange rate for the currency pair.

Ranking Scale

The analysis will rank the endogenous and exogenous factors on a scale from -10 to +10. The score for endogenous factors will be determined from a correlation analysis with the domestic GDP growth rate. If the score is negative, it means that the endogenous factor has led to the domestic currency depreciation. If positive, it has caused the appreciation of the domestic currency.

The exogenous analysis score is from a correlation analysis with the exchange rate for the GBP/CHF pair. When the score is negative, traders can expect the bearish trend for the pair. If positive, then the pair is expected to have a bullish trend.

Summary – GBP Endogenous Analysis

A -15 score implies that GBP has depreciated since the beginning of 2020.

Summary – CHF Endogenous Analysis

A score of 3 implies that CHF has partially appreciated since the beginning of this year.

Indicator Score Total State Comment
Switzerland Employment Rate -3 10 79.7% in Q3 2020 Slightly below the 80.4% recorded in Q1.
Switzerland Core Consumer Prices 4 10 100.82 points in November Inflation, as measured by the core consumer prices, rose by 0.28 points from January to November
Switzerland Manufacturing Production -2 10 4.7% decrease in Q3 2020 The YoY swiss manufacturing production is recovering
Switzerland Business Confidence 3 10 103.5 in November Swiss KOF Economic Barometer dropped in October and November. The majority of the consecutive drop was driven by private consumption
Switzerland Consumer Spending 5 10 Q3 spending was 91.929 billion CHF Q3 had the highest consumer spending compared to Q1 and Q2.
Switzerland Construction Output -2 10 A 0.4% drop in Q3 2020 Q3 output recovered from the 5% drop in Q2 but is still lower than the 3.1% growth in Q1
Switzerland Government Budget Value -2 10 An expected deficit of 2.2 billion CHF in 2020 Switzerland had a surplus of 8.1 billion CHF in 2019. The projected deficit is on account of aggressive government stimulus program and decreases in revenue due to COVID-19
TOTAL SCORE 3
  1. Switzerland Employment Rate

The Swiss employment rate measures the quarterly change in the percentage of the labour force that is employed. Changes in the number of people employed in the economy are a leading indicator of economic growth. When the economy is expanding, businesses create more job opportunities; hence, higher employment rate. Conversely, a shrinking economy leads to job cuts, which result in a lower employment rate.

In 2020 Q3, the Switzerland employment rate rose to 79.7% from the 6-year lows of 79.1%. Although the Q3 employment rate is lower than the 80.4% recorded in Q1, it shows that the Swiss economy is recovering from the economic shocks of COBID-19. The swiss employment rate scores -3.

  1. Switzerland Core Consumer Prices

Core consumer prices measure the rate of inflation by monitoring the price changes of only a select basket of goods and services. Consumer products with volatile prices are excluded. The rate of inflation is a leading indicator of economic growth. That’s because when inflation rises, it means domestic demand is on the rise, too, hence a higher GDP growth rate. Similarly, a decrease in the inflation rate means domestic demand is depressed, which may be followed by a contracting economy.

In November 2020, the swiss core consumer prices dropped to 100.82 points from 100.89 points in October. However, it is still higher than 100.54 points recorded in January. It has a score of 4.

  1. Switzerland Manufacturing Production

This measures the YoY change in the value of output from the swiss manufacturing sector. This sector plays a significant role in the Swiss economy. Therefore, growth in manufacturing production is accompanied by growth in the labour market and, consequently, the domestic economy’s expansion.

In Q3 of 2020, the YoY swiss manufacturing production dropped by 4.7%. That’s an improvement from the 9.6% drop in Q2. We assign a score of -2.

  1. Switzerland Business Confidence

The KOF Swiss Economic Institute compiles this index. It measures company managers’ optimism based on their perspective of the economy and the growth prospects of their businesses. The business that is surveyed are drawn from multiple sectors in the economy and contains 219 different variables.

In November 2020, the Swiss KOF Economic Barometer dropped to 103.5 from 106.3 in October. This marks the send consecutive month of a drop in the swiss business confidence. Notably, the drop in the index is primarily driven by the manufacturing sector and private consumption. Swiss business confidence has a score of 3.

  1. Switzerland Consumer Spending

This is the value of the total consumption by Swiss households. Domestic consumption is a primary driver of GDP growth. More so, it also an indicator of the performance in the labour market. With a higher rate of employment, disposable income increases, which increases consumer spending.

Swiss consumer spending increased to CHF 91.929 billion in the third quarter of 2020, which is the highest recorded compared to CHF 89.79 billion in Q1 and CHF 82.03 billion in Q2. It has a score of 5.

  1. Switzerland Construction Output

This indicator measures the percentage change in the value paid for construction work in Switzerland. The construction work includes building and engineering works done by public and private companies. Typically, when construction work increases, it is expected to be accompanied by an increase in the employment rate and economic growth.

In the third quarter of 2020, the YoY swiss construction output dropped by 0.4%. That is an improvement compared to the 5% drop in Q2 but still less than the 3.1% growth recorded in Q1. It has a score of -2.

  1. Switzerland General Government Budget Value

This represents the difference between the revenues received by the Swiss government and its expenditures. Government expenditure includes all transfer payments and purchases of goods and services. The general government budget value shows if the Swiss government has a surplus or a deficit. Too much deficit means that the economy is probably not responding to expansionary fiscal policies.

In 2019, the Swiss government had a budget surplus of CHF 8.097 billion. In 2020, the general government budget was expected to hit a deficit of CHF 2.2 billion. This deficit is primarily driven by a significant drop in revenue collection due to COVID-19. It has a score of -2.

In the very next article, you can find the Exogenous analysis of the GBP/CHF currency pair, so make sure to check that out. Cheers.

Categories
Forex Fundamental Analysis

GBP/JPY Global Macro Analysis – Part 2

JPY Endogenous Analysis

Summary

An overall score of -13 implies that this currency (JPY) has depreciated since the beginning of this year.

Indicator Score Total State Comment
Japan Employment Rate -4 10 60.4% in October 2020 The Japanese labor market has shed about 820,000 jobs between January and October 2020
Japan Core Consumer Prices -1 10 101.2 points in November 2020 The index has dropped marginally by 0.8 points in the first 11 months
Japan Manufacturing Production 2 10 3.1% drop in October The decrease in YoY manufacturing production is slowing down
Japan  Business Confidence -2 10 Q4 reading was -10 Businesses are growing increasingly optimistic
Japan Consumer Spending -2 10 Was ¥280.8 trillion in Q3 2020 The increase in Q3 expenditure by households shows that the economy is steadily recovering
Japan Construction Industry Activity -2 10 YoY drop of 6.9% in July 2020 The July drop was the second-worst recorded in over ten years
Japan Government Budget Value -4 10 the budget deficit of ¥308414 in Q2 2020 This is the worst deficit in 20 years. It’s expected to improve as the economy goes back to normal
TOTAL SCORE -13
  • Japan Employment Rate

This indicator shows the number of Japanese nationals employed as a percentage of the entire Japanese working-age population. With this indicator, we can track the Japanese economy’s performance since employment corresponds to the expansion and contraction of the economy.

In October 2020, the Japan employment rate rose to 60.4% from 60.3% in September. Although Japan’s employment rate is higher than in January, the labor market has lost about 820,000 jobs since January. We assign a score of -4.

  • Japan Core Consumer Prices

Core consumer prices measure the inflation rate in Japan based on a select basket of goods. The core consumer prices do not include goods and services with volatile prices. Typically, when inflation rises, it implies that the economy is expanding and the labor market is growing. Conversely, when the index drops, it means that the labor market is shrinking.

In November 2020, Japan Core Consumer Prices dropped to 101.2 points from 101.3 in October. Since January, the index has shed 0.8 points. Thus, it scores a -1.

  • Japan Manufacturing Production

This indicator measures the percentage change in the value of the output in the manufacturing sector. Since the Japanese economy is highly reliant on the manufacturing sector, changes in this indicator can be considered a leading indicator of economic growth.

In October 2020, the YoY manufacturing production in Japan decreased by 3.1% compared to the 9% decrease recorded in September. The October decrease is the slowest since February.  We assign a score of 2.

  • Japan Business Confidence

In Japan, the business confidence index results from a survey of about 1100 large manufacturers with a capital of at least ¥1 billion. The survey evaluates the current industry trends, business conditions within the company and the industry, and expectations for the next quarter and year. The sentiment in Japanese businesses is ranked with an index of a scale from -100 to +100. The negative index shows pessimism, while a positive index shows optimism.

In Q4 of 2020, the Bank of Japan’s Tankan business sentiment index increased to -10 from -27 in Q3. This improvement shows that the economy is potentially recovering from the impact of the COVID-19 pandemic. However, it is still lower than the -8 registered in Q1. Thus, we assign a score of -2.

  • Japan Consumer Spending

It tracks the quarterly value of expenditure by households. In Japan, the consumption expenditure accounts for both the supply-side and demand-side. The supply-side from the survey of family income, while the demand-side is from the expenditure survey. The weighted average of both these estimates represents the final consumption expenditure.

In Q3 2020, the consumer spending in Japan rose to ¥280.8 trillion from ¥268.2 trillion in Q2. However, it is still lower than the consumer spending recorded in Q1. Japan consumer spending scores -4.

  • Japan Construction Industry Activity

This index tracks the YoY changes in the construction industry in Japan. It shows the changes in companies’ monetary value of construction work and billed to the clients. Note that in Japan, the construction industry accounts for about 6% of the total industrial activity. Thus, the construction output index can be a leading indicator of the entire industrial activity. More so, since it is a tertiary industry, it can signal longer-term changes in the GDP.

In July 2020, Japan’s YoY construction output dropped by 6.9%. This drop is the second-worst in over ten years. The worst was recorded in June at -7.9%. The Japan construction industry activity scores -2.

  • Japan Government Budget Value

In Japan, the government budget value evaluates the difference between government revenues and expenditure. This is meant to determine whether there is a government budget surplus or deficit. A budget surplus arises when revenues exceed the expenditure, while a deficit occurs when government expenditure is more than revenues.

In Q2 of 2020, Japan has a government budget deficit of ¥308414. This is the worst deficit recorded in over two decades. Thus, the Japan Government Budget Value has a score of -4.

In the upcoming article, you can find the Exogenous analysis of the GBP/JPY currency pair where we have forecasted its price movements. All the best.

Categories
Forex Fundamental Analysis

GBP/JPY Global Macro Analysis – Part 1

Introduction

The GBP/JPY pair’s global macro analysis interrogates the endogenous factors that drive the GDP growth in the UK and Japan. The analysis will also cover exogenous factors that affect the exchange rate between the GBP and the JPY.

Ranking Scale

The analysis will use a sliding scale from -10 to +10 to rank the endogenous and exogenous factors’ impact. Endogenous factors impact the value of the domestic currency. Thus, when it is negative, it means that the domestic currency has depreciated. When positive, it means that the domestic currency has increased in value during the period under review. The ranking of the endogenous factors is based on correlation analysis with the domestic GDP.

On the other hand, a positive ranking for the exogenous factors means that the GBP/JPY pair’s price will increase. Conversely, when negative, it means that the price of the pair will drop. This ranking is derived from correlation analysis between the exogenous factors and the GBP/JPY exchange rate fluctuation.

GBP Endogenous Analysis – Summary

A score of -15 implies that GBP has depreciated since the beginning of this year.

Indicator Score Total State Comment
UK Employment Rate -5 10 75.2% in September 2020 Dropped by 1.4% from January to September. The labor market has shed around 551,000 jobs
UK Core Consumer Prices 2 10 109.82 points in November 2020 The UK core consumer prices have increased by 1.82 points since January. Shows that the demand in the domestic economy has not been depressed
UK Factory Orders 3 10 Was -25 in November The CBI trends orders are improving. The -25 recorded in November was the highest since February
UK Business Confidence -2 10 Neutral in Q4 of 2020 UK businesses are still pessimistic about the future operating environment.
UK Consumer Spending -5 10 Was £304.5 billion in Q3 2020 Q3 household expenditure shows domestic demand is recovering from the lows of Q2. Consumer spending is still below the pre-pandemic Q1 levels
UK Construction Output -2 10 YoY drop of 7.5% in October 2020 The construction output is improving, which implies that the UK economy is steadily recovering from the economic disruptions of the pandemic
UK Government Budget Value -6 10 UK public sector net borrowing deficit was £22.3 billion The growing budget deficit is a result of increased government expenditure in the wake of COVID-19 pandemic. Also worsened by reduced revenues due to business disruption
TOTAL SCORE -15
  • United Kingdom Employment Rate

The employment rate shows the percentage of the UK labor market that is actively and gainfully employed. It is a comprehensive representation of the growth in the labor market. Note that the changes in the employment rate measure the changes in the economic activities of a country.

In September 2020, the UK employment rate dropped to 75.2% from 75.3% in August. From January to September 2020, the employment rate has dropped by 1.4%, equivalent to about 551,000 job loss. The UK employment rate scores -5.

  • United Kingdom Core Consumer Prices

This index measures the change in the rate of inflation in the UK by tracking price changes of specific consumer products. The index calculation excludes items whose prices tend to be highly volatile, such as fuel and energy.

In November 2020, the core consumer prices in the UK dropped to 109.82 from 109.9 in October. The index has increased by 1.82 points since January. The UK core consumer prices score 2.

  • United Kingdom Factory Orders

In the UK, the CBI Industrial Trends Orders tracks orders from about 500 companies in 38 sectors of the manufacturing industry. The survey’s components include domestic goods orders, exports, inventory, output prices, and expectations of future investments and output levels. The surveyed manufacturers respond whether the current conditions are normal, above, or below normal. This is used as a leading indicator of industrial production.

In December 2020, the UK CBI trends orders were -25, 15 points up from -40 in November. This is the highest level since February 2020 but still lower than -18 in January. We assign a score of 3.

  • United Kingdom Business Confidence

This index gauges the optimism of businesses operating in the UK. A survey is conducted on 400 small, medium, and large companies to determine their optimism. The survey covers exports, output levels and prices, capacity, order books, inventory, competitiveness in the domestic market,  innovation, and training. The business sentiment is then ranked from -100 to +100, with 0 showing neutrality.

In the fourth quarter of 2020, the UK business confidence was neutral at 0, a slight change from -1 in Q3. It is, however, still below the 23 recorded in Q1. We assign a score of -2.

  • United Kingdom Consumer Spending

Expenditure by households contributes to a significant proportion of the domestic GDP. In the UK, this index tracks quarterly changes in the amount of money spent by households and Non-profit institutions serving households (NPISH). Note that when the economy is performing well, consumer spending is high. Conversely, a poorly performing economy corresponds to low consumer spending.

In Q3 2020, consumer spending in the UK rose to £304.5 billion from £258.3 billion in Q2. However, the Q3 expenditure is still lower than Q1. The UK consumer spending scores -5.

  • United Kingdom Construction Output

This economic indicator tracks the yearly change in the value of work done in the construction sector. The amount of money charged by construction companies in the UK is based on a sample of 8000 companies that employ over 100 employees. Note that in the UK, the construction sector contributes about 6.4% of the GDP.

In October 2020, the UK’s YoY construction output dropped by 7.5%, up for the 10% drop recorded in September. This marks the smallest decrease in the UK’s construction output since the pre-pandemic period. We assign a score of -2.

  • United Kingdom Government Budget Value

This indicator tracks the changes between the government’s revenues and expenditure. When the revenue exceeds the expenditure, it is a surplus and indicates that the economy is expanding. When the deficit is increasing, it means that the government is spending much more than it receives. This poses a threat of overburdening the economy with future debt repayment obligations.

In October 2020, the UK public sector net borrowing deficit was £22.3 billion. This is an improvement from the deficit of £28.6 billion in September. In January 2020, the UK had a surplus of £9.6 billion. Thus, we assign a score of -6.

In the next article, we have discussed the endogenous analysis of JPY currency to see how it has performed in the year’s due course. Make sure to check that out. Cheers.

Categories
Forex Fundamental Analysis

EUR/GBP Global Macro Analysis – Part 2

GBP Endogenous Analysis – Summary

The GBP endogenous analysis has a score of -9. We can therefore understand that the GBP has depreciated in 2020.

  • United Kingdom Employment Change

The UK unemployment change measures the changes in the number of people who are above 16 years and employed. This data is a 3-month moving average of the change in employment, which measures a general trend in the labor industry changes, which typically corresponds to fluctuations in the economy.

In the three months to September 2020, the number of employed people in the UK dropped by 164,000. The YoY employment change shows a drop of 247,000 jobs, which is the worst in ten years. Based on correlation analysis, we assign a score of -7.

  • United Kingdom GDP Deflator

The UK GDP deflator is used as a measure of the comprehensive change in inflation. It filters out any nominal price changes in the entirety of the goods and services produced within the UK.

In Q3 of 2020, the UK GDP deflator dropped to 109.12 from 111.9 in Q2 – the highest ever recorded in UK history. The UK GDP deflator has increased by 6.41in 2020. We, therefore, assign a score of 4 based on its correlation with the GDP growth.

  • United Kingdom Industrial Production

This indicator tracks the changes in all the firms operating under the industrial sector in the UK. The manufacturing sector accounts for about 70% of the total industrial output. The major components of the manufacturing sector are food, tobacco, and drinks, which account for 11%. The manufacture of transport equipment and basic metals account for 17%, pharmaceuticals and non-metallic 6% each. Quarrying and mining activities account for 12% of the industrial production, with 10% for oil and gas extraction.

In September 2020, MoM industrial production in the UK rose by 0.5 while YoY dropped by 6.3%. Despite the growth and recovery of industrial activity from the coronavirus pandemic, the output is still 5.6% lower than the pre-pandemic levels. Thus, we assign a score of -3 based on correlation with GDP growth.

  • United Kingdom Manufacturing PMI

This index is a result of a survey of about 600 companies in the industrial sector. It is a composite of new orders, which accounts for 30%, output 25%, employment 20%, deliveries from suppliers 15%, and inventory 10%. When the index is above 50, it shows that the manufacturing sector is expanding. Below 50, the manufacturing sector is expected to contract, which impacts the GDP output.

In November 2020, the UK manufacturing PMI was 55.6 – the highest recorded in three years. This was mainly driven by increased inventories and increased new orders as a result of Brexit. We assign a score of 3 based on correlation with the GDP growth rate.

  • United Kingdom Consumer Spending

Consumer spending in the UK shows the amount of money that households spent on the purchase of goods and services in the retail sector. Note that expenditure by households is among the primary drivers of GDP growth.

In Q3 of 2020, the UK consumer spending rose to £304.5 billion from £258.32 billion in Q2. This increase is attributed to the restriction imposed at the onset of the coronavirus outbreak, resulting in the economic slowdown. It is, however, still lower than the pre-pandemic levels. Thus, we assign a score of -5 based on correlation with the GDP growth rate.

  • United Kingdom Consumer Confidence

In the UK, GfK surveys about 2000 households to establish their opinions about the past and future economic conditions, their financial situation, and prospects of saving. The survey period covers about 12 months into the future, which makes it a leading indicator of consumer spending, and by extension, the overall economy.

In November 2020, the UK consumer confidence dropped to -33 edging closer to yearly lows of -34 registered at the height of the pandemic. We assign a score of -5 based on its correlation with the GDP growth rate.

  • United Kingdom Public Sector Net Debt to GDP

This ratio tracks the indebtedness of the UK economy. Based on the economy out, both domestic and foreign investors use the ratio to determine whether the UK can be able to service its debt obligations in the future comfortably.

In the financial year 2018 – 2019, the UK’s public sector net debt to GDP was 80.8%, down from 82.4%. In 2020, it is expected to hit 100% with a longer-term average of 91%. We assign a score of 4 since the increased net pubic debt managed to avoid a deeper recession in 2020.

In the next article, we have performed the Exogenous analysis of the EUR/GBP pair and concluded what trend to expect in this currency pair in the near future. Cheers.

Categories
Forex Fundamental Analysis

GBP/USD Global Macro Analysis – Part 3

Introduction

The exogenous analysis will cover international aspects that impact both the UK and the US and how they influence the GBP/USD price. These factors include:

  • Good trade balance
  • Interest rate differential
  • GDP growth differential

GBP/USD Exogenous Analysis – Summary 

The score for the exogenous analysis of the GBP/USD pair is -3. This deflationary score implies that we should expect that the pair will adopt a bearish trend in the near term.

Goods trade balance

The goods trade balance is the difference between the value of goods a country imports and its exports. When the balance is negative, it means that the country is importing more than it exports. If the goods trade balance is a surplus, it means that a country’s value of exports is more than its imports.

In September 2020, the UK’s goods trade deficit increased to £9.35 billion while that of the US increased to $80.29 billion. Based on the correlation between t goods trade balance and the price of GBP/USD, we assign it an inflationary score of 2. It means if the goods trade balance keeps widening between the two countries, we can expect that the GBP/USD pair will continue being bullish.

The UK and the US Interest rate differential

This is the difference between the interest rate set by the Bank of England and the interest rate fixed by the US Federal Reserve. Capital tends to flow towards the economy with a higher interest rate since investors are bound to earn higher returns.

The BOE has set the interest rate at 0.1%, while the FED has it at 0.25%. therefore, the interest rate differential for the GBP/USD pair is 0.1% – 0.25% = -0.15%. Based on the interest rate differential, the GBP/USD pair should have a bearish trend. Therefore, we assign it a score of -3.

GDP growth differential

The actual size of the GDP varies from country to country. However, we can compare the rate at which they grow and analyse the impact of this growth rate on the exchange rate.

In the third quarter of September 2020, the UK GDP expanded by 15.5% while that of the US expanded by 33.1%. Over the years, we can observe that the US GDP growth has been at a faster rate than that of the UK. In this case, we assign a deflationary score of -2 on the UK and the US GDP growth rate differential. That means if the US economy keeps expanding at a faster rate, we can expect a bearish GBP/USD in the near term.

Our technical analysis also supports the forecasted bearish trend in the near term. Note that the GBP/USD pair has failed to breach the upper Bollinger band forming a resistance level for the past two years.

We hope you found this analysis useful and informative. Let us know if you have any questions by commenting below. All the best.

Categories
Forex Fundamental Analysis

GBP/USD Global Macro Analysis – Part 1 & 2

Introduction

To properly understand the dynamics of the price of the GBP/USD pair, we’ll conduct endogenous and exogenous analyses of the UK and the US economies.

The endogenous analysis will focus on the significant fundamental economic indicators that drive economic growth in either country. The exogenous analysis will dig deeper into how both the US and the UK economies interact with each other in terms of international trade that impact the currency exchange.

Ranking Scale

Both the endogenous and the exogenous factors that we will analyse will be ranked on a sliding scale from -10 to +10. A negative score means that the indicator resulted in currency depreciation, while a positive score implies that it led to currency appreciation.

USD Endogenous Analysis – Summary

The USD endogenous factors recorded a score of -19.1, implying a deflationary effect on the USD. This essentially means that according to these indicators, the USD has lost its value since the beginning of this year.

You can find the complete USD Endogenous Analysis here.

GBP Endogenous Analysis – Summary

The endogenous analysis of the UK economy results in an expansionary score of 2. Therefore, we could expect the GBP increased in 2020.

Markit Manufacturing PMI

This is a survey done on about 600 purchasing managers in the manufacturing industry, who rate the level of the business environment such as prices, new orders, inventories, supply deliveries, labour conditions, and production levels.

This is a leading indicator for the economy because businesses react almost instantly to the changing operating environment, and the purchasing managers have the most relevant insight. In November 202, the UK Manufacturing PMI was 55.2, showing that the economy is undergoing a sustained recovery. Due to its low correlation with the GDP, we assign an inflationary score of 3.

UK inflation

The CPI is based on a monthly survey done by the Office for National Statistics. This is done by comparing the current average of sample consumer items by the previous month’s prices. The BOE uses the data to adjust interest rates and QE levels to set inflation targets for the economy.

Rising inflation levels lead to higher interest rates, which makes CPI a vital currency valuation indicator. The UK inflation rate increased by 0.7% in October 2020 but is still lower than the rate in the pre-pandemic period. Based on our correlation analysis. We assign it a score of -4.

Manufacturing Production

It measures the change in the total value of inflation-adjusted output by the manufacturers in the whole economy. It is a leading indicator of the economy’s performance since production levels adjust quickly to the business cycles and heavily dependent on consumer conditions like employment changes and earning levels.

Manufacturing contributes about 80% of the UK’s industrial output and accounts for up to 42.4% of GDP changes. The year-on-year manufacturing production change in September 2020 was -7.9%. This marks the smallest decline since the onset of the coronavirus pandemic. Due to its high correlation with GDP, we assign it an inflationary score of 6.

Claimant count change

It measures the change in the number of people who are seeking unemployment benefits. Hence, it is the primary indicator of unemployment levels, which makes it a vital signal of consumer expenditure levels and labour market conditions. In the UK, claimant count change is considered the best measure of the employment situation, and it accounts for 30% of changes in the GDP.

In September 2020, the number of people in the UK who claimed unemployment benefits dropped by 29800. However, the unemployment rate remains at yearly highs of 4.8%. For this reason, we assign a score of -5.

Industrial Production

It measures the change in output from the mines, manufacturers, and utilities, adjusted for inflation. While manufacturing makes up 80% of the industrial production, mines and utilities make up 20%, and their effects on the real economy are thus overshadowed.

It is a significant leading indicator of the economy’s health since industrial activities correspond to labour market conditions and sensitive to business cycles. In September 2020, the UK industrial MoM production increased by 0.5%. However, on a YoY basis, it is down 6.3% from September 2019. In this case, we assign industrial production a score of -3.

Retail Sales

It measures the change in the inflation-adjusted value of all sales at the retail level in the whole economy. It is the primary measure of how much consumer expenditure accounts for most of the country’s economic activity.

In October 2020, the UK MoM retail sales increased by 1.2%, which is the 6th consecutive increase in retail sales from the slump recorded at the height of the coronavirus pandemic. Based on its correlation with GDP, we assign retail sales an inflationary score of 4.

Markit Services PMI

This is a survey on about 400 purchasing managers in the services industry, who rate the business environment using factors such as employment, new orders, pricing, inventories, and supplier deliveries. A score of above 50 signifies an expansion, while below 50 indicates a contraction in the services industry.

In November 2020, the Marking UK Services PMI was 45.8 – a significant drop from 51.4 in October. Although the Services PMI has increased from the April lows, it is still lower than in January 2020. Combined with its low correlation with the UK GDP, we assign a deflationary score of -3.

United Kingdom Public Sector Net Debt to GDP

This is also called Government Debt to GDP Ratio. Most investors, bilateral and multilateral lenders use this ratio to determine a country’s ability to service any debt they take on. Naturally, when the ratio is higher, it means that the government is piling on more debt, but the GDP is not increasing at the same rate. Since higher GDP would mean higher sources of revenue, if the GDP is not increasing at the same pace as the amount of debt, it implies that the government might struggle with debt repayment.

In 2020, the UK Public Sector Net Debt to GDP is projected to reach historic highs of 96.6%. This increase is mainly attributed to governments’ efforts to prop up the economy through aggressive expansionary policies during the pandemic. Based on our correlation analysis, the increase in the United Kingdom Public Sector Net Debt to GDP in 2020 served its purpose to avoid irreversible recessions. We, therefore, assign an inflationary score of 4.

In our next article, we will analyze the Exogenous factors of both USD and GBP to come to an appropriate conclusion.

Categories
Forex Signals

GBP/AUD Trend Pullback

Categories
Forex Signals

GBP/AUD Displaying A Break of Structure

Categories
Forex Assets

Trading The ‘GBP/BRL’ Exotic Pair & Comprehending The Costs Involved

Introduction

GBP/BRL is the abbreviation for the Pound sterling against the Brazilian real. As we know, GBP is the official currency of the United Kingdom, Jersey, Guernsey, and others, whereas BRL is the official currency of Brazil. In Forex trading, currencies are always traded in pairs. The primary currency in the pair is known as the base currency, while the second one is the quote currency.

Understanding GBP/BRL

To find the relative value of one currency, we compare that with another currency in the Forex market. The market value of GBP/BRL helps us to understand the strength of BRL against the GBP. If the exchange rate of the pair GBP/BRL is 6.5415. It means that to buy 1 GBP, we need 6.5415 BRL.

Spread

Forex brokers have two prices for currency pairs. They are the bid and ask prices. The difference between this bid and the ask prices is known as the spread, and this is how Forex brokers profit for the services they provide. Some brokers include the costs in the buy and sell prices of the currency pairs instead of charging spreads. Below are the ECN and STP spread values for the pair GBP/BRL.

ECN: 41 pips | STP: 44 pips

Fees

A Fee is a commission we pay to the broker for executing our trades. It differs for different types of brokers. For instance, there is no fee charged by the STP brokers, but for ECN accounts, a few pips are charged a fee.

Slippage

It is the difference between the expected price and the price at which the trade gets executed. Slippage can occur at any time, but it mostly happens when the market is highly volatile.

Trading Range in GBP/BRL

Being aware of the volatility of a particular currency pair before placing the trade is very important for every aspiring trader. The trading range here is useful to measure the volatility of the GBP/BRL pair. The amount of money we will win or lose in a given amount of time can be assessed using the below trading range table.

Procedure to assess Pip Ranges

  1. Add the Average True Range indicator on your price chart
  2. Then, set the period to one
  3. Add a 200-period Simple Moving Average to the ATR indicator
  4. Shrink the chart to assess a significant period
  5. Select the desired timeframe
  6. Measure the floor level and set this value as the minimum
  7. Measure the level of the 200-period SMA and set this as the average
  8. Measure the peak levels and set this as Max.

GBP/BRL Cost as a Percent of the Trading Range

The cost of trade depends on the broker type and varies based on market volatility. The total cost of trade involves spreads and slippage apart from the trading fee.

ECN Model Account

Spread = 41 | Slippage = 3 |Trading fee = 5

Total cost = Slippage + Spread + Trading Fee = 3 + 41 + 5 = 49

STP Model Account

Spread = 44| Slippage = 3 | Trading fee = 0

Total cost = Slippage + Spread + Trading Fee = 3 + 44 + 0 = 47

Trading the GBP/BRL

There are a few currencies that are hardly traded in the foreign exchange market. These currencies are called exotic-cross currency pairs, and the GBP/BRL is one such exotic pair.

These pairs have less market depth, less volume, and are also illiquid. GBP/BRL is a trending market. Further, the average pip movement on the 1H timeframe is 198 pips, which is considered to be volatile. Higher the volatility, lower is the cost on a trade. However, this should not be considered an advantage as it is risky to trade in highly volatile markets.

Let’s take, for example, in the 4H time frame. The Maximum pip range value is 816, and the minimum is 102. When the comparison of the fees for both the pip movements is made, we find that for 102pip movement, fess is 46.08%. But for the 816pip movement, fess is only 5.76%.

So, we can confirm that the prices are higher for low volatile markets and low for highly volatile markets. We recommend trading when the volatility is around the average values. Experienced traders who strictly follow money management can trade in a highly volatile market.

Categories
Forex Assets

Analyzing GBP/BGN Exotic Pair & Comprehending The Costs Involved

Introduction

GBP stands for the British pound sterling, which is sometimes also known as the Pound. It is the 4th most traded currency in the Foreign Exchange market after USD, EURO and YEN. Whereas, BGN is the abbreviation of the Bulgarian lev, and it is the official currency of Bulgaria.

Understanding GBP/BGN

In Forex, the currencies are traded in pairs. In this case, GBP is the base currency, and BGN is the quote currency. Generally, if the value of the base currency goes up, the value of the quote currency goes down and vice versa. The market value of GBP/BGN determines the strength of BGN against GBP. It can be easily comprehended as 1GBP is equal to how much of BGN. So, if the exchange rate of GBP/BGN is 2.2409, to buy 1GBP, we need 2.2409 BGN.

Spread

Spread is the athematic difference between the bid and ask prices. Here, the bid is the selling price, whereas ask is the buying price of the currency pair. So basically, the spread is a type of commission brokers make for the services they provide. Below are the ECN and STP spread values for the pair GBP/BGN.

ECN: 19 pips | STP: 22 pips

Fees

It is obvious that we need to pay some commission to the broker every time we place a trade. A Fee is simply that commission we pay to the broker for opening a particular position. This fee varies from the type of broker we use. For example, there is no fee charged for STP account models, whereas a few pips are charged by ECN brokers.

Slippage

Slippage is referred to as the difference between the expected price at which the trader wants to buy/sell a currency pair and the price at which the trade is executed in real-time. It is important to know that slippage can occur at any time. However, it mostly happens when the market is extremely volatile.

Trading Range in GBP/BGN

Whether we make a profit or loss in a given time period depends on the movement of a currency pair. This can be assessed using the trading range table that is given below. It is basically a representation of the min, avg, and the maximum pip movement in a Forex currency pair. Evaluating the volatility of the market before taking the trade is the most important thing to do. The trading range here is to measure the volatility of the GBP/BGN pair.

Procedure to assess Pip Ranges

  1. Add the ATR indicator to your chart
  2. Set the period to 1
  3. Add a 200-period SMA to this indicator
  4. Shrink the chart so you can assess a significant period
  5. Select your desired timeframe
  6. Measure the floor level and set this value as the min
  7. Measure the level of the 200-period SMA and set this as the average
  8. Measure the peak levels and set this as Max.

GBP/BGN Cost as a Percent of the Trading Range

Most of the time, the cost of trade depends on the type of broker we choose. This varies based on the market’s volatility. The total cost involves the costs incurred from slippage and spreads along with the trading fee. Below we have discussed the cost variation in terms of percentages. Let’s look into both the ECN and the STP models.

ECN Model Account

Spread = 19 | Slippage = 3 |Trading fee = 5

Total cost = Slippage + Spread + Trading Fee = 3 + 19 + 5 = 27

STP Model Account

Spread = 22| Slippage = 3 | Trading fee = 0

Total cost = Slippage + Spread + Trading Fee = 3 + 22 + 0 = 25

Trading the GBP/BGN

The GBP/BGN is an exotic-cross currency pair and is a low volatile market. As seen in the Range table, the average pip movement on the 1-hour time frame is only 36. This clearly shows that if we trade this pair, we will have to wait for a more extended period to get some good profit as the pip movement is very less.

On any given day, if the market volatility is high, the cost of the trade is lower and vice-versa. However, this shouldn’t be considered as an advantage always because more the volatility, the riskier is our trade.

For instance, in the 1M time frame, the maximum pip range value is 1559, and the minimum is 336. When we compare the fees for both the pip movements, we find that 8.04% is the fee for the former, and it is only 1.73% for the latter. Hence we can infer that the prices are higher for low volatile markets and low for highly volatile markets.

Categories
Forex Assets

Exploring The GBP/XPF Exotic Forex Currency Pair

Introduction To GBP/XPF

The abbreviation of GBP/XPF is British Pound vs. the French Pacific Franc. Here GBP is the official currency of the United Kingdom, and many others, it is also proven to be the fourth most traded currency in the forex market after USD, EURO, and JPY. In contrast, The CFP franc is the currency used in French overseas.

Understanding GBP/XPF

We know that in currency pairs, the first currency is the base currency, and the second currency is the quote currency. Here, the market value of GBP/XPF helps us to understand the strength of XPF against the GBP. So let’s take if the exchange rate for the pair GBP/XPF is 135.984, it means we need 135.984 XPF to buy 1 GBP.

Spread

We have two different prices for currency pairs in forex, the bid and ask price. Here the “bid” price at which we can SELL the base currency, and The “ask” price is at which we BUY the base currency. The difference between the ask price and the bid price is called the spread. Below is the spread for ECN and STP broker for the GBP/XPF pair.

ECN: 52 pips | STP: 55 pips

Fees

A Fee in forex is simply the commission we need to pay to the broker for opening a particular position. The fees depend on the type of broker we use. Like for example, we don’t have any fees for ECN, but we have some for STP.

Slippage

Slippage is the difference between the trader’s anticipated price and the actual price at which the trade is executed. It mostly occurs when the volatility of the currency pair is high and also, sometimes, when a large number of orders are placed at the same time.

Trading Range in GBP/XPF

Volatility is an essential factor that every trader should take into consideration before entering the market. The amount of capital we will win or lose in a given amount of time can be evaluated using the trading range table. Here, the trading range is a representation of the minimum, average, and maximum pip movement in a currency pair. This can be evaluated simply by using the ATR indicator combined with 200-period SMA.

Procedure to assess Pip Ranges

  1. Add the ATR indicator to your chart
  2. Set the period to 1
  3. Add a 200-period SMA to this indicator
  4. Shrink the chart so you can assess a significant period
  5. Select your desired timeframe
  6. Measure the floor level and set this value as the min
  7. Measure the level of the 200-period SMA and set this as the average
  8. Measure the peak levels and set this as Max.

GBP/XPF Cost as a Percent of the Trading Range

The cost of trade depends mostly on the broker and also varies based on the volatility of the market. We have various costs involved in the overall trading cost that includes slippage, spreads, and sometimes the trading fee. Below is the calculation of the cost variation in terms of percentages. The conception of it is discussed in the following sections.

ECN Model Account

Spread = 52 | Slippage = 3 |Trading fee = 5

Total cost = Slippage + Spread + Trading Fee = 3 + 52 + 5 = 60

STP Model Account

Spread = 55| Slippage = 3 | Trading fee = 0

Total cost = Slippage + Spread + Trading Fee = 3 + 55 + 0 = 58

Trading the GBP/XPL

There are some currencies that are very less traded in the foreign exchange market. These currencies are called exotic-cross currency pairs. GBP/XPL is one such exotic currency pairs. Further, the average pip movement on the 1H timeframe is only 14 pips, which is considered to be very less volatile.

We also have to note that if we trade in a low volatile market, our trading will be very expensive. However, It is recommended to trade in a currency pair with medium volatility. To comprehend this better, we will try to understand this with the help of an example.

As we can see in the 1M time frame, the Maximum pip range value is 865, and the minimum is 217. Now when we compare the trading cost in accordance with the pip movement, we note that in 217pip movement fess is 26.73%, and for 865pip movement, fess is only 6.71%. So overall we can conclude that trading this pair will be very expensive.

Categories
Forex Assets

Analyzing The GBP/SAR Exotic Currency Pair

Introduction

In the Forex market, currencies are traded in pairs, and one currency is always quoted against the other. The abbreviation of GBP/SAR is British Pound Saudi Riyal. Here, the first currency GBP is the base currency, and the second one SAR is the quote currency.

Understanding GBP/SAR

We compare the value of one currency to another, and hence when we buy a currency pair, we are essentially buying the base currency and selling the quote currency. The market value of GBP/SAR determines the strength of SAR against the GBP, so if the exchange rate for the pair GBP/SAR is 4.7167, it means we need 4.7167 SAR to buy 1 GBP.

Spread

Trading the Forex market usually does not involve in spending a lot of commissions like the Stock market. Here, Forex brokers make a profit through spreads. The difference between the Bid and the Ask prices of an asset is called the spread. Some broker has the cost inbuilt into the buy and sell prices of the currency pair we want to trade instead of charging a separate fee. Below are the spread values of ECN and STP brokers for the GBP/SAR pair.

ECN: 40 pips | STP: 44 pips

Fees

A Fee is simply the charges we pay to the broker for executing a particular trade. The fee varies from the type of broker we use. For example, the fee on the STP account model is zero, but we can expect a few pips on ECN accounts.

Slippage

Slippage is the implementation of a trade at a price different from that requested by a trader. Slippage can either be positive (be additional profit) or negative (additional loss) and Mostly occurs when the market is volatile.

Trading Range in GBP/SAR

The trading range is used here is to measure the volatility of the GBP/SAR pair. The amount of money we will win or lose in a given amount of time can be assessed using the trading range table. The minimum, average, and maximum pip movement of the currency pair is represented in the trading range. This can be evaluated simply by using the ATR indicator combined with 200-period SMA.

Procedure to assess Pip Ranges

  1. Add the ATR indicator to your chart
  2. Set the period to 1
  3. Add a 200-period SMA to this indicator
  4. Shrink the chart so you can assess a significant period
  5. Select your desired timeframe
  6. Measure the floor level and set this value as the min
  7. Measure the level of the 200-period SMA and set this as the average
  8. Measure the peak levels and set this as Max.

GBP/SAR Costs as a Percent of the Trading Range

The cost of trade depends on the broker and differs according to the volatility of the market. This is because the trading cost includes slippage, fees, and the spread. The cost of variation in terms of percentage is given below. We will look into both the ECN model and the STP model.

ECN Model Account

Spread = 40 | Slippage = 3 |Trading fee = 5

Total cost = Slippage + Spread + Trading Fee = 3 + 40 + 5 = 48

STP Model Account

Spread = 44| Slippage = 3 | Trading fee = 0

Total cost = Slippage + Spread + Trading Fee = 3 + 44 + 0 = 47

Trading the GBP/SAR Forex pair

The GBP/SAR is an exotic-cross currency pair and is a low volatile market. Looking at the pip range table, the average pip movement on the 1H timeframe is only 62 pips. Hence, The volatility of this currency pair is on the lower side. We know that the higher the volatility, the lower will be the cost to execute the trade. However, this is not an advantage as trading in a volatile market involves more risk.

Let’s take, for example, in the 1M time frame, the Maximum pip range value is 3952, and the minimum is 896. When we compare the trading fees for both the pip movements, we note that for 896pip movement fess is 5.36%, and for 3952pip movement, fess is only 1.21%. As we can conclude from the above example, trading the GBP/SAR currency pair will be a bit expensive.

Categories
Forex Assets

Exploring The GBP/ILS Forex Exotic Currency Pair

Understanding GBP/ILS

GBP/ILS is the abbreviation for the Pound sterling against the Israeli Shekel. In currency pairs, the first currency GBP here is the base currency and the second currency ILS is the quote currency. In Forex currency pairs, if the value of, let’s say, the base currency goes up, the quote currency’s value will go down and vice versa.

Also, when we buy a currency pair, we buy the base currency and implicitly sell the quote currency. The market value of GBP/ILS determines the strength of ILS against the GBP that can be understood as 1 Pound is equal to how much ILS. So if the conversion rate for the pair GBP/ILS is 4.4725, it means to buy 1 GBP, we need 4.4725 ILS.

Spread

We know that the “bid” is the price at which we sell the currency, and “ask” is the price is at which we can BUY the currency. The arithmetic difference between the ask and bid price is known as the spread. The spread is how most of the brokers make money. There are also brokers who charge a separate fee instead of making profits in the form of spread. Below are the ECN and STP spreads for the GBP/ILS Forex pair.

ECN: 54 pips | STP: 56 pips

Fees

Every time we place a trade, some commission must be paid to the brokers, and that is known as a fee. This fee varies from broker to broker. For instance, there is no fee charged on STP account models, but ECN brokers do charge some fee.

Slippage

The arithmetic difference between the expected price of a trader and the price at which the trade is executed is known as slippage. It can occur mostly when the market is volatile & fast-moving. Another reason when the slippage may occur is when we place a huge number of orders at the same time.

Trading Range in GBP/ILS

The trading range here is to measure the volatility of the GBP/ILS pair. Whether we make a profit or loss in a given time period depends on the movement of a currency pair that can be assessed using the trading range table. It is a representation of the min, avg, & max pip movement in a currency pair.

Procedure to assess Pip Ranges

  1. Add the Average True Range indicator to your price chart
  2. Make sure to set the period to one
  3. Then add a 200-period Simple Moving Average to ATR
  4. Shrink the chart in order to assess a significant period
  5. Select the timeframe of your choice
  6. Floor level must be measured and set that value as the min
  7. 200-period SMA must be measured and set that value as average
  8. Finally, measure the peak levels and consider this as Max values.

GBP/ILS Cost as a Percent of Trading Range

The cost of trade depends on the broker and mostly varies based on the market’s volatility. The below tables represent the cost variation in terms of percentages.

ECN Model Account

Spread = 54 | Slippage = 3 |Trading fee = 5

Total cost = Slippage + Spread + Trading Fee = 3 + 54 + 5 = 62


STP Model Account

Spread = 56| Slippage = 3 | Trading fee = 0

Total cost = Slippage + Spread + Trading Fee = 3 + 56 + 0 = 59

Trading the GBP/ILS

The GBP/ILS is an exotic-cross currency pair and is a trending market. We consider the market to be trending when the price generally moves in one direction, either downwards or upwards. As seen in the Range table, the average pip movement on the 1-hour time frame is 112. This clearly shows that the pip movements are normal, and this currency pair is tradable.

Note that the higher the volatility, the lower is the cost of the trade. However, this is not an advantage as it is risky to trade highly volatile markets. Let’s take, for example, in the 1M time frame, the Maximum pip range value is 3469, and the minimum is 1080. When we compare the fees for both the pip movements, we find that for 1080pip movement fess is 5.74%, and for 3469pip movement, fess is only 1.79%.

So, we can confirm that the prices are higher for low volatile markets and low for highly volatile markets. It is recommended to trade when the market volatility is around the average values, but experienced traders who strictly follow money management can trade in a volatile market. The volatility here is moderate, and the costs are a little high compared to the maximum values. But, if our priority is towards reducing costs, we may trade when the volatility of the market is around the maximum values.

Categories
Forex Assets

Asset Analysis – Exploring The GBP/AED Forex Currency Pair

Introduction

We all know that official currencies of the two countries are paired for being exchanged in reference to each other. In GBP/AED, GBP stands for the British pound sterling, and it is is the official currency of the United Kingdom. It is also the 4th most traded currency in the Forex Market and stands right after USD, EURO and YEN. Whereas the AED is known as the United Arab Emirates Dirham, and it is the official currency of the UAE.

GBP/AED

GBP/AED is the abbreviation of the Pound sterling against the Emirati Dirhams. In currency pairs, the first currency is the base currency, while the second currency is the quote currency. In this case, GBP is the base currency, and AED is the quote currency.

Understanding GBP/AED

In the Forex market, if the base currency’s value goes down, the value of the quote currency goes up and vice versa. Also, when we buy a currency pair, we buy the base currency and implicitly sell the quote currency.

The market value of GBP/AED determines the strength of AED against the GBP that can be easily understood as 1GBP is equal to how much AED. So if the exchange rate for the pair GBP/AED is 4.5748, it means that we need 4.5748 AED to buy 1 GBP.

Spread

Forex brokers have two different prices for currency pairs: the bid and ask price. The bid price is the selling price, and ask is the buy price. The difference between the ask and the bid price is called the spread. Spread is basically a type of commission by which brokers make their money. Below are the ECN and STP spread values for the GBP/AED pair.

ECN: 27 pips | STP: 30 pips

Fees

Each time we place a trade, we need to pay some commission on it. A Fee is simply that commission we pay to the broker for opening a particular position. The fee also varies from the type of broker we use; for example, there is no fee on STP account models, but a few pips on ECN accounts.

Slippage

Slippage refers to the difference between the trader’s expected price and the actual price at which the trade is executed. It can occur at any time but mostly happens when the market is fast-moving and volatile. Also, it occurs at the times when we place a large number of orders at the same time.

Trading Range in GBP/AED

The trading range here is to measure the volatility of the GBP/AED pair. Whether we make a profit or loss in a given time period depends on the movement of a currency pair that can be assessed using the trading range table. It is a representation of the minimum, average, and maximum pip movement in a currency pair. This can be evaluated simply by using the ATR indicator combined with 200-period SMA.

Procedure to assess Pip Ranges

  1. Add the ATR indicator to your chart
  2. Set the period to 1
  3. Add a 200-period SMA to this indicator
  4. Shrink the chart so you can assess a significant period
  5. Select your desired timeframe
  6. Measure the floor level and set this value as the min
  7. Measure the level of the 200-period SMA and set this as the average
  8. Measure the peak levels and set this as Max.

GBP/AED Cost as a Percent of the Trading Range

The cost of trade mostly depends on the broker and varies based on the volatility of the market. This is because the total cost involves slippage and spreads apart from the trading fee. Below is the representation of the cost variation in terms of percentages. The comprehension of it is discussed in the following sections. We will look into both the ECN model and the STP model.

ECN Model Account

Spread = 27 | Slippage = 3 |Trading fee = 5

Total cost = Slippage + Spread + Trading Fee = 3 + 27 + 5 = 35

STP Model Account

Spread = 30| Slippage = 3 | Trading fee = 0

Total cost = Slippage + Spread + Trading Fee = 3 + 30 + 0 = 33

Trading the GBP/AED

The GBP/AED is an exotic-cross currency pair and is mostly ranging. The volatility of this currency pair is on the lower side. As seen in the Range table, the average pip movement on the 1-hour time frame is only 64. This clearly shows that if we trade in this pair, we will have to wait for a more extended period of time to get some good profit because of such a less movement in the pips.

Note that the higher the volatility, the lower the cost of the trade. However, this is not an advantage as it is risky to trade highly volatile markets. Let’s take, for example, in the 1M time frame, the Maximum pip range value is 3825, and the minimum is 923. When we compare the fees for both the pip movements, we find that for a 923 pip movement, the fee is 3.79%, and for 3825pip movement, fess is only 1.07%.

So, we can confirm that the prices are higher for low volatile markets and low for highly volatile markets. It is safe to trade when the volatility is around the average values, but experienced traders who strictly follow money management can trade the volatile markets as the cost of trade is less there. Cheers!

Categories
Forex Assets

Understanding The GBP/HUF Exotic Currency Pair

Introduction

GBP stands for British Pound Sterling, and it is the 4th most traded currency in the Foreign Exchange market after USD, EURO and YEN. It is the official currency of the United Kingdom and some other countries like Jersey, South Georgia, and Guernsey. Whereas HUF stands for Hungarian forint, and it is the official currency of Hungary.

GBP/HUF

We know that the currencies in the Forex market are traded in pairs. GBP/HUF is the abbreviation for the Pound sterling against The Hungarian Forint. In this case, the first currency (GBP) is the base currency, and the second (HUF) is the quote currency.

Understanding GBP/HUF

To find the relative value of one currency in the Forex market, we need another currency to compare. If the value of the base currency goes down, the value of the quote currency goes up and vice versa. The market value of GBP/HUF determines the strength of HUF against the GBP. It can be easily understood as 1GBP is equal to how much of HUF. So if the exchange rate for the pair GBP/HUF is 414.425, it means we need 414.425 HUF to buy 1 GBP.


Spread

Forex brokers have two different prices for currency pairs: the bid and ask price. Here the “bid” price at which we can SELL the base currency, and The “ask” price is at which we can BUY the base currency. Hence, the difference between the ask and the bid price is called the spread. Some brokers, instead of charging a separate fee for trading, they already have the fees inbuilt in the spread. Below are the ECN and STP for the pair GBP/HUF.

ECN: 57 pips | STP: 60 pips

Fees

When we place any trade, there is some commission we need to pay to the broker. A Fee is simply that commission that we pay to the broker each time we execute a position. The fee also varies from the type of broker we use; for example, there is no fee on STP account models, but a few pips on ECN accounts.

Slippage

Slippage alludes to the difference between the expected price at which the trader wants to execute the trade and the price at which the trade is being executed. It can occur at any time but mostly happens when the market is fast-moving and volatile. Also, sometimes when we place a large number of orders at the same time.

Trading Range in GBP/HUF

The trading range is a tabular representation of the pip movement in a currency pair for different timeframes. Using this, we can assess the risk on a trade for each given timeframe. A trading range essentially represents the minimum, average, and maximum pip movement in a currency pair. This can be evaluated easily by using the ATR indicator combined with 200-period SMA.

Procedure to assess Pip Ranges

  1. Add the ATR indicator to your chart
  2. Set the period to 1
  3. Add a 200-period SMA to this indicator
  4. Shrink the chart so you can assess a significant period
  5. Select your desired timeframe
  6. Measure the floor level and set this value as the min
  7. Measure the level of the 200-period SMA and set this as the average
  8. Measure the peak levels and set this as Max.

GBP/HUF Cost as a Percent of the Trading Range

The cost of trade mostly depends on the broker and varies based on the volatility of the market. This is because the total cost involves slippage and spreads apart from the trading fee. Below is the representation of the cost variation in terms of percentages. The comprehension of it is discussed in the following sections. We will be looking into both the ECN model and the STP model.

ECN Model Account

Spread = 57 | Slippage = 3 |Trading fee = 5

Total cost = Slippage + Spread + Trading Fee = 3 + 57 + 5 = 65

STP Model Account

Spread = 60|Slippage = 3 | Trading fee = 0

Total cost = Slippage + Spread + Trading Fee = 3 + 60+ 0 = 63

Trading the GBP/HUF

The GBP/HUF is an exotic-cross currency pair, and the volatility in this pair is decent. As seen in the Range table, the average pip movement on the 1-hour time frame is 205. Here in the GBP/HUF pair, HUF is an emerging currency. We must know that the cost of trade decreases ad the volatility od the pair increases. But this should not be considered as an advantage because it is risky to trade high volatile markets as the price keeps fluctuations.

For instance, in the 1-hour timeframe, the maximum pip range value in this pair is 343 pips, and the minimum pip range value is 27 pips. When we compare the fees for both the pip movements, we find that for 27 pip movement fees is 270.74%, and for 343 pip movement, the fess is only 18.95%.

So, we can confirm that the prices are higher for low volatile markets and high for highly volatile markets. Hence we must always try to make our entries and exits when the volatility is minimum or average than to that of maximum values. But if your preference is absolutely towards reducing your trading costs, you may trade when the volatility of the market is around the maximum values.

Categories
Forex Assets

Analyzing The GBP/TWD Forex Currency Pair

Introduction to GBP/TWD

GBP stands for British pound sterling, and it is typically known as Pound. It is the official currency of the United Kingdom and some other countries like Jersey, South Georgia, and Guernsey. The pound is also the 4th most traded currency in the foreign exchange after USD, EUR & YEN. Whereas TWD is the abbreviation of The New Taiwan dollar. The central bank of Taiwan issues this currency.

GBP/TWD

Currency pairs are the national currencies from two countries coupled for being exchanged in reference to each other. In the Forex market, one currency is always quoted against the other. GBP/TWD is the abbreviation for the Pound sterling against the New Taiwan dollar. In this case, the first currency(GBP) is the base currency, and the second(TWD) is the quote currency.

Understanding GBP/TWD

In Forex, to find out the relative value of one currency, we need another currency to compare. If the value of the base currency goes down, the value of the quote currency goes up and vice versa. The market value of GBP/TWD determines the strength of TWD against the GBP. This can be easily understood as 1GBP is equal to how much of TWD. So if the exchange rate for the pair GBP/TWD is 37.093, it means we need 37.093 TWD to buy 1 GBP.

Spread

Forex brokers have two different prices for currency pairs: the bid and ask price. The bid price is the selling price, and ask is the buy price. The difference between the ask and the bid price is called the spread. Spread is basically a type of commission by which brokers make their money. Below are the ECN and STP for the pair GBP/TWD.

ECN: 49 pips | STP: 52 pips

Fees

Each time we place a trade, we need to pay some commission on it. A Fee is simply that commission we pay to the broker for opening a particular position. The fee also varies from the type of broker we use; for example, there is no fee on STP account models, but a few pips on ECN accounts.

Slippage

Slippage refers to the difference between the trader’s expected price and the actual price at which the trade is executed. It can occur at any time but mostly happens when the market is fast-moving and volatile. Also, sometimes when we place a large number of orders at the same time.

Ranges in GBP/TWD

The Range is a measure of volatility. It tells how much the currency pair has moved in a determined period. Whether a trader makes a profit or loss in a given time period depends on the movement of a currency pair and can be determined using the trading range table. It is a representation of the minimum, average, and maximum pip movement in a currency pair. This can be evaluated simply by using the ATR indicator combined with 200-period SMA.

Procedure to assess Pip Ranges

  1. Add the ATR indicator to your chart
  2. Set the period to 1
  3. Add a 200-period SMA to this indicator
  4. Shrink the chart so you can assess a significant period
  5. Select your desired timeframe
  6. Measure the floor level and set this value as the min
  7. Measure the level of the 200-period SMA and set this as the average
  8. Measure the peak levels and set this as Max.

GBP/TWD Cost as a Percent of the Trading Range

The cost of trade mostly depends on the broker and varies based on the volatility of the market. This is because the total cost involves slippage and spreads apart from the trading fee. Below is the representation of the cost variation in terms of percentages. The comprehension of it is discussed in the following sections. We will look into both the ECN model and the STP model.

ECN Model Account

Spread = 49 | Slippage = 3 |Trading fee = 5

Total cost = Slippage + Spread + Trading Fee = 3 + 49 + 5 = 57

STP Model Account

Spread = 52| Slippage = 3 | Trading fee = 0

Total cost = Slippage + Spread + Trading Fee = 3 + 52 + 0 = 55

Trading the GBP/TWD Forex Pair

The GBP/TWD is an exotic-cross currency pair and is a ranging market. A market is said to be ranging when the price hits the support and resistance at least three times. As seen in the Range table, the average pip movement on the 1-hour time frame is only 47. This clearly shows that if we trade in this pair, we will have to wait for a more extended period of time to get some good profit because of such a less movement in the pips.

Here in GBP/TWD, TWD is considered to be an emerging currency. Note that the higher the volatility, the lower is the cost of the trade. However, this is not an advantage as it is risky to trade highly volatile markets.

For example, in the 1M time frame, the maximum pip range value is 3009 and in minimum pip range, the value is 687. When we compare the fees for both the pip movements, we find that for 687 pip movement fees is 8.30%, and for 3009pip movement, fess is only 1.89%.

So, we can infer that the cost of trade is higher in the low volatile markets and high in the highly volatile markets. It is recommended to trade when the volatility is around the minimum values. The volatility here is low, and the costs are a little high compared to the average and the maximum values. But, if our priority is not towards reducing costs, we may trade when the volatility of the market is around the maximum values.

Categories
Forex Assets

Asset Analysis – Exploring The ‘GBP/BND’ Exotic Pair

Introduction

The abbreviation of GBP is the Great British Pound, and this currency is mostly known as pound sterling across the globe. It is one of the most-traded currencies in the Forex market and stands at the fourth position right after USD, EUR, & JPY. Whereas the abbreviation of BND is the Brunei Dollar, and it has been the currency of the Sultanate of Brunei since 1967. The Monetary Authority of Brunei Darussalam issues the Brunei Dollar.

GBP/BND

In the Forex market, currencies of the two countries are paired for being exchanged in reference to each other. GBP/BND is the abbreviation for the Pound Sterling against The Brunei Dollar. In this case, the first currency (GBP) is the base currency, and the second (BND) is the quote currency. The GBP/BND is classified as an exotic-cross currency pair.

Understanding GBP/BND

In the Forex, one currency is quoted against the other. To find out the relative value of one currency, we need another currency to compare. If the value of the base currency goes down, the value of the quote currency goes up and vice versa.

The market value of GBP/BND determines the strength of BND against the GBP. This can be easily understood as 1GBP is equal to how much BND. So if the exchange rate for the pair GBP/BND is 1.7660, it means 1GBP is equal to 1.7660 BND.

Spread

Forex brokers set two different prices for the currency pairs – Bid & Ask prices. Here the ‘bid’ price is at which we can sell the base currency, and the ‘ask’ price is at which we can buy the base currency. The difference between the ask and the bid price is called spread. The spread is how brokers make their money. Some brokers, instead of charging a separate fee for trading, they already have the fees inbuilt in the form of spread. Below are the ECN & STP spread values for GBP/BND Forex pair.

ECN: 12 pips | STP: 15 pips

Fees

A Fee is simply the commission we pay to the broker each time we execute a position. There is no fee on STP account models, but a few pips of the trading fee is charged on ECN accounts.

Slippage

Slippage refers to the difference between the expected price at which the trader wants to execute the trade and the price at which the trade gets executed. The slippage can occur at any time but mostly happens when the market is fast-moving and volatile in nature. Slippage also occurs when we place a large number of orders at the same time.

Trading Range in GBP/BND

The amount of money we will win or lose in a given time can be assessed by using the trading range table. It is a representation of the minimum, average, and maximum pip movement in a currency pair. This can be evaluated easily by using the ART indicator combined with 200-period SMA.

Procedure to assess Pip Ranges

  1. Add the ATR indicator to your chart
  2. Set the period to 1
  3. Add a 200-period SMA to this indicator
  4. Shrink the chart so you can assess a significant period
  5. Select your desired timeframe
  6. Measure the floor level and set this value as the min
  7. Measure the level of the 200-period SMA and set this as the average
  8. Measure the peak levels and set this as Max.

GBP/BND Cost as a Percent of the Trading Range

The cost of trade mostly depends on the type of broker we chose and also varies based on market volatility. This is because the total cost involves slippage and spreads apart from the trading fee. Below is the representation of the cost variation in terms of percentages. The comprehension of it is discussed in the following sections.

ECN Model Account

Spread = 12 | Slippage = 3 |Trading fee = 5

Total cost = Slippage + Spread + Trading Fee = 3 + 12 + 5 = 20

STP Model Account

Spread = 15 | Slippage = 3 | Trading fee = 0

Total cost = Slippage + Spread + Trading Fee = 3 + 15 + 0 = 18

Trading the GBP/BND

The GBP/BND is an exotic-cross currency pair and it is typically a Ranging market. The average pip movement of this pair on the 1H timeframe is 55 pips. Since the market is ranging, the volatility is less and the trading costs are relatively high while trading the GBP/BND pair. Always remember that cost of trade increases as the volatility decreases and vice versa.

Conservative traders who don’t mind spending more on trading fees can trade this pair on all the timeframes as the volatility is moderate. Comprehending the above tables, we should note that the costs on the trade are high when the volatility is less. But traders who don’t prefer spending more on trading costs can trade this pair when the volatility of the market is around the maximum values. Cheers!

Categories
Forex Assets

Trading The GBP/PHP Exotic Currency Pair

Introduction

The expansion of GBP is the Great Britan Pound, and this currency is very well known as the Pound Sterling. It is the official currency of the United Kingdom and many other countries like British Overseas Territories, South Sandwich Islands, etc. Where in PHP is known as the Philippine peso and generally referred to as the Piso. It is the official currency of the Philippines, and it is printed by The Central Bank of the Philippines.

GBP/PHP

In the Forex market, currency pairs of any two countries are coupled for being exchanged in reference to each other. GBP/PHP is the abbreviation for the Pound sterling against The Philippine peso. In this case, the first currency (GBP) is the base currency, and the second (PHP) is the quote currency. The GBP/PHP is classified as an exotic-cross currency pair.

Understanding GBP/PHP

As we know, the trading of currencies in the Forex market typically happens in pairs. One currency is quoted against the other, and to find out the relative value of one currency, we need another currency to compare. The market value of GBP/PHP determines the strength of PHP against the GBP. This can be easily understood as 1 GBP is equal to how much PHP. So if the exchange rate for the pair GBP/PHP is 63.377. It means 1 GBP is equivalent to 63.377 PHP.

Spread

Forex brokers have two different prices for currency pairs, and they are the bid and ask prices. The bid is a selling price while the ask is a buy price. The difference between the ask and the bid price is called the spread. The spread is how most of the brokers make their money. The spreads of GBP/PHP in both ECN & STP brokers can be found below.

ECN: 45 pips | STP: 48 pips

Fees

When we execute a trade, we need to pay the broker some commission. A Fee is that commission we pay to the broker each time we execute a position. There is no fee on STP account models, but ECN brokers charge some pips as a trading fee.

Slippage

Sometimes while trading in a volatile market, we won’t be able to execute a trade at the price we want it to get executed. Slippage is the difference between the trader’s expected price and the actual price at which the trade is executed. It may occur at any time but mostly happens when the market is fast-moving and volatile. It can also happen when we place a large number of orders at the same time.

Trading Range in GBP/PHP

The amount of money we will win or lose in a given amount of time can be assessed using the trading range table. It is a representation of the minimum, average, and maximum pip movement in a currency pair. This can be evaluated by using the ART indicator combined with 200-period SMA.

Procedure to assess Pip Ranges

  1. Add the ATR indicator to your chart
  2. Set the period to 1
  3. Add a 200-period SMA to this indicator
  4. Shrink the chart so you can assess a significant period
  5. Select your desired timeframe
  6. Measure the floor level and set this value as the min
  7. Measure the level of the 200-period SMA and set this as the average
  8. Measure the peak levels and set this as Max.

GBP/PHP Cost as a Percent of the Trading Range

The cost of trade mostly depends on the broker and varies based on the volatility of the market. This is because the total cost involves slippage and spreads apart from the trading fee. Below is the representation of the cost variation in terms of percentages. The comprehension of it is discussed in the following sections.

ECN Model Account

Spread = 45 | Slippage = 3 |Trading fee = 5

Total cost = Slippage + Spread + Trading Fee = 3 + 45 + 5 = 53

STP Model Account

Spread = 48 | Slippage = 3 | Trading fee = 0

Total cost = Slippage + Spread + Trading Fee = 3 + 48 + 0 = 51

Trading the GBP/PHP Forex Pair

The GBP/PHP is an exotic-cross currency pair with great volatility. For instance, the average pip movement on the 1H timeframe is 261 pips. As a matter of fact, PHP is one of the most emerging currencies in the previous year. We can find amazing trading opportunities in this currency pair if observed correctly.

When the volatility is high, the cost of trade will always be less. It is vice versa when the volatility is low. But this should not be considered as an advantage because it is always risky to trade when the volatility is high. To comprehend the above tables, higher percentages mean the costs of trade in the corresponding time frames are high. And when the percentages are low, trading costs are relatively low in those time frames.

Generally, it is recommended to take trades when the volatility of the market is around minimum to average values. Because, at min values, the volatility of the market will be low. But the costs are a bit high here when compared to the average and the maximum values. Trading at max values will reduce your trading costs but increase the risk of the trades. So we suggest you take a call according to the market situation.

There is another way to reduce the cost of trades, i.e., by using Limit Orders over Market Orders. By using these limit orders, slippage can completely be eliminated and thereby reducing the overall trading costs. In the below table, you can see how the costs have reduced by using limit orders with an STP broker.

STP Model Account (Using Limit Orders) 

Spread = 48 | Slippage = 0 | Trading fee = 0

Total cost = Slippage + Spread + Trading Fee = 0 + 48 + 0 = 48

Categories
Forex Assets

GBP/TRY – Knowing The Trading Costs Involved While Trading This Exotic pair

Introduction

GBP Pound sterling, also known as the pound, is the official currency of the United Kingdom and many others. The sterling is the fourth most-traded currency in the Forex market. On the other hand, TRY is known as the Turkish lira. It is the official currency of Turkey and the self-declared Turkish Republic of Northern Cyprus.

GBP/TRY

Currency pairs are the national currencies from two countries coupled for being exchanged in reference to each other. In the Forex, one currency is quoted against the other. GBP/TRY is the abbreviation for the Pound sterling against The Turkish lira. In this case, the first currency(GBP) is the base currency, and the second(TRY) is the quote currency. The GBP/TRY is classified as an exotic-cross currency pair.

Understanding GBP/TRY

In the Forex market, to find out the relative value of one currency, we need another currency to compare. The market value of GBPTRY determines the strength of TRY against the GBP that can be easily understood as 1GBP is equal to how much lira(TRY), so if the exchange rate for the pair GBPTRY is 8.0877. It means in to order to buy 1GBP we need 8.0877 TRY

If the value of the base currency goes down, the value of the quote currency goes up and vice versa.

Spread

The broker provides us with two prices, Ask price and Bid price. Here, the Bid price is the buy price, and the Ask price is the Sell price. The difference between the ask and the bid price is called the spread. The spread is how brokers make their money.

ECN: 61 pips | STP: 64 pips

Fees

A Fee is simply the commission we pay to the broker each time we execute a position. There is no fee on STP account models, but a few pips on ECN accounts.

Slippage

Slippage refers to the difference between the trader’s expected price and the actual price at which the trade is executed. It can occur at any time but mostly happens when the market is fast-moving and volatile. Also, sometimes when we place a large number of orders at the same time.

Trading Range in GBP/TRY

The amount of money you will win or lose in a given amount of time can be assessed using the trading range table. It is a representation of the minimum, average, and maximum pip movement in a currency pair. This can be evaluated simply by using the ATR indicator combined with 200-period SMA.

Procedure to assess Pip Ranges

  1. Add the ATR indicator to your chart
  2. Set the period to 1
  3. Add a 200-period SMA to this indicator
  4. Shrink the chart so you can assess a significant period
  5. Select your desired timeframe
  6. Measure the floor level and set this value as the min
  7. Measure the level of the 200-period SMA and set this as the average
  8. Measure the peak levels and set this as Max.

GBP/TRY Cost as a Percent of the Trading Range

The cost of trade mostly depends on the broker and varies based on the volatility of the market. This is because the total cost involves slippage and spreads apart from the trading fee. Below is the representation of the cost variation in terms of percentages. The comprehension of it is discussed in the following sections.

ECN Model Account

Spread = 61 | Slippage = 3 |Trading fee = 5

Total cost = Slippage + Spread + Trading Fee = 3 + 61 + 5 = 69


STP Model Account

Spread = 64 | Slippage = 3 | Trading fee = 0

Total cost = Slippage + Spread + Trading Fee = 3 + 64 + 0 = 67


Trading the GBP/TRY

From the trading range table, it can clearly be ascertained that this pair is very volatile. For example, the pip average pip movement in the 1H timeframe is as high as 400 pips. This also means that the risk is high from the 1H timeframe all the way to the 1M timeframe.

As far as the costs are concerned, it is in favor of the traders. This is because the greater the volatility, the lower are the costs. That is the reason the percentage values are large in the min column and comparatively smaller in the average and max columns.

With this in mind, one can opt to trade this pair when the volatility values are between the minimum and average. In doing so, the volatility will be comparatively lower, which in turn reduces the risk on the trade and also keeps the cost in balance with the volatility.

Categories
Forex Assets

Asset Analytics – Analyzing The GBP/DKK Currency Pair

Introduction

GBP Pound sterling, also known as the pound, is the official currency of the United Kingdom and many others. The sterling is the fourth most-traded currency in the forex market. Where in DKK is known as The krone and sometimes Danish crown. It is the official currency of Denmark, Greenland, and the Faroe Islands.

GBP/DKK is the abbreviation for the Pound sterling against the Danish crown. In the Forex, one currency is quoted against the other. Here, the first currency(GBP) is the base currency, and the second(DKK) is the quote currency. The GBPDKK is classified as exotic-cross currency pair.

Understanding GBP/DKK

In Forex, to find out the relative value of one currency, we need another currency to compare. The market value of GBPDKK determines the strength of DKK against the GBP that can be easily understood as 1GBP is equal to how much DKK, so if the exchange rate for the pair GBPDKK is 8.3430. It means that we need 8.3430DKK to buy 1 GBP.

If the value of the base currency goes down, the value of the quote currency goes up and vice versa.

Spread

Forex brokers have two different prices for currency pairs: the bid and ask price. The bid price is the selling price, and ask is the buy price.

The difference between the ask and the bid price is called the spread. The spread is how brokers make their money.

ECN: 39 pips | STP: 42 pips

Fees

A Fee is simply the commission we pay to the broker on each position we open. There is no fee on STP account models, but a few pips on ECN accounts.

Slippage

slippage refers to the difference between the trader’s expected price and the actual price at which the trade is executed. It can occur at any time but mostly happens when the market is fast-moving and volatile. Also, sometimes when we place a large number of orders at the same time.

Trading Range in GBP/HKD

The amount of money you will win or lose in a given amount of time can be assessed using the trading range table. This is a representation of the minimum, average, and maximum pip movement in a currency pair. This can be evaluated simply by using the ART indicator combined with 200-period SMA.

Procedure to assess Pip Ranges

  1. Add the ATR indicator to your chart
  2. Set the period to 1
  3. Add a 200-period SMA to this indicator
  4. Shrink the chart so you can assess a significant period
  5. Select your desired timeframe
  6. Measure the floor level and set this value as the min
  7. Measure the level of the 200-period SMA and set this as the average
  8. Measure the peak levels and set this as Max.

GBP/DKK Cost as a Percent of the Trading Range

The cost of trade mostly depends on the broker and varies based on the volatility of the market. This is because the total cost involves slippage and spreads apart from the trading fee. Below is the representation of the cost variation in terms of percentages. The comprehension of it is discussed in the following sections.

ECN Model Account

Spread = 39 | Slippage = 3 |Trading fee = 5

Total cost = Slippage + Spread + Trading Fee = 3 + 39 + 5 = 47

STP Model Account

Spread = 42 | Slippage = 3 | Trading fee = 0

Total cost = Slippage + Spread + Trading Fee = 3 + 42 + 0 = 45

Trading the GBP/DKK

The GBP/DKK is an exotic-cross currency pair and is a volatile market. For instance, the average pip movement on the 1H timeframe is only 333 pips. DKK is considered to be an emerging pair.

Note that the higher the volatility, the lower is the cost of the trade. However, this is not an advantage as it is risky to trade highly volatile markets. Also, the larger/smaller the percentages, the higher/lower are the costs on the trade. So, we can infer that the prices are higher for low volatile markets and high for highly volatile markets.

It is recommended to trade when the volatility is around the minimum values. The volatility here is low, and the costs are a little high compared to the average and the maximum values. But, if you’re priority is towards reducing costs, you may trade when the volatility of the market is around the maximum values.

Categories
Forex Assets

Exploring The GBP/HKD Forex Exotic Currency Pair

Introduction

GBP Pound sterling, also known as the pound, is the official currency of the United Kingdom and many others. It is one of the oldest currencies and is further divided into pence. Where in HKD is known as Hong Kong Dollar, and it is the official currency of Hong Kong. One HKD is divided into 100 cents.

GBP/HKD is the abbreviation for the Pound sterling against the Hong Kong Dollar. Here, the first currency (GBP) is the base, and the second currency (HKD) is the quote currency. It is classified as an exotic-cross currency pair.

Understanding GBP/HKD

In Forex, to find out the relative value of one currency, we need another money to compare. The market value of GBP/HKD determines the strength of HKD against the GBP, i.e., It can simply be understood as 1GBP is equal to how much HKD, so if the exchange rate for the pair GBPHKD is 9.254. It means that we need 9.254 HKD to buy 1 GBP. If the value of the base currency goes down, the value of the quote currency goes up and vice versa.

Spread

Forex brokers have two different prices for currency pairs: the bid and ask price. The bid price is the selling price, and ask is the buy price. The difference between the ask and the bid price is called the spread. The spread is how brokers make their money. For this currency pair, the spread values for ECN & STP brokers are as follows.

ECN: 33 pips | STP: 36 pips

Fees

A Fee is simply the commission we pay to the broker on each position we open. There is no fee on STP account models, but a few pips on ECN accounts.

Slippage

Slippage refers to the difference between the trader’s expected price and the actual price at which the trade is executed. It can occur at any time, but it mostly happens when market orders are placed during high volatile conditions. It may also occur when large orders are placed at a time.

Trading Range in GBP/HKD

The amount of money we win or lose in a given amount of time can be assessed using the trading range table. The following table is a representation of the minimum, average, and maximum pip movement in a currency pair. This can be assessed very easily by using the Average True Range (ATR) indicator combined with 200-period SMA.

Procedure to assess Pip Ranges

  1. Add the ATR indicator to your chart
  2. Set the period to 1
  3. Add a 200-period SMA to this indicator
  4. Shrink the chart so you can assess a large time period
  5. Select your desired timeframe
  6. Measure the floor level and set this value as the min
  7. Measure the level of the 200-period SMA and set this as the average
  8. Measure the peak levels and set this as Max.

GBP/SGD Cost as a Percent of the Trading Range

The cost of trade varies based on the volatility of the market. This is because the total cost involves slippage and spreads apart from the trading fee. Below is the representation of the cost variation in terms of percentages. The comprehension of it is discussed in the coming sections.

ECN Model Account

Spread = 33 | Slippage = 3 |Trading fee = 5

Total cost = Slippage + Spread + Trading Fee = 3 + 15 + 5 = 41

STP Model Account

Spread = 36 | Slippage = 3 | Trading fee = 0

Total cost = Slippage + Spread + Trading Fee = 3 + 19 + 0 = 39

Trading the GBP/HKD Currency Pair

The GBPHKD is an exotic-cross currency pair and is a normal ranging market. For instance, the average pip movement on the 1H timeframe is only 49 pips. Note that the higher the volatility, the lower is the cost of the trade. However, this is not an advantage as it is risky to trade highly volatile markets.

Also, the larger/smaller the percentages, the higher/lower are the costs on the trade. So, we can infer that the costs are higher for low volatile markets and high for highly volatile markets. To reduce our risk, it is recommended to trade when the volatility is around the minimum values. The volatility here is low, and the costs are a little high compared to the average and the maximum values. But, if your priority is towards reducing costs, you may trade when the volatility of the market is around the maximum values.

Advantage from Limit orders

When orders are executed as market orders, there is slippage on the trade. But, with limit orders, there is no slippage as such. Only trading fees and the spread will be taken into consideration to calculate the total costs. This method will bring down the cost significantly.

Categories
Forex Assets

Trading The GBP/THB Forex Exotic Pair

Introduction

GBP

Pound sterling, also know as the pound, is the official currency of the United Kingdom and many others. The Pound sterling is the oldest currency and even the fourth most-traded currency in the foreign exchange market, after the United States dollar, the euro, and the Japanese yen.

THB

Thai Bhat is the official currency of Thailand. It’s divided into 100 satangs, According to Bloomberg, the Thai baht was the world’s best-performing currency in 2018, and since then, Thai baht is the 10th most frequently used world payment currency.

GBPTHB is the abbreviation for the Pound sterling against the Thai baht. Here, the GBP is the base currency, and the THB is the quote currency. It is classified as an exotic-cross currency pair.

Understanding GBP/THB

In Forex, to find the relative value of one currency, we need another money to compare. The market value of GBPTHB determines the cost of THB that is required to buy one GBP. It can simply be understood as 1GBP is equal to how much THB, so if the exchange rate for the pair GBPTHB is 1.6894. It means that we need 38.92 THB to buy 1 GBP.

Spread

Forex brokers have two different prices for currency pairs: the bid and ask price. Here the “bid” price at which you can SELL the base currency, and The “ask” price is at which you can BUY the base currency. Hence, the difference between the ask and the bid price is called the spread. The spread is how brokers make their money. Some broker Instead of charging a separate fee for trading, they already have the fees inbuilt in the spread.

ECN: 28 pips | STP: 31 pips

Fees

A Fee is simply the commission you pay to the broker on each position you open. There is no fee on STP account models, but a few pips on ECN accounts.

Slippage

slippage refers to the difference between the trader’s expected price and the actual price at which the trade is executed. It occurs when market orders are placed during high fast-moving, highly volatile as well as when large orders are placed at a time.

 Trading Range in GBP/THB

The amount of money you will win or lose in a given amount of time can be assessed using the trading range table. This is a representation of the minimum, average, and maximum pip movement in a currency pair.

Procedure to assess Pip Ranges

  1. Add the ATR indicator to your chart
  2. Set the period to 1
  3. Add a 200-period SMA to this indicator
  4. Shrink the chart so you can assess a large time period
  5. Select your desired timeframe
  6. Measure the floor level and set this value as the min
  7. Measure the level of the 200-period SMA and set this as the average
  8. Measure the peak levels and set this as Max.

GBP/THB Cost as a Percent of the Trading Range

The cost of trade varies based on the volatility of the market. This is because the total cost involves slippage and spreads apart from the trading fee. Below is the representation of the cost variation in terms of percentages. The comprehension of it is discussed in the next sections.

ECN Model Account

Spread = 28 | Slippage = 3 |Trading fee = 5

Total cost = Slippage + Spread + Trading Fee = 3 + 28 + 5 = 36

STP Model Account

Spread = 31 | Slippage = 3 | Trading fee = 0

Total cost = Slippage + Spread + Trading Fee = 3 + 31 + 0 = 34

Trading the GBP/THB

The GBPTHB is an exotic-cross currency pair and is a normal ranging market. For instance, the average pip movement on the 1H timeframe is only 82 pips. Note that the higher the volatility, the lower is the cost of the trade. However, this is not an advantage as it is risky to trade highly volatile markets.

Also, the larger/smaller the percentages, the higher/lower are the costs on the trade. So, we can infer that the prices are higher for low volatile markets and high for highly volatile markets.

To reduce your risk, it is recommended to trade when the volatility is around the minimum values. The volatility here is low, and the costs are a little high compared to the average and the maximum values. But, if you’re priority is towards reducing costs, you may trade when the volatility of the market is around the maximum values.

Categories
Forex Assets

Trading The GBP/SGD Exotic Currency Pair

Introduction To GBP & SGD Pairs

GBP

Great Britain Pound is also known in some contexts as the pound or sterling. It is the official currency of the United Kingdom and many British overseas territories. It is subdivided into 100 pence. The Pound Sterling is the oldest currency in continuous use, and also the fourth most-traded currency in the Forex market, after the United States dollar, the euro, and the Japanese yen.

SGD

The Singapore dollar is Singapore’s official currency, and it is divided into 100 cents. This currency is the thirteenth most traded currency in the world by value.

GBPSGD is the abbreviation for the Pound sterling against the Singapore Dollar. It is classified as an exotic-cross currency pair. In this currency pair, the GBP is the base currency, and the SGD is the quote currency.

Understanding GBP/SGD

In Forex, in order to find out the relative value of one currency, we need another currency to compare. It shows how much the GBP (the base currency) is worth as measured against the SGD (quote currency). It can simply be understood as 1GBP is equal to how much SGD. So if the exchange rate for the pair GBPSGD is 1.6894. It means that one GBP costs 1.6894 SGD.

Spread

The spread is the difference between the Bid (Sell) price and the Ask (Buy) price of an asset. The spread is how brokers make their money. Some broker Instead of charging a fee for performing a trade, the cost is built as a difference between the buy and sell prices of the currency pair.

ECN: 15 pips | STP: 19 pips

Fees

A Fee is simply the commission we pay to the broker on each position we open. There is no fee on STP account models, but a few pips on ECN accounts.

Slippage

Slippage is the difference between the price at which the trader wants to execute the trade and the price at which the trade is effectively executed. Slippage can occur at any time but is mostly happens when the market is very Volatile.

Trading Range in GBP/SGD

The amount of money we will win or lose in a given amount of time can be assessed using the trading range table. This is a representation of the minimum, average, and maximum pip movement in a currency pair.

Procedure to assess Pip Ranges

  1. Add the ATR indicator to your chart
  2. Set the period to 1
  3. Add a 200-period SMA to this indicator
  4. Shrink the chart so you can assess a large time period
  5. Select your desired timeframe
  6. Measure the floor level and set this value as the min
  7. Measure the level of the 200-period SMA and set this as the average
  8. Measure the peak levels and set this as Max.

GBP/SGD Cost as a Percent of the Trading Range

The cost of trade varies based on the volatility of the market. This is because the total cost involves slippage and spreads apart from the trading fee. Below is the representation of the cost variation in terms of percentages. The comprehension of it is discussed in the coming sections.

ECN Model Account

Spread = 15 | Slippage = 3 | Trading fee = 5

Total cost = Slippage + Spread + Trading Fee = 3 + 15 + 5 = 23

STP Model Account

Spread = 19 | Slippage = 3 | Trading fee = 0

Total cost = Slippage + Spread + Trading Fee = 3 + 19 + 0 = 22

Trading the GBP/SGD currency pair

The GBPSGD is an exotic-cross currency pair and is a normal ranging market. For instance, the average pip movement on the 1H timeframe is only 62 pips. Note that the higher the volatility, the lower is the cost of the trade. However, this is not an advantage as it is risky to trade highly volatile markets.

Also, the larger/smaller the percentages, the higher/lower are the costs on the trade. So, we can infer that the costs are higher for low volatile markets and high for highly volatile markets.

To reduce the risk, it is recommended to trade when the volatility is around the minimum values. The volatility here is low, and the costs are a little high compared to the average and the maximum values. But, if you’re priority is towards reducing costs, you may trade when the volatility of the market is around the maximum values.

Also, we can take advantage of the Limit orders to reduce costs. When orders are executed as market orders, the risk of slippage always persists. But, with the help of limit orders, we can completely avoid slippage, thereby reducing the overall trading cost. When slippage is Zero, only trading fees and the spread will be taken into consideration to calculate the total costs. Hence, it brings down the cost significantly.

Categories
Forex Assets

Information About The GBP/JPY Forex Currency Pair

Introduction

The Great Britain pound versus the Japanese yen is a cross-currency pair in the forex market. It is a widely traded pair with great liquidity and volatility. In this currency pair, GBP is the base currency, and JPY is the quote currency.

Understanding GBP/JPY

The market price of GBPJPY shows the units of yens required to purchase one pound. It is quoted as 1 GBP per X JPY. For example, if the value of GBPJPY is 143.82, then 143.82 yen are to be produced by the trader to buy one pound.

GBP/JPY Specification

Spread

Spread is the difference between the bid price and the ask price set by the broker. These prices vary from broker to broker and type of account model as well. The approximate spread on ECN and SPT accounts is mentioned as follows.

ECN: 0.7 | STP: 1.6

Fees

There is a fixed round-trip fee on every trade a trader takes. On ECN accounts, the spread is around 6 to 10 pips. And on STP accounts, there is no fee as such. However, though there is no fee on STP accounts, the total fee is still compensated with the high spread on it.

Slippage

Slippage is another parameter that adds up to the total fee. It is the difference between price executed by the trader and price he actually received from the broker. This happens solely due to the change in volatility of the market and the broker’s execution speed.

Trading Range in GBP/JPY

The trading range is a pip depiction tool that determines the minimum, average, and maximum pip movement in a different timeframe. This volatility table is pretty useful in analyzing the amount of risk that is involved in a trade. For example, if the max pip movement on the 4H is 60 pips, then a trader can get an idea that he can gain/lose a max of $552.6 in a time frame of 4 hours.

Procedure to assess Pip Ranges

  1. Add the ATR indicator to your chart
  2. Set the period to 1
  3. Add a 200-period SMA to this indicator
  4. Shrink the chart so you can assess a large time period
  5. Select your desired timeframe
  6. Measure the floor level and set this value as the min
  7. Measure the level of the 200-period SMA and set this as the average
  8. Measure the peak levels and set this as Max.

GBP/JPY Cost as a Percent of the Trading Range

The cost as a percent of the trading range is again the volatility but combined with total cost on a trade. It is a tabular representation of the cost of trading in varying timeframes and volatilities. The percentages are obtained simply by finding the ratio between the total cost and volatility.

ECN Model Account

Spread = 0.7 | Slippage = 2 |Trading fee = 1

Total cost = Slippage + Spread + Trading Fee = 2 + 0.7 + 1 = 3.7

STP Model Account

Spread = 1.6 | Slippage = 2 | Trading fee = 0

Total cost = Slippage + Spread + Trading Fee = 2 + 1.6 + 0 = 3.6

The Ideal way to trade the GBP/JPY

The magnitude of the percentages basically determines how high or how low the costs are for each trade. If the percentage is high, the costs are high. If they are low, the costs are low. The very first observation that can be made is that the costs are high in the min column comparative to the average column and maximum column. Hence, the costs are high for low volatile markets, and low for high volatile markets. But, it is not ideal to trade in either of these markets. The best time to get into the pair is when the volatility is around the average values. As far as the timeframes are concerned, the cost decreases as the width of the timeframe increases.

Placing limit orders is another way to minimize your cost significantly. Because this will not take slippage into consideration for calculating the total costs. Thus, the total cost reduces greatly. An example of the same is illustrated below.

Hence, we can see that the percentages have reduced by around 50% or so.

Categories
Forex Assets

Exploring The Basics Of GBP/CAD Forex Pair

Introduction

GBPCAD pronounced as ‘pound cad” is minor/cross currency pair in forex. GBP refers to Great Britain Pound, and CAD refers to the Canadian Dollar. Since GBP is on the left, it becomes base currency, and CAD on the right becomes the quote currency.

Understanding GBP/CAD

The current market price has of GBPCAD is not similar to the prices in the stock market. The value of GBPCAD represents the value of CAD equivalent to one GBP. It is simply quoted as 1 GBP per X CAD. For example, if the value of GBPCAD is 1.7192, then 1.7192 Canadian dollars are required to purchase one pound.

GBP/CAD Specification

Spread

Spread is the difference between the bid price and the ask price in the market. These values are controlled by the brokers. So, it differs from broker to broker as well as the type of account.

ECN: 0.8 | STP: 1.9

Fees

There is a small levied by the broker on every trade a trader takes. There are a few pips of fee on ECN accounts, while the fee is nil on STP accounts. The fee is usually between 6 to 10 pips.

Slippage

Slippage is the difference between the trader’s demanded price and the real executed price. Slippage happens when orders are executed by the market price. It happens solely due to the volatility of the market and the broker’s execution speed.

Trading Range in GBP/CAD

A trading range is the representation of the pip movement of GBPCAD in different timeframes. These values are helpful in getting a rough idea of the profit/loss that can be made from the trade in a given timeframe. For example, if the min pip movement on the 1H timeframe is 3 pips, then a trader can expect to gain/lose at least $22.38 when one standard lot is traded.

Procedure to assess Pip Ranges

  1. Add the ATR indicator to your chart
  2. Set the period to 1
  3. Add a 200-period SMA to this indicator
  4. Shrink the chart so you can assess a large time period
  5. Select your desired timeframe
  6. Measure the floor level and set this value as the min
  7. Measure the level of the 200-period SMA and set this as the average
  8. Measure the peak levels and set this as Max.

GBP/CAD Cost as a Percent of the Trading Range

Now that we know how much profit/loss can be made within a given time frame let us also calculate the cost on each trade by considering the volatility and timeframe. For this, the ratio between the total cost and volatility calculated and expressed in percentages. The magnitude of these percentages will then be used to determine the timeframe with marginal costs.

ECN Model Account 

Spread = 0.8 | Slippage = 2 |Trading fee = 1

Total cost = Slippage + Spread + Trading Fee = 2 + 0.8 + 1 = 3.8

STP Model Account

Spread = 1.9 | Slippage = 2 | Trading fee = 0

Total cost = Slippage + Spread + Trading Fee = 2 + 1.9 + 0 = 3.9

The Ideal way to trade the GBP/CAD

From the above two tables, it can be ascertained that the percentages largest on the min column, moderate on the average column, and least on the max column. The higher the value of percentages, the higher is the cost of the trade. So with this, we can conclude that the costs are high during low volatility, and low during high volatility. Similarly, the costs are high on lower timeframes and considerably low on higher timeframes. Hence, to keep volatility and cost at a balance, it ideal to trade when the pip movement in the market is around the average values.

Market orders bring in an additional cost in the trade. To eliminate this, one can trade using limit orders. This will set the slippage value to 0, and eventually, reduce the total cost on the trade by a significant amount. An example supporting the statement is illustrated below.

Total cost = Spread + trading fee + slippage = 0.8 +1 + 0 = 1.8

Categories
Forex Assets

Fundamentals Of Trading The GBP/AUD Currency Pair

Introduction

GBPAUD is an abbreviation for the Great Britain pound and the Australian dollar. This cross currency pair is widely traded with high volume in the forex market. In this pair, GBP is the base currency, and AUD is the quote currency.

Understanding GBP/AUD

The value of GBPAUD in the market is the value of AUD equivalent to one pound.GBPAUD is quoted as 1 GBP per X AUD. For example, if the value of GBPAUD is 1.8505, then these many Australian dollars are to be given to receive one pound.

GBP/AUD Specification

Spread

The prices for buying and selling a currency pair are different. To buy, one must refer to the ask price; and to sell, one must refer to the bid price. The difference between the bid price and the ask price is called the spread. The spread varies from the type of account model.

ECN: 0.7 | STP: 1.7

Fees

Apart from the spread, brokers levy fee on every round-trip trade. This fee is fixed in for every trade. However, it varies from broker to broker. Usually, there is no fee on STP accounts. On ECN accounts, there is a fee of a few pips.

Slippage

Slippage is the difference between the price when the trader entered the market order and the price he was actually given. Most of the time, there is a variation in the prices. This difference could be in favor of or against the trader. There are two factors responsible for it. One, the volatility of the market, and two, broker’s execution speed.

Trading Range in GBP/AUD

The trading range of currency pairs simply depicts the volatility of the pair in a different timeframe. In other terms, the trading range represents the minimum, average, and maximum pip movement in different timeframes. These values are helpful in assessing one’s risk, as well as making trades much cost-effective.

Procedure to assess Pip Ranges

  1. Add the ATR indicator to your chart
  2. Set the period to 1
  3. Add a 200-period SMA to this indicator
  4. Shrink the chart so you can determine a large time period
  5. Select your desired timeframe
  6. Measure the floor level and set this value as the min
  7. Measure the level of the 200-period SMA and set this as the average
  8. Measure the peak levels and set this as Max.

GBP/AUD Cost as a Percent of the Trading Range

Cost as a percent of the trading range is a very supportive tool in analyzing the cost of a trade, in different timeframes, and at different volatilities. This is done by finding the ratio of the total cost and volatility values and then expressing it as a percentage. The comprehension of the below tables shall be discussed in the subsequent topic.

ECN Model Account 

Spread = 0.7 | Slippage = 2 |Trading fee = 1

Total cost = Slippage + Spread + Trading Fee = 2 + 0.7 + 1 = 3.7

STP Model Account

Spread = 1.7 | Slippage = 2 | Trading fee = 0

Total cost = Slippage + Spread + Trading Fee = 2 + 1.6 + 0 = 3.7

The Ideal way to trade the GBP/AUD

Note that the higher the magnitude of the percentage, the higher is the cost of the trade. From the table shown above, we can observe that the values are highest on the min column and lowest on the max column. This means that the costs are higher when the volatility of the market is low and vice versa. Reading it horizontally, the cost gets lower as the timeframe widens. Hence, the ideal to trade when the pip movement of the currency pair is near the average values. This will ensure decent volatility by keeping the costs minimal.

Another effective way to reduce the total cost is by trading using limit orders, not market orders. Doing so, the slippage on the trade will shrink to zero. The following table shows the costs of the GBP/USD with no sleppage, for the same market conditions as on the preceding tables.

Total cost = Spread + trading fee + slippage = 0.7 +1 + 0 = 1.7

Hence, from the above table, it can be inferred that the cost percentages have a significant value.

Categories
Forex Assets

What Should You Know Before Trading The GBP/CHF Currency Pair?

Introduction

GBPCHF is the abbreviation for the Great Britain pound and the Swiss franc. Since USD is not involved in this pair, it is called a minor currency pair. However, there is an excellent liquidity and volatility in this pair. In this pair, GBP is the base currency, and CHF is the quote currency. GBPCHF is often referred to as “pound Swiss franc.”

Understanding GBP/CHF

The value of GBPCHF determines the Swiss francs required to purchase one pound. It is quoted as 1 GBP per X CHF. For example, if the value of GBPCHF is 1.2740, then one needs to pay 1.2740 Swiss francs to buy a pound.

GBP/CHF Specification

Spread

Spread is the difference between the bid price and the ask price in the market. The bid price is the price used for shorting, and the bid price is the price used for buying a currency pair. These prices differ from broker to broker as well as the account type.

ECN: 0.8 | STP: 1.6

Fees

For every trade a trader takes, there is a fee associated with it. This fee is basically the commission charged by the broker. This fee varies from broker to broker. Note that there is no fee on STP accounts, and on ECN accounts, the fee is around 6 to10 pips.

Slippage

Slippage in trading is the difference between the price requested by the trader and the price given by the broker. Due to variation in volatility and the broker’s execution speed, it is not quite possible to get the exact intended price. Slippage happens only on market orders.

Trading Range in GBP/CHF

Knowing the number of pips the currency pair moved in a given timeframe is a good add-on to a trader’s analysis. This will help them get an idea of the profit/loss that can be made in a specified amount of time. For example, if the average pip movement on the 1D timeframe is 50 pips, then a trader can expect to gain or lose $517.5 (50 pips x 10.35 value per pip).

Procedure to assess Pip Ranges

  1. Add the ATR indicator to your chart
  2. Set the period to 1
  3. Add a 200-period SMA to this indicator
  4. Shrink the chart so you can determine an extensive period
  5. Select your desired timeframe
  6. Measure the floor level and set this value as the min
  7. Measure the level of the 200-period SMA and set this as the average
  8. Measure the peak levels and set this as Max.

GBP/CHF Cost as a Percent of the Trading Range

The cost as a percent of the trading range depicts the magnitude of the variation in the cost in different timeframes for different variable volatility. The percentages are useful in determining the ideal time to enter into this currency pair with marginal costs. Below are the tables representing the cost percentages for minimum, average, and maximum volatility.

ECN Model Account 

Spread = 0.8 | Slippage = 2 |Trading fee = 1

Total cost = Slippage + Spread + Trading Fee = 2 + 0.8 + 1 = 3.8

STP Model Account

Spread = 1.6 | Slippage = 2 | Trading fee = 0

Total cost = Slippage + Spread + Trading Fee = 2 + 1.6 + 0 = 3.6

The Ideal way to trade the GBP/CHF

The lower the percentage, the lower are cost on the trade. In the table, we can infer that the costs are on the lower side in the max column. This implies that the cost of the trade is less when the volatility of the market is low and vice versa. Now, when it comes to the best time to trade this pair, it is ideal to pick at times when the volatility is decent, and the costs are affordable. For example, a 1D trader may trade during those times when the volatility is around 100 pips.

Moreover, the total cost of the trade can be reduced by entering and exiting trades using limit/pending orders. This way, the slippage on the trade will be fully cut off. The impact on the cost percentage when slippage is made 0 is shown below.

Total cost = Spread + trading fee + slippage = 0.8 +1 + 0 = 1.8

From the above table, it is evident that the costs have reduced by over 50% or so. Hence, it is preferable to trade using limit orders rather than market orders.

Categories
Forex Assets

What Should You Know About EUR/GBP Forex Pair Before Trading

Introduction

EURGBP is the abbreviation for the currency pair Euro area’s euro against the Great Britain pound. This pair, unlike the EURUSD, USDCAD, GBPUSD, USDCHF, etc. is not a major currency pair. This pair is classified under the minor currency pairs and the cross-currency pairs. In EURGBP, EUR is the base currency, and GBP is the quote currency.

Understanding EUR/GBP

The current market price of EURGBP depicts the required number of pounds to purchase one euro. For example, if the value of EURGBP is 0.8527, then one needs to pay 0.8527 pounds to buy one euro.

EUR/GBP Specification

Spread

Spread in trading is the difference between the bid price and the ask price. The spread is not the same on all brokers but depends on the type of account. It also varies depending on the volatility of the market. An average spread on an ECN account and an STP account is shown below.

Spread on ECN: 0.8 | Spread on STP: 1.5

Fees

On trade a trader takes, there is some fee associated with it. Fees, again, depends on the type of account. There is no fee on STP accounts, but few pips on ECN accounts.

Slippage

When a trader executes a using the market order, they don’t really get the price they had intended. There is a small pip difference between the two prices. And this difference between the prices is referred to as slippage. The slippage is usually within 0.5 to 5 pips.

Trading Range in EUR/GBP

Understanding the volatility of the market is essential before opening or closing a position. It shows how much profit or loss a trader will be on a particular timeframe. For example, if the volatility is on the 4H is 10 pips, the trader can expect to gain or lose $1269 (10 pips x 12.69 value per pip) in a matter of about 4 hours.

The table below illustrates the minimum, average, and maximum pip movement on the 1H, 2H, 4H, 1D, 1W, and 1M timeframe.

EUR/GBP PIP RANGES

Procedure to assess Pip Ranges

  1. Add the ATR indicator to your chart
  2. Set the period to 1
  3. Add a 200-period SMA to this indicator
  4. Shrink the chart so you can assess a large time period
  5. Select your desired timeframe
  6. Measure the floor level and set this value as the min
  7. Measure the level of the 200-period SMA and set this as the average
  8. Measure the peak levels and set this as Max.

EUR/GBP Cost as a Percent of the Trading Range

An application of the volatility would be the determining of cost on each trade. As in, the ratio between the volatility and the total cost on each trade is calculated and is expressed in terms of percentage. The percentage depicts the cost for a particular timeframe and volatility. The comprehension of it shall be discussed in the subsequent section.

ECN Model Account

Spread = 0.8 | Slippage = 2 | Trading fee = 1

Total cost = Slippage + Spread + Trading Fee = 2 + 0.8 + 1 = 3.8

STP Model Account

Spread = 1.5 | Slippage = 2 | Trading fee = 0

Total cost = Slippage + Spread + Trading Fee = 2 + 1.5 + 0 = 3.5

The ideal way to trade the EUR/GBP

With the above two tables, let us figure out the ideal way to trade this currency pair. Note that the higher the percentage, the higher is the cost on a trade and vice versa. It is evident from the chart that the percentages are highest for the minimum column and lowest for the max column. In other words, the cost is high when the volatility of the market is low, and the cost is low when the volatility is high. So does this mean it is ideal to trade when the volatility is high? Well, that’s not the right approach to it, as trading in high volatility is risky. So, it is ideal to take trades during those times when the volatility is around the average range. Doing that will ensure marginal cost as well as decent cost. For example, a 4H trader must take trades during those occasions when the volatility is around 20 pips.

Note: One can apply the ATR indicator to determine the current volatility of the market.

Another feasible way to reduce costs is by canceling out the slippage cost. Cancel slippage costs can simply be done by placing limit orders. With limit orders, the slippage automatically becomes 0.

The difference in the cost percentage when the slippage goes to zero is illustrated as follows.

We hope you find this Asset Analytics informative. Let us know if you have any questions in the comments below. Cheers!

Categories
Forex Market Analysis

June 29 – Technical Update on S&P500 & Gold – U.S. GDP Disappoints

The financial markets remained heavily volatile due to a series of market-moving economic events like the German CPI and U.S. Final GDP.  Well, the game isn’t over yet. We have another series of high impact economic events coming out of the market on Friday. Let’s take a quick look.


Top Economic Events to Trade

  • EUR – German Retail Sales m/m – 6:00 (GMT)
  • GBP – Current Account – 8:30 (GMT)
  • GBP – Final GDP q/q – 8:30 (GMT)
  • EUR – CPI Flash Estimate y/y – 9:00 (GMT)    
  • CAD – GDP m/m – 12:30 (GMT)
  • USD –  Chicago PMI – 13:45 (GMT)


Although there are lot more economic events due to be released, these are the most important ones and may help you capture a nice amount of pips.     


Gold – XAU/USD – Daily Outlook

On Thursday, gold plunged to its weakest level in six months to trade at $1,247. Most of the selling came in response to escalating pressure from the trade war and the sentiments of higher U.S. interest rates which continues to weigh on gold. Nevertheless, we can expect a modest reversal in the near term. Price action is expected to retrace the decays back to 1263, the same level which earlier served as support.


Support     Resistance 

1252.5    1259.76

1250.26    1262

1246.63    1265.63

Key Trading Level:    1256.13


SPX – S&P 500 – Technical Outlook

SPX is trading bullish near 2718 after gaining support above 2694. On the 4- hour chart, the upward trendline is also extending support near 2679. While the resistance prevails at 2732 and 2745 today, the main trend is up as per the daily swing chart, but, momentum is trending lower. A trade through 2679.25 will convert the main trend (bullish) into the bearish bias.


Overall, the main trading range of SPX is 2595 to 2796. The index is currently testing the upper or 50% level of this range at 2795.75.


Support     Resistance 

2697.19    2732.87

2686.16    2743.9

2668.32    2761.74

Key Trading Level:    2715.03


Categories
Forex Market Analysis

USA VS China Trade, Inflation and Quarterly Results


Macroeconomic Outlook

Three references for the markets this week

1)      Trade relation between China and USA

  1. Last Friday it was agreed what it could be the beginning of talks that will take time
  2. Rather a constructive agreement than a bad one

2)      Inflation

  1. American inflation is the key variable this week
  2. It is expected to increase to 2.5% from previous 2.4%
  3. Currently is above the 2% target and this creates certain anxiety and can have some effect on bonds
  4. Might consider the option of a lower than expected inflation (<2.4%)
  5. Payrolls data, which was published on Friday, was 2.6% instead of 2.7% moving away from the 3% barrier
  6. The option of a lower inflation rate provides a less stressful outlook

3)      Quarterly Results

  1. Really good so far in the USA
  2. Partly because of the tax reform
  3. EPS had increased to an average of 24,8% when at the beginning it was expected to be around 17%
  4. Good so far too in Europe
  5. More European companies will publish results this week

Hence, bearing in mind a decent agreement between USA and China, the possibility of lower inflation and good corporate results, the markets should bounce and rise a little this week.

Furthermore, if the inflation turns out to be lower, it could be good for bonds and could contribute to a weaker US Dollar wich has increased significantly recently.


Technical Analysis

US Dollar Index

Daily Chart

It is possible to appreciate how the US Dollar Index, after tumbling for a couple of weeks, broke all the resistances and increased significantly. The most important resistances generated from its monthly bearish trend have been broken in one strong movement upward. Including, also, its 200-day EMA which is retesting right now. The only significant resistance that is facing now is at the 93.5 which will be the next target leaving some space for a longer run.

EURUSD

Daily Chart

After testing for the third time the bearish trend line on the top it dropped,  strongly breaking its two supports below it. Not only it fell after testing its resistance and breaking the upcoming supports but also, on Wednesday it broke below the third support which is currently retesting. This can be either a fake breakout or another shorting opportunity.


GBPUSD

Daily Chart

After breaking the support, which has been holding price during its bullish trend line, it is eyeing the next solid resistance which is at a level of 1.34 more or less. After breaking the 200-day EMA, it is taking a rest. It may either retest the recent support broken which is hard as the bullish trend was really steep or test the next resistance which is closer and extending the bearish move.


USDJPY

Daily Chart

The dollar broke both resistances after doing a fake breakout and bouncing back from the monthly support. It has created a small bullish trend in the short term where it can be holding on until it reaches its next target which is the monthly bearish trend, currently situated at a level of 111.5. Either that or starts going sideways for the next days until it breaks one of the monthly trends.

Crude Oil

Daily Chart

Recent geopolitical events and tensions in Syria have created volatility in the markets, and consequently, the price of oil has been on the rise. After holding to the bullish trend line and breaking above $65 it did a retest of the recent resistances it just broke above. Without more resistances ahead, it has just reached the expected target of $70 per barrel. There are not any significant resistance above which leaves the door open for a longer bullish run.

DAX

Daily Chart

It bounced back from the monthly bearish trend which was the strongest one and consequently in the recent run it has just broken both two bearish weekly resistances. Last Friday it closed above the last resistance which leaves the door open for a continuation, possibly at less slow pace, of the recent bullish trend formed from testing the resistances and breaking the supports.

©Forex.Academy

Categories
Forex Market Analysis

Opposing forces drive the markets in the upcoming week

Weekly Update

Regarding fundamentals, we are expecting opposing forces drive the markets in the upcoming week. Volatility has sparked bearing in mind the recent intervention of the USA in Syria. However, stock futures are up, and oil is down on hopes Syria attack a one-off.

Thus, we’ll focus on the most foreseeable variables. There are three variables that are mainly moving the markets

  • Protectionism
    • A less negative pressure in the short term as fears erase
    • Recent formal declarations by Chinese president rise expectations of a friendlier trade
    • There are still two months until Trump takes in action any tariff measure
  • Technology
    • Recent testimony by Mark Zuckerberg leaves good feelings and calms the markets
    • Relieves pressure on technology companies
  • Quarterly results
    • 2018 benefits are revised downwards
    • However, 1st quarter is expected to be robust with strong corporate volumes and margins which will be positive in the short term
Macro Data

This week there is no major macroeconomic event that will affect considerably the markets.

On Monday we have American Retail Sales which are expected to increase to 0.4% from the last- 0.1%. This can benefit the US Dollar. On Tuesday, the German ZEW Economic Sentiment can have some impact on the Euro and DAX. It is expected to decrease to -0.8 from 5.1. Finally, on Thursday, the American Manufacturing Index is released, and it is expected to decrease around one point.

In general, the macro outlook is more pessimist than positive. However, the previous three variables provide a more positive outlook and provide a better understanding than the macroeconomics events on how the markets will act this week. So that, we could expect a stabilization phase in the markets after the recent volatility. In general, slightly more positive than negative.


 USD Index

Weekly Chart


In the weekly chart, it is possible to appreciate how the USD Index is not only below the 200 EMA but also broke below the weekly support that has been retesting in the recent weeks and which has not been successful so far. In the short term is facing a bearish trend line caused by its recent devaluation.

During the first half of this week, there are not big news. However, on Wednesday, American Inflation numbers come out. It is forecasted that the core CPI will increase to 2.1% from previous 1.8%. Furthermore, on Friday, Moody’s published its USA rating, which right now has the highest rating possible with stable perspective. Hence, recent controversial policies from the American government making protectionism and a trade war a reality can alter the expectations for the mention economic events. In case the forecast does not vary the USD should not be hurt. However, an unexpected increase in the Core CPI and a rating downgrade from Moody’s can really hurt the Dollar.

Daily Chart 

The daily chart is similar to the weekly chart. The retest cannot break above the recently broken support and is facing more bearish pressure ahead. Nevertheless, it just formed double bottom pattern followed by a short-term bullish trendline. This week will be critical to know whether the bearish support is strong enough or it holds on to the current bullish trend.

EURUSD

Daily Chart

Regarding the EURUSD, it has been flat since February. Last month it broke its monthly bullish trend, and the consequently retest it.  From there, it has remained flat with no major fluctuations. However, with the recent uncertainties facing both the Eurozone and the USA it will not be surprising to see the EURUSD leaning towards a side. For now, it is holding at a strong resistance that dates back to September of 2017.  It is facing a couple of support and resistance which will help to know towards what side it will lean and leave the rectangle it is in now.

USDJPY

Daily Chart

Moving into the USDJPY, it has just bounced from a monthly bullish trend after doing a fake breakout and consequently bouncing back. A bullish trend could be considered since there are not big resistances ahead part from the 200 EMA and the recent bearish monthly trend. In the short term, there are two resistances not very strong, but that may cause a small retracement. However, the monthly support is stronger than the resistance it is locked up between.

GBPUSD

Daily Chart

GBPUSD seems to have no limits. At the beginning of the year, the Pound broke an important bearish trendline holding to its current bullish trendline. Moreover, last week just broke another key resistance. With no more important resistance ahead it has a clear path to keep up with the current upward trend. Maybe it is possible to do small retest as we saw with the previous one.

Crude Oil

Daily Chart

Recent political events, like the recent issue of the missile attack against Syria, have created volatility in the markets and consequently, the price of oil has been on the rise. After holding to the trendline and breaking above $65 it is possible to see a retest of the recent resistances it just broke above. Without more resistances ahead, analyst set that next target is $70 per barrel.

DAX

Daily Chart

Regarding technical, it is within a bearish trend that can be prolonged as there is still uncertainty in terms of politics and the recent macroeconomics event have not been reaching the forecasted ones. However, an improvement in the economic sentiment and political stability can help the DAX to break the ahead resistance and enter a bullish trend, leaving the current flat to bearish trend it is involved in now.

As commented at the beginning, on Tuesday the German ZEW Economic Sentiment is released. Hence, it can major point to decide whether it breaks the recent resistance and follows the daily bearish trend.

© Forex.Academy

Categories
Forex Market Analysis

market overview for US index & pairs

News

No need to say that that the hour talk now is about hitting Syria by US, France, & Great Britain

Of course, there’s a lot of action going on as U.S. tells UN it’s ready to hit Assad again, if necessary.

Also U.S. Eyes Russia Sanctions for Syria, U.K. Sees One-Time Hit.

UN Ambassador Nikki Haley, speaking Sunday on CBS’s “Face the Nation,” said U.S. Treasury Secretary Steven Mnuchin will announce new sanctions Monday that “go directly to any sort of companies that were dealing with equipment” related to Syrian leader Bashar al-Assad and his chemical weapons.

Oil prices, which already are above their three-year highs, may be about to jump further.

As Brent oil could spike to $80 a barrel if the U.S. and European Union reimpose sanctions on Iran, and as Western powers expand the scope of the Syrian civil war.


US Index

S&P500 behaviour has been intensively bearish on Daily frame, with a sideways movement during the last ten weeks.

There are perfectly well-noticed signs indicating that prices will be up active again.

Reversing from the support level at 88.35, bouncing from the uptrend’s  2018 low, and forming a double bottom, which is a reversal pattern, to give shape to a harmonic pattern (crab).

The price is facing a strong resistance test at the down trend lin from the high of May 2017, also with the red resistance zone (90.45-91.65).

If the price successfully breaks these levels, we can see it climbing up to its next zone (92.55-93.9). as it’s 61.8% & 78.6% Fibonacci, B harmonic level, and turn down from the high of 2017.

 EUR/USD

On 1H frame, we can see that the price broke the uptrend line provided by reversing from resistance zone (1.239-1.2425). The most important issue is that it approached the downtrend line traced from 2008 high.

The price draws a triangle that, if broken down, we can easily test the levels 1.23 then 1.226


GBP/USD

On 1H frame, the pair touched the resistance 1.428, with a megaphone pattern.

The price is expected to visit the 1.42 level to retest it. In case it breaks it, we can see it touching 1.415 and then 1.409


NZD/USD

The pair has faced its resistance level at 0.939 by breaking the uptrend line and rising reversal wedge. It’s supposed to retest the uptrend from the low of April at 0.732 then 0.727

Categories
Forex Market Analysis

Volatility moves towards Europe

Hot Topics:

  • S. Core PPI (YoY) reaches the highest level since 2012.
  • Volatility moves towards Europe.
  • The pound rally continues due to the weakness of the dollar.
  • Jinping reduces risks of a Trade War.
  • Oil Brent reaches the highest level since 2014.

U.S. Core PPI (YoY) reaches the highest level since 2012.

The signs of strength in the economic growth of the United States continue, the Underlying Producer Price Index (YoY) reached 2.7% in the March period, the highest level since June 2012. The Core PPI (MoM) index, for its part, it reached 0.3% on the expectations of analysts who projected 0.2%. According to the Bureau of Labor Statistics, 70% of the increase in final demand is attributed to a rise of 0.3% in the prices of final demand services, in the same way, transport and storage services for final demand increased by 0.6 %. The increases in the level of inflation for producers are expected to have an impact on the Consumer Price Index, which will be published this Thursday.

Despite these positive macroeconomic data, the greenback index continues its strong depreciation, which has lost 2.83% in the year. Today is closing with -0.25% of loses. We are paying attention to the zone between 89.15 and the 61.8% of Fibonacci retracement level, where the Index has found support.

Volatility moves towards Europe.

The risks of the Trade War between the United States and China are disappearing more and more with the bilateral attempts to resolve the conflict in a friendly way. However, in Europe, the scenario that seemed full of geopolitical stability is changing. This Sunday 08, Viktor Orban won the elections in Hungary for the fourth time in a row. With an utterly autocratic speech, the nationalist Prime Minister proposes an anti-immigrant policy and open attacks towards the European Union. Hungary refuses to comply with the agreed European migration policy, that is, accept quotas of Syrian refugees, in the same way as the United Kingdom raised in one of its arguments against Brexit. It should be added that Mr Orban is not alone in this political tendency; he has found allies in power in Poland, the Czech Republic, Slovakia and Italy. All of them are willing to reject the obligation to accept refugees and respect the right of free movement.

The euro has closed with gains for the third consecutive session with a 0.29% of advance. The pair shows a bullish move in the middle of a sideways formation. In the last trading session, the price has found resistance at 61.8% of Fibonacci retracement

The pound rally continues due to the weakness of the dollar.

The pound continues for the third consecutive session in a bullish rally advancing 0.64% in the week and has gained 0.35% in the last trading session. All this occurs in the context of the weakness of the dollar despite the excellent macroeconomic data of the United States. The level of support to be controlled is 1.4145; the key resistance level is 1.42 as a psychological level.

Jinping reduces risks of a Trade War.

Chinese President Xi Jinping has promised to reduce import tariffs by alleviating the fear generated by the escalation of bilateral tensions between the United States and China. In a speech held at the Boao Forum, President Jinping promised to open the Chinese economy further, protect the intellectual property of foreign companies. These words filled the market with optimism, leading the indexes to move positively, the Dow Jones Index advanced 1.48%, while the yen reduced its attractiveness as a refuge, leading the USD-JPY to close with 0.41% of earnings.

The USD-JPY pair is forming an ascending diagonal pattern, which still has space to follow a rally, the closest resistance levels are 107.49 and 108, and the support level to control is 106.64.

The Dow Jones index, which is within a descending channel, the price is for the control support level at 24,037.3 and is developing a possible upward diagonal formation whose closest resistance is at 24,630, a level that coincides with the Upper part of the bearish channel. Bullish positions are valued as long as they do not fall below the 23,749.3 level.

Oil Brent reaches the highest level since 2014.

The euphoria of the reduction of the economic tensions between the United States and China due to the sayings of Jinping, not only has motivated to the indices but also the oils. The Brent has reached its highest level since 2014, reaching the $ 71.03. Crude Oil, on the other hand, approached two-week highs reaching $ 65.76. The oil rally and the Dollar weakness also benefited to the pair USD-CAD (by inverse correlation) which closed at lowest levels since February testing the psychological level 1.26 approaching the level of Fibonacci retracement 61.8% at 1.2583.

Our central view for this highly correlated group has been bullish; but we currently prefer to maintain a neutral position considering that once the oils reach specific levels in the long term for their structures, they should make a significant corrective movement that will allow us to join to the trend. As long as Brent does not reach the area between $ 71.26 and $ 72.91, and Crude Oil does not come close to $ 69 and $ 70, we do not expect a start of a significative correction.

In the case of the USD-CAD pair, once it reaches the base of the channel, it is expected that a bullish move could begin.

©Forex.Academy


Categories
Forex Market Analysis

Tit-for-tat weighs heavy on the markets

A difficult week

It has been another difficult week in the markets, and this has been primarily down to the difficulty in assessing what the trade standoff between the US and China mean for the markets. The week started off with the market taking fright as additional tariff threats were voiced by the US, leading to a sharp sell-off in equity markets. However, much of that rhetoric was rowed back on leading to a significant bounce back actually making pre-fright highs before the SP500 started to sell off again.  This simply means that there is no overriding directional bias in either direction making this market very choppy and difficult to trade.


Gold

As a result, the Gold market responded by initially strengthening due to the fear related to the equity story but then reversed those initial gains and now trades right in the middle of significant support and resistance levels which can be clearly seen from the chart below, these significant levels are $1,357 and $1,310, so all eyes will be on these levels over the coming days and weeks to see what is next for the yellow metal.

Oil

The Crude-Oil market responded to these major global developments by initially selling off but then after seeing a bit of erratic price action we continued to see a continuation to the down side, closing the week below the $62 level.  However, from a technical perspective, the situation regarding the crude oil market is an interesting one.  We can see from the chart below that we have been in a consistent up trend since mid-June 2017, reaching a high of $66 towards the end of Jan 2018.  Since this time, this market has clearly struggled to break the $66, creating a double top end of March.  So over the last two weeks, this market has bounced back to its lower trend line.  The next few days will be interesting to see whether the support level holds and we see another attack at the $66 level or will this support level break, and we see prices pushing down to a potential structural failure below the $60 level which would put major pressure on this market to the downside.  At this crucial point, it’s hard to see whether buyers or sellers will win out.


So just to recap, over the course of the last 5 trading days, US officials made very strong statements about the need for trade tariffs to be introduced only for US officials to then row back on some of its rhetoric, as a result, market nerves were calmed, and Monday’s fear related move was subsequently reversed. The S&P rallied and then retraced, and the gold and crude oil markets came off.

US Dollar

The USD, however, has been impacted by recent events but to a lesser degree. As you can see, from the chart below, the dollar index has been in a period of consolidation since mid-Jan.  These, unfortunately, for the time being, are the market conditions in which we are trading the USD. The two major prices to keep an eye out for over the coming days and weeks is the 99.880 to the up side and 88.416 to the down side.  A move in either direction would be significant for this market.


EURUSD

EURUSD continues to trade within a range. Today’s weaker NFP numbers perhaps suggest that the pair might move higher next week given the fact too that from a technical perspective, the pair is trading closer to the lower end of its range as can be seen from the chart below.


USDJPY

USDJPY has been firmer this week, however, watch the key pivotal resistance area next week around 108.20. This was the breach that confirmed a bearish range breakout back in February.


The US Dollar paired earlier gains during Friday’s London session after data showed the US economy adding new jobs at less than half the pace economists had expected for the March month. The important Non-Farm Payrolls figure grew by just 103,000 during the recent month, which is down from 313,000 in February and far below the economist consensus for a reading of 188,000.

Separately, the unemployment rate held steady at 4.1% for the month when markets had been looking for a 10-basis point fall to 4.0%. Household incomes grew by 0.3% during the recent month, which is up from the 0.1% seen in February and in line with the consensus forecast of economists.


Price action largely noted limited volume in the week leading up the non-farm payroll figure but saw initial volatile swings before the USD began to weaken over the course of Friday afternoon and evening.

Trade of the week – Long GBP/USD

With the US caught up with trade issues with China causing confusion among other countries and added uncertainty across the US Dollar Forex Pairs, perhaps the best technical trade may look GBP support with better than forecast UK economic data.

With the GBP showing strength over the USD in April for the last 13 consecutive years running, speculators are now looking at this trend for the best potential buying opportunity. With good news for the pound with UK PMI slightly higher than expectations, Friday trading is seeing the pound trade up with a touch and bounce from the greater bullish trendline of 2017. The discussion now seems to favour the pound is seemingly defying the expectations of Brexit doom.


Categories
Forex Market Analysis

The Trade War could benefit South American Producers

DAILY UPDATE

Released: 5th April 2018.

Hot Topics:

  • The trade war could benefit South American producers.
  • The unemployment rate of European Union falls to 8.5%.
  • Climatic factor impacts on March PMI Construction.
  • The Bounce of the Stock Markets Boosts the Yen’s Crosses.
  • Indices rebound driven by possible bilateral talks between the United States and China.
  • The Canadian Dollar is showing an example of the alternation rule of the Elliott Wave theory.
  • Crude Oil Production falls to its lowest level in over a year.

The Trade War Could Benefit South American Producers.

Uncertainty due to the trade war between the United States and China continues. This time China has reacted by incorporating a 25% tariff on soybeans of US origin. It should be noted that China is the primary consumer of soybeans in the world. As a result of this increase in tariffs on American soy, it is estimated that China could turn to South American producers to meet the demand for the grain. Despite this pessimism in the economic context, the Dollar Index in the hourly chart is developing an inverted Head and Shoulder pattern as a bullish continuity configuration. The next control zone is in the range of 90.20 and 90.36, in case if we do not overcome the resistance of 90.36, we could see a potential retracement to the 89.15 area.

The Unemployment Rate of European Union Falls to 8.5%

The signs of recovery in the European economy continue. The unemployment rate of the European Union has fallen to 8.5% in February, down from 8.6% in January. According to the information provided by Eurostat, the labour market in the Eurozone has reached the lowest level since December 2008. This level of optimism has not been enough to push the Euro towards new highs. The single currency is within a range between 1.225 and 1.23, from where it could create a bottom around the levels 1.2213 and 1.224. A new bullish rally could start from here.

Climatic Factor Impacts on March PMI Construction.

The PMI of the Construction sector (MoM) plummeted sharply to 47 pts, compared to the 50.9 forecast, despite the weak data. It is the lowest level since July 2016, when it reached 45.9 pts in the context of the Brexit elections (June 23, 2016). The critical factor in the decrease in activity has been the climatic factor, remember that in March the worst snowfalls in recent years were recorded. Technically the pound is developing a pattern of Head-Shoulder, which could be contained in a more extensive setup of Head-Shoulders. This could lead to sterling up to 1.3922 in the first instance, and up to 1.3737 in the second instance. All this structure could correspond to a major degree lateral structure that takes us from the 1.373 area to reach new highs around 1.45.

The Bounce of the Stock Markets Boosts the Yen’s Crosses.

Yesterday, although tensions in the dispute of tariffs between the United States and China, the Bank of Japan (BoJ) disbursed 833 billion yen (about US $ 7.8 billion) in the purchase of Exchange-Traded Funds (ETFs). This level of expenditure is the highest level since September 2017, the month in which the BoJ spent 830 billion yen. This action earned the yen to start a turn in its trend; this can be seen both in the chart of the USD-JPY and EUR-JPY which have begun to show bullish patterns. For the USD-JPY pair, the closest key resistance level is 108; in the case of the EUR-JPY cross, the control level is 131.71, a level that if exceeded could lead to the price to exceed 133.5 with a maximum extension of 134.5 in the short term.

Indices Rebound Driven by Possible Bilateral Talks Between The United States and China.

Through his Twitter account, President Trump stressed that the United States is not in a trade war with China. The Trump administration indicated that it is willing to negotiate with China on the escalation of tensions between the two countries. The most significant problem as mentioned by the American President in his account on the social network is that the deficit in the American trade balance is $500 billion, which according to his words “When you’re already $500bn DOWN, you cannot lose.” With the fears of a commercial war between the Trump administration and the administration of Jinping, the indices began to recover confidence. They realised a V-turn pattern is taking the Dow Jones to close above the 24,000 pts in a day. It started lower in the global indexes. The level of resistance to control is between 24,800 pts and 24,982 pts, an area from where in case of breaking up, could take us to levels close to 26,000 pts. The key support levels are 24,034 and 23,330 pts, which coincide with the base of a bearish channel.

The Canadian Dollar is Showing an Example of the Alternation Rule of the Elliott Wave Theory.

The Loonie has made a false rut beginning a downward cycle. It is developing a long-term bullish channel as a long-term bearish formation and is reaching a zone of 1.31 and coinciding with the upper guideline of the channel. Once started, this bearish cycle has been developing five clear movements. In this case, we will highlight the corrective formations or consolidation. According to the Elliott Wave theory, the alternating rule states that after a simple corrective structure, a complex structure should be presented and vice versa. By looking at the time chart of the USD-CAD, we can see this application. The conclusion that this case leads us to is to suspect that a recession is approaching, and that could take the price to levels around the area of the complex corrective structure and then return to develop new minimums in the long term.

Crude Oil Production Falls to Its Lowest Level in Over a Year.

The production of crude oil from the countries belonging to OPEC has fallen to the lowest level in a year and a half. This is mainly due to the problems plagued by the policy of Venezuela, where production decreased by 100,000 barrels per day since February, reaching 1.51 million barrels per day according to the survey conducted by Bloomberg News. The overall level of the output of the 14 OPEC member countries fell by 170,000 barrels to 32.04 million barrels per day in March. OPEC has helped stop production as of January 2017 with the aim of boosting the price of oil, which has been currently consolidating above $60 a barrel. Structurally in the hourly chart, we observed a Head-Shoulder formation that did not reach the technical target bouncing upwards. As long as oil does not lose levels below $60.2, the dominant trend continues to be bullish.

©Forex.Academy

Categories
Forex Market Analysis

The Germany ZEW Economic Sentiment could mark optimism for the Euro and other stories

Hot Topics:

  • GBP – The Unemployment rate in historic lows.
  • AUD – Waiting for the minutes of the last meeting of the Reserve Bank Board.
  • EUR – The Germany ZEW Economic Sentiment could mark optimism for the Euro. 

GBP – The Unemployment rate in historic lows.

On Wednesday 21th, the unemployment rate will be released. The analyst survey consensus does not foresee changes in respect to the last month’s data of 4.3 percent, the lowest in four decades. On the same day, the Bank of England (BoE) will release its Annual Inflation Report to the Treasury Select Committee. The BoE’s Governor, Mark Carney will speak in the British Parliament on the Annual Inflation Report to the Select Committee of the Treasury.

The pound reached a new low below 1.3978 and as long as it does not exceed 1.434, there is a high probability that it will fall back to new lows with a maximum target of 1.3448, which would coincide with the long-term bullish guidance.

GBP-USD 4-hour chart (click on the image to enlarge)


AUD – Waiting for the minutes of the last meeting of the Reserve Bank Board.

On Tuesday 20th, in the overnight session, the Reserve Bank of Australia (RBA) will publish the minutes of the last monetary policy meeting, where the members of the Reserve Bank Board decided to keep the interest rate unchanged at 1.50%. Although members observe the growth of employment, and the unemployment rate has remained at a minimum, they conclude that inflation is still below the target goal of the RBA.

The AUDUSD pair could be developing a corrective structure in the form of A-B-C, which could lead to 0.765, once it reaches this area, it could again be a new connector of a higher degree leading to new highs.

AUD-USD 4-hour chart ( click on the image to enlarge)


EUR – The German ZEW Economic Sentiment could mark optimism for the Euro.

In January, the German Economic Sentiment Index ZEW reached its highest point in 8 months, marking 20.4 points, increasing the expectation in the economic environment for the first half of the year. For this month, the analysts’ consensus expects it to fall to 16 points. However, considering the last GDP (YoY) in Germany reached 2.3%, and in the Eurozone which reached 2.70% (YoY), we expect the ZEW index to continue at the same level as that registered in January.

The single currency could mark a new maximum that could reach 1.2646, thus completing a sequence of five movements. After this, we could expect a corrective move for the Euro. However, we should expect all pairs against the Euro to be “aligned” before starting a more profound corrective process for the euro.

EUR-USD 4-hour chart ( click on the image to enlarge)

Categories
Forex Market Analysis

DAILY ABSTRACT – 13th February 2018


Hot Topics:

  • GBP – Waiting for more falls in the Cable.
  • USOIL – Crude Oil is waiting for the issuance of the monthly report of the IEA.
  • DOLLAR – Observing a possible corrective movement.


Main currencies daily performance.


GBP – Waiting for more falls in the cable.

In a week full of inflation data, we started with the inflation of the United Kingdom. For the month of January, we expect a slight reduction in the CPI from 3.1% to 3.0% (YoY). The level of consensus is above the Bank of England’s (BoE) 2% objective, which at its last meeting of the Monetary Policy Committee, expects a slight downward turn, stabilised at the level projected in the coming months, around 3% in the short term.

Technically, we can see that the Cable is in the middle of a bearish structure that could take us to levels of 1.355 to 1.3448. The invalidation level of this bearish formation is 1.406.


GBP-USD 4-hour Chart ( Click image to enlarge)

USOIL – Crude Oil is waiting for the issuance of the monthly report of the IEA.

Yesterday, the monthly report of OPEC was released, where it expects the global demand of Crude Oil to grow to 98.60 mb/d (million barrels/day) in 2018, compared to the demand registered during 2017 that reached 97.01 mb/d. As for the world supply, OPEC estimates that during 2018 it will reach an average of 59.26 mb/d in non-OECD countries and 57.86 in the case of the OECD countries.

As you can see in the chart, we expect the price to reach $57 to start forming a reversal pattern that can take us to the medium-long term target area of $70.

OIL WTI 4-hour Chart ( Click image to enlarge)

DOLLAR – Observing a possible corrective movement.

The Dollar Index <DOLLAR> has developed two bullish impulse movements. From the current zone, we are expecting it to make a slight bearish move to complete a higher grade bullish structure that would take us to the first weekly resistance R1 at 90.823. We should not lose the point of view that the bias is bullish.

US Dollar Index 1-hour Chart ( Click image to enlarge)

Categories
Forex Market Analysis

DAILY ABSTRACT – 9th February 2018.

Hot Topics:

  • GBP – BoE decides to maintain the interest rate unchanged at 0.5 percent.
  • USOIL – Falls in a session of high volatility in the markets.
  • USDCAD – Waiting for employment data release.


Main currencies daily performance


GBP – BoE decides to maintain the interest rate unchanged at 0.5 percent

Bank of England’s (BoE) Monetary Policy Committee (MPC) members decided unanimously to maintain the interest rate unchanged at 0.5 percent.  MPC members see that the UK economy will grow “only modestly over the forecasted period.”

Inflation is expected to remain around 3% in the short term, attributed mainly to oil prices. Regarding the possibility of an increase in the interest rate, BoE Governor Mark Carney pointed out that the interest rate increase is likely to be realised soon. The BoE suggested as a possibility that it might be during the month of May.

Once the decision of the BoE was published, the Cable climbed up to 1.40 (resistance level R2) from where it made a reversal movement towards the pivot point. Structurally, in the short-term, we expect more falls towards the area of 1.355 – 1.345.

GBP-USD hourly Chart ( Click image to enlarge)

USOIL – Falls in a session of high volatility in the markets.

Oil has continued its downtrend. In a day marked by high volatility, crude oil closed with losses of 2.03%. In the United States stock market, the companies correlated with oil, Exxon <XOM> and Chevron <CVX> registered declines of -1.62% and -2.13% respectively.

In the currency market, the Canadian dollar fell -0.24%.

In our short-term view, we maintain a bearish bias down to the $60 – $59 zone, from which the crude could experience a technical rebound.

OIL WTI hourly Chart ( Click image to enlarge)

USDCAD – Waiting for employment data release.

The last emission of macroeconomic data of the week comes from the Canadian Dollar, where the unemployment rate will be released. The consensus of the analysts forecasts 5.8%, while the change of employment for the month of January should register a setback around -2K.

Our technical vision is that the Loonie could make a limited upward movement to the confluence zone between the weekly resistance level R3 and the Fibonacci level F(61.8) 1.2663. From there, it could initiate a bearish move with a target profit in the weekly pivot 1.2326. The invalidation level is 1.2808.

USD-CAD 4-hour Chart ( Click image to enlarge)

Categories
Forex Market Analysis

Hot Topics – December 18 to 21, 2017

Hot Topics:

  • US DOLLAR – THE BEARISH BIAS DUE TO TAX REFORM CONTINUES.
  • GBP-USD – BREXIT NEGOTIATIONS AND ECONOMIC GROWTH DRIVES STERLING.

This past week presented significant advances for the New Zealand dollar with a 2.25% advance, due mainly to the weak inflation data (YoY) shown by the American economy (1.7% vs. 1.8% expected). The increase of the interest rate by the FOMC was not enough to reverse the advance of the Kiwi.

The worst performance of the week was exhibited by the British Pound with a -0.41% loss. The BoE decided to keep the interest rate at 0.5% in the context of an increase in unemployment for a second consecutive month, reaching 4.3%. On the other hand, inflation (YoY) scored a 3.1% advance, the highest level for almost six years; specialists believe that CPI is reaching a peak and that it could mainly impact the cost of the services sector.


 US DOLLAR – THE BEARISH BIAS DUE TO TAX REFORM CONTINUES

Dollar begins a bearish week in the context of uncertainty over the approval of tax revision legislation with the aim of making American companies more competitive.

The Republican Senator Bob Corker has expressed concern about the fiscal deficit that can result from the tax cuts. Despite having a position in favour of the tax review, doubts remain in the approval of the reform, in the same way that the Senate rejected the Trump Administration’s proposal to suppress Obamacare last July.

The Greenback has broken the bullish guidance that has reached S3; there is a possibility that it will develop a bullish reversal movement up to the weekly pivot level. You can find more information in our article Finding Trade Opportunities Using Pivot Points.


GBP-USD – BREXIT NEGOTIATIONS AND ECONOMIC GROWTH DRIVES STERLING.

Economic growth and negotiations for Brexit continue to be the primary drivers of the Sterling. On Wednesday, the governor of the BoE will address the Parliament in the context of the hearing of the Select Committee of the Treasury on the November Financial Stability Report.

The British Prime Minister, Theresa May, has assured the Parliament that she is looking for the Brexit transition to be completed within two years. The first phase of the Brexit negotiations has been on the rights of EU citizens in Britain. EU members have agreed to move to the second stage, which focuses on the transition and future commercial relations. The British Parliament has urged May to stand firm in the interests of the United Kingdom, such as a previous Prime Minister, Margaret Thatcher.

Technically, the Pound is developing a corrective structure, with a bias for bullish continuation. The RSI shows a bullish divergence; however, we expect a retracement towards the weekly pivot zone and then continue with the bullish movement in the medium-long term.

 EUR-USD – CORRECTIVE STRUCTURE IN DEVELOPMENT

The single currency is developing a corrective structure; the RSI has not yet shown evidence of rupture. We expect the price to make a bearish movement in five; that means, the euro could move up to R1 and then fall to S2, thus completing a five-wave sequence.


 USD-CAD – LOONIE CONTINUES IN A SIDEWAYS RANGE MOVEMENT.

The Loonie continues in a sideways range formation, waiting for data to act as a catalyst. Most probably, the previous movement will continue to R2 (1.30 level). The RSI is forming a triangular structure that is finding resistance at level 60. The bullish bias still prevails, with the average of 9 periods under the RSI.


 NZD-USD – A PENNANT THAT COULD BE A PAUSE OF A NEW RALLY.

Last week, the Kiwi was the best currency performer with a 2.25% increase against the USD. This week it is developing a pennant pattern, manifesting a pause with further continuity of the bullish movement. The RSI, on the other hand, is forming a corrective structure. We expect a false move towards the weekly pivot, and then, continuing the upward cycle to the zone of R2 (0.715).


Categories
Forex Market Analysis

Outlook for 10.24.2017

EUR/USD

The US Dollar is hesitant as President D. Trump told reporters he is very close to a decision about who should chair the Federal Reserve, which includes current Fed Chair, Janet Yellen. It also weighs on the US currency the rumors about Trump’s plan to reform taxes.

On the Euro front, European Central Bank is expected to announce on Thursday a possible timetable for a reduction of its asset purchases, as economic data suggest the Eurozone might witness a higher than expected economic expansion in 2017. Reducing asset purchases might, likely, be accompanied with a continuation of low interest rated, as Eurozone inflation data seems to be stable

Sideways channel movement on the EUR/USD pair

The Euro 1-hour price has been trending down since Oct, 19 when it draws an almost perfect triple top (1). Yesterday it touched Oct, 18th lows and bounced from there, and piercing up the downward trendline

Overall, the EUR/USD pair seems to trade in a sideways channel, but its current price may allow for a profitable trade, with a target touching the upper trend line (fig.1).


GBP/USD

JP Morgan analysts are convinced that shorting the GBP is still the way to go

The GBP is, still, affected by the Brexit process, but no major news about it is expected today. Slower consumer expending and softening of economic sentiment press policymakers to keep interest rates unchanged, which weighs on the British currency.

Daniel Hui, a foreign exchange strategist at J.P. Morgan said that their conviction to short the GBP is still high because they felt UK rate hikes were “overpriced”, given the “weak starting point for UK growth” and the reality of a Brexit shock that keeps dominating the medium-term outlook.

There is evidence that today’s lows might be the start of a new up-leg that may carry GBP/USD prices up to, at least, the highs of this lateral channel

GBP/USD daily price is experiencing a sideways movement, after retracing more 70% of its upward movement from its lows in August 2017

Possible scenarios:

  1. Today’s lows (1.31653) might be the start of a new up-leg that may carry GBP/USD prices up to, at least, the highs of this lateral channel (1.32272), provided that prices cross over the downward trend line.
  2. If the price does not continue up and reverse near the BB mean, then the downward leg is continuing to its next floor, at 1.31, and a good reward to risk trade is possible at about 1.3177.


USD/JPY

Japan was in focus yesterday, as prime minister, Shinzo Abe is back in power

Japan was in focus yesterday, as prime minister, Shinzo Abe is back in power, after his victory this weekend, that drove the yen downward yesterday. Today, we see a bounce that set prices to test the highs of yesterday’s session. Tuesday, the Japanese currency, instead of focusing on Japan’s manufacturing PMI, slightly lower in October, it seems to pay more attention to interest rate differentials.

Mid-term, the USD/JPY is trading on a lateral price channel whose low is at about 107.7 and it’s high is at 114.34. Currently, the price, trading at 113.71, is moving closer to the top of that channel.

A short-term bottom at (1) in sync with the MACD signal crossover, marks the start of a new uptrend. The red 10-period BB is sloping strongly up, so prices are heading for a test of the recent highs at (3), and, potentially break them up.

The best possible action here is to scalp on a short timeframe, such as 15 min charts or shorter, being aware that we are at the highs of a mid-term channel. Long and short-swing trades must wait for a clear signal or news event


USD/CHF

The Swiss National Bank (SNB) is keeping an expansive monetary policy that drives Swiss CHF down

The Swiss National Bank (SNB) considers the CHF to be over-valued, so it is keeping an expansive monetary policy that is driving the Swiss currency down. The SNB policy of negative interest rates contributes to the downward currency trend.

To sum up, the Swiss economy is slowing down, its growth rate (+0.3%) is losing track compared to the one registered in the Eurozone (+2.3%) in the second 2017 quarter.

USD/CHF is at overbought but still strongly moving up

The USD/CHF weekly is on a sideways channel with a lower limit at 0.942, and an upper limit at 1.0365. Its current price – 0.9896- is at about the middle of this channel. On a daily and weekly basis, the price is in overbought territory.

Today the USD/CHF is trading strongly up, and its hourly chart is currently at overbought territory as well, with its price touching the 3rth Bollinger band (+3STD) (1). On such a strong trend, the best thing to do is wait for a price pullback to create a short-term support near the mean of the Bollinger bands (2) and set a long trade there.


AUD/USD

Tomorrow, Australia’s quarterly inflation data will be released.

The Aussie is under pressure as the soft Chinese housing data was weaker than expected. China is a major partner for Australia, and China’s economic health shakes Australian currency for the good and the bad. The Housing Price Index grew in China by 6.3%, after an 8.3% increase in August. Next Wednesday, Australia will release its quarterly inflation figures.

AUD/USD is currently in a downtrend

The AUD/CAD pair, on a weekly chart, is moving on a downward leg, in a sideways channel that started in Jan 2015. The channel has a slight upward bias.

On the daily chart, the AUD/USD pair is down-trending after drawing a double top (July and September 2017). Actually, the price is below the -1 Bollinger Band showing that the downtrend is still in place

The most probable scenario for the AUD/USD pair is to go down to at least 0.766, or, even deeper, to touch the lower weekly trend line (0.7518). The MACD crossover to the downside confirms the bearish bias of this currency pair


USD/CAD

USD continues to show strength against the Canadian currency. Tomorrow’s interest rate decision by the Bank of Canada will bring a confirmation (or denial) to the strong uptrend od this currency pair. The odds of a new rate hike are getting lower, after weak economic data ahead of the BoC meeting.

Canada Wholesale sales rose by just 0.5% in line with forecasts, although, it seems the market expected a bit more increment.

USD/CAD moving up with strength
The USD/CAD pair, on a weekly chart, is in the middle of a retracing trend, starting at the beginning of September, which has retraced 35% of the length of the downward move. Its daily chart shows the currency pair approaching the ceiling of a potential wide and sideways price channel. The other notable fact being, a price breakout through 1.25953, starting a new impulsive leg up.


NZD/USD

NZ Government to reform RBNZ process to set rates.

The Kiwi dollar is under pressure since the government announced its plans to reform the Reserve Bank of New Zealand. NZ Labor-led coalition said it will modernize the bank’s process for rate-setting and adapt it into a format that was more “growth-friendly”. Giving hints about expansionist monetary policy. Analysts say the RBNZ reform is already well priced by the market, and have downplayed its impact on interest rate expectations.

NZD/USD is currently at the bottom of a down-trending channel

On a daily chart, the NZD/USD pair is trending down on a channel that started on July, 27. Actually, the price is oversold, well below the -2 Bollinger Band. The price is near a mid-term support, so it’s in the process of bottoming out, as is clearly seen in its hourly chart.

A possible scenario for the next few hours is a retracement from here to test resistance points at about 0.695. If it stalls without breaking 0.6908, and MACD turns bearish the retracement is failing, and the downtrend might resume testing the lows made in May 2017.