Categories
Forex Assets

Fundamentals of the Australian Dollar (AUD) and the New Zealand Dollar (NZD)

The two currencies, the Australian Dollar and the New Zealand Dollar are quite highly correlated, which is why this article will deal with them both at the same time. Here, we’ll cover their historical backgrounds, economic impacts, correlation, recent market activity, and much more. 

Historical Background

Australia was populated by the British in an attempt to alleviate the overcrowded capacity of British prisons and grow the British Empire. The new colony grew to the extent that they created their own government in the end. The Australian Dollar, which is also known under the ISO symbol of AUD, is one of the top 10 currencies in the world. When compared to the country’s size, as well as that of its population and economy, the official currency of Australia is truly impressively ranked among other world currencies. This currency replaced the Australian pound in 1966 and is now considered a proxy for some vital strategies in the currency market. As opposed to the EUR/USD or USD/JPY crosses, which entail a number of goods and services trades that get intertwined with currency trades, the AUD’s privileged position mostly stems from forex trading alone.

Apart from the name and the symbol, the currency is nowadays also referred to as $A, $AU, or Aussie. Similar to the AUD, the New Zealand Dollar (ISO symbol: NZD) is one of the most traded currencies worldwide, which is again an interesting fact considering the quantity of goods and services exchange between New Zealand and the rest of the world. Another manner in which the NZD resembles the AUD is the impact of forex trading on currency strength. The other terms the NZD is also known by are NZ dollar, kiwi, or $NZ.

Most Traded Pairs

The most traded pairs are the two currencies against other major currencies, in particular against the USD, JPY, EUR, and GBP. Most liquidity of these two currencies and their most common pairs is generated from trading. Compared to the EUR/CHF cross, which is influenced by the goods and services (money) exchange between Europe and Switzerland, the liquidity in AUD and NZD pairs is an important difference. Currency pairs such as AUD/CAD or NZD/CHF involve very few trades of goods and services, so the money exchange mostly comes from traders, who are also not so great in numbers when it comes to these crosses.

Whenever liquidity is low, traders are faced with wide spreads and increased volatility especially with regard to news events. News announcements greatly impact the currency market’s trades of NZD and AUD, which is why crosses such as AUD/CHF and NZD/CHF are considered dangerous around the time any news comes out. Therefore, the most important question in terms of trading these two currencies is liquidity, which is why professional traders mostly focus on the crosses including the USD, JPY, EUR, and GBP.

Central Banks

Before the establishment of Australia’s central bank, the Reserve Bank of Australia (RBA), in 1960, the country relied on the Commonwealth Bank of Australia to issue the currency for the country. This task was moved away from the private bank into the government, which is responsible for the monetary policy at present. The RBA numbers nine employees who are all appointed by the government. The current Chair of the RBA is Mr. Philip Lowe, who took over the position from Mr. Glenn Stevens in 2016. The RBA holds 11 meetings per year on the first Tuesday of the month (all except January) when traders can expect announcements will be issued. The bank has a trifold mandate, with the stability of the currency, i.e. price stability and fighting inflation, being their primary goal. Their second aim is to maintain employment across the country, whereas the last one is the economic prosperity and welfare of people in Australia.

Unlike the ECB, whose mandate is more singular (inflation), the mandate of the RBA is quite wide. This comprehensive list of goals and tasks enables them to be rather flexible with regard to monetary policy. Australia and New Zealand are generally likely to show similarities in terms of economic policy. New Zealand’s central bank, the Reserve Bank of New Zealand (RBNZ), was established in 1934. The RBNZ comprises 10 members/governors who meet eight times a year. As of 2016, Professor Neil Quigley has been working at the position of Chair of the bank. The bank has a single mandate – price stability, yet unlike the ECB, the RBNZ seems to be more flexible. 

Economies

Australia, the 10th largest economy in the world, is strong in mining and agriculture, which make more than half of the country’s exports. Australia is a major commodities (iron, gold, etc.) exporter to Asian countries. Australia’s largest trading partner is China, which is an important fact for the currency market traders. The Chinese yuan (CNY) is, like the Indian rupee (INR), not allowed outside the country, which is why Australia and New Zealand are the means to get to this currency. This is why there is so much volume in these currencies despite the fact that they are not the largest economies in the world. Traders interested in the AUD are always advised to think of the strength of mining in Australia, commodity prices, and China. New Zealand’s economy is slightly behind Australia, ranked 16th in the world. Their economy is mostly focused on agriculture, which is why the country largely exports food and textile. New Zealand’s largest trading partner is China as well.

Economic Reports

The reports traders should focus on are rather similar to those of the United States: quarterly GDP reports, monthly Employment Report, Retail Sales, and Producer and Consumer Price Index (CPI and PPI) for both the AUD and the NZD, including Westpac Consumer Sentiment for New Zealand. 

The AUD/SPX Correlation

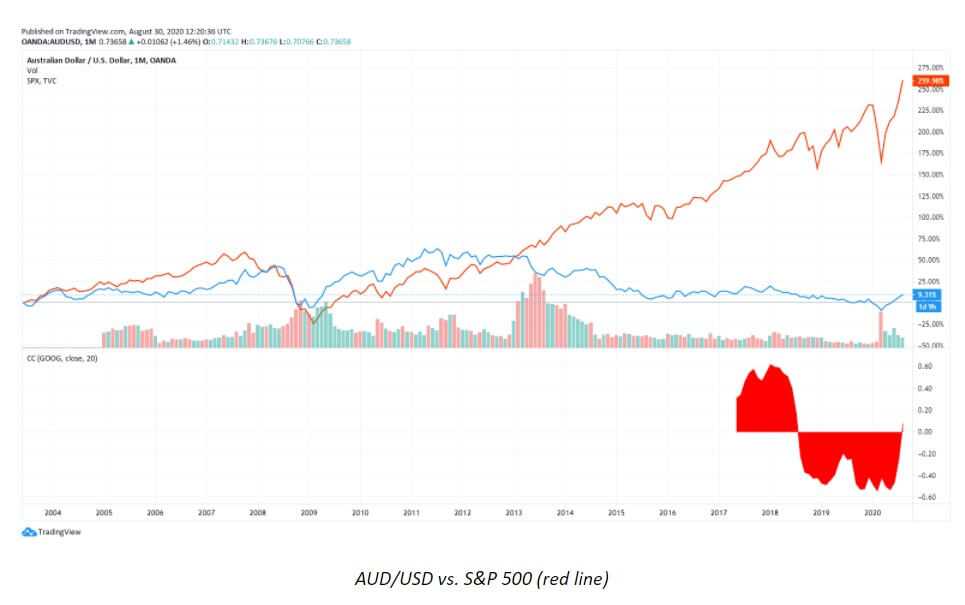
Australia is not the biggest economy, but the AUD is used extensively in the currency market as a proxy for growth. If economies are growing, there will be a demand for natural resources, causing the Australian exports to be strong and the country’s relationship with China, as one of the greatest economies in the world, comes into place here as well. Some of the greatest correlations we can see are found between the AUD and the USD as well as AUD and the S&P 500. Since the AUD is perceived as a proxy for growth, if traders assume that economies are going to grow, this will be bullish for the equities market and the currencies such as the AUD. As we can see from the chart below, the nature of this correlation has changed, but it is still quite high, exceeding 50%. Correlations can in general vary in strength during different periods; however, the AUD/SPX correlation can allow traders to draw some conclusions and expect changes in the prices of the AUD should the price of equities increase.
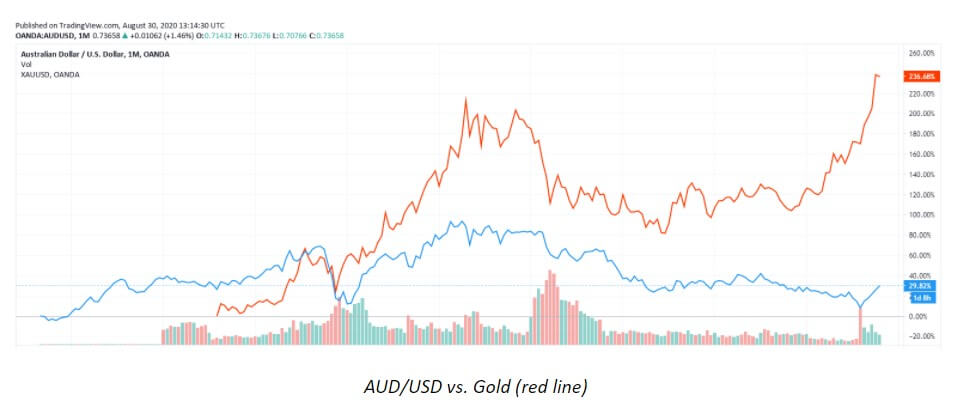
Another important AUD/USD correlation concern is gold, which has historically been one of the most prominent correlations. Therefore, the increase in the price of gold has traditionally been bullish for the AUD. Any decrease in the price of gold is then bearish for the AUD.
With regard to the NZD, one of the strongest correlations exist between the AUD and the NZD, which is why many young traders make the mistake of going short on one and long on the other. Although the two tend to move in different directions at times, these currencies are still highly correlated. Therefore, due to their strong correlation, the insight into what is happening with the NZD should provide information on what is happening with the AUD and vice versa. 
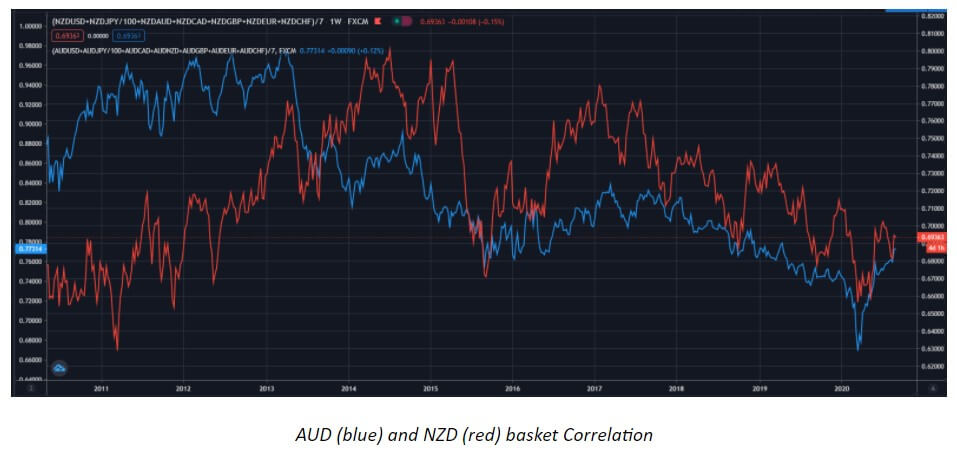
Owing to the similarities described above, if equities prices start to move up, this change will likely be bullish both for the AUD and the NZD. Should you come to the conclusion that a change in the price of gold is going to be bearish for the price of the AUD, the same conclusion can be applied to the NZD as well. 

Trading the NZD and the AUD

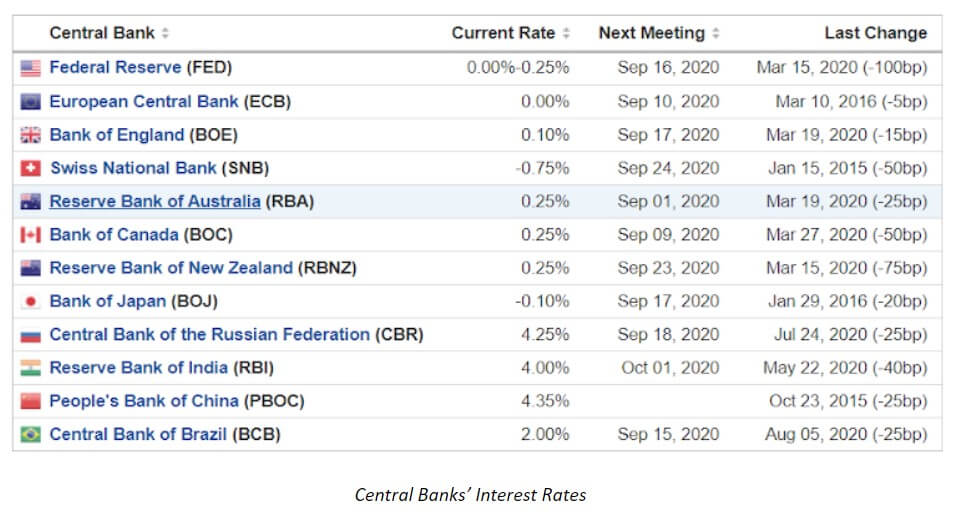
Both currencies require traders to take liquidity, proper selection of crosses, and avoiding news events into consideration. Currency pairs such as GBP/NZD can be great for traders, but they tend to get really volatile around the news announcements, leading to unpredictable moves and wide spreads. It is also important to remember that both New Zealand and Australian economies are focused on commodities and Asian countries. Concerning interest rates, both Australia and New Zealand keep their rates at 0.25%, which places them right in the middle among all major currencies’ central banks. Inflation in both countries tends to vary according to CPI and PPI reports. The two countries typically do not have any challenges with the trade deficit, as they are large exporters that typically carry a surplus. What is more, as these two currencies are tightly connected with global growth, commodity prices are important factors that determine what is happening to the AUD and the NZD. 
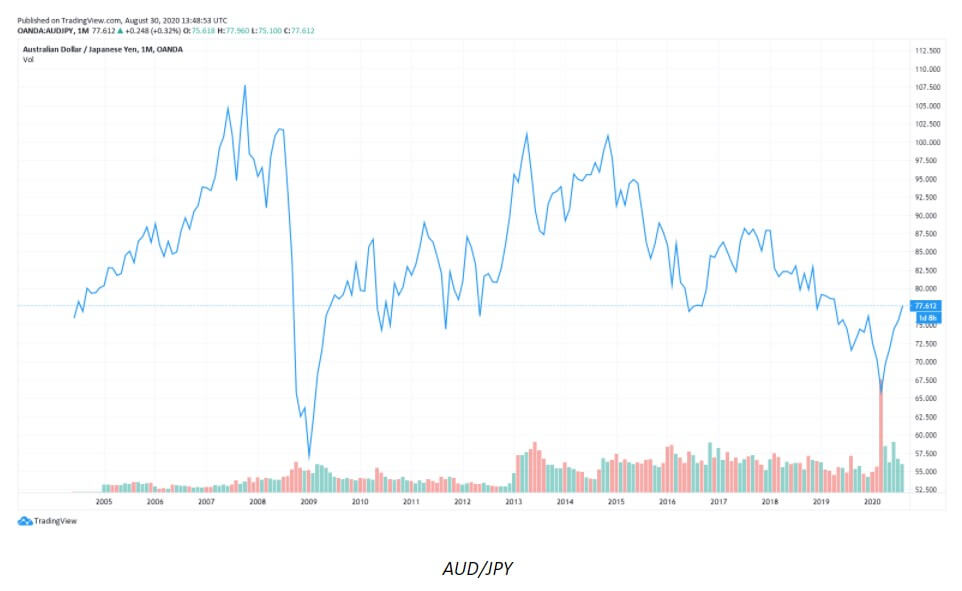
As a proxy for global growth, the NZD and AUD pairs will reflect any global panic. The 2008 AUD/JPY chart below reflects a large drop (a 50% loss) in the midst of the crisis that was affecting the entire world. Traders use these currencies to trade growth as well as to short and sell when there is a recession.
Recent Market Activity

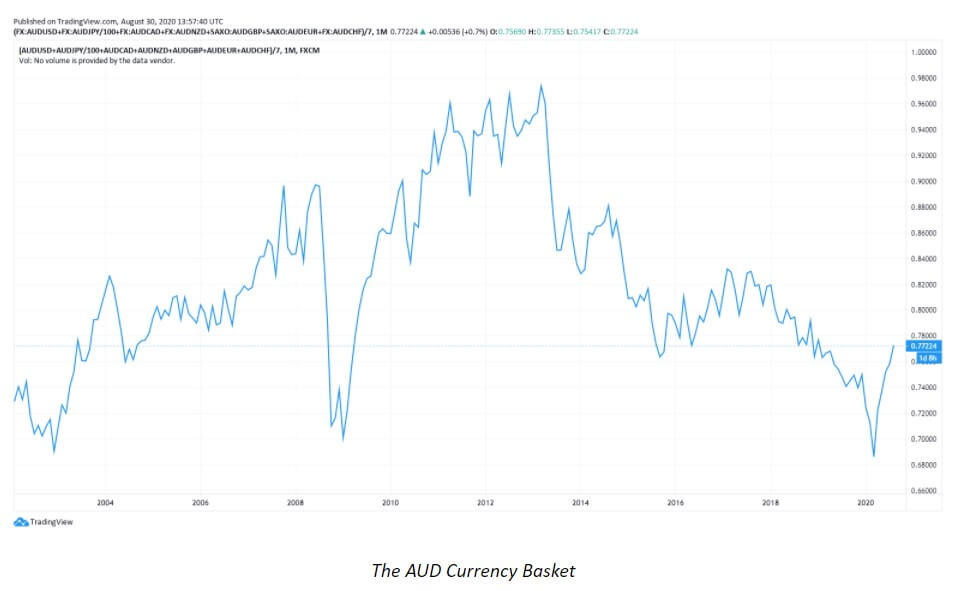
The AUD has been quite resilient lately with the price action slowly building up towards the end of the chart. While the chart did give a few breakouts in several places, they would simply fall. What is more, as we can see from the chart below, the past three months the price has been consolidating and this consolidation is likely to break out sometime soon. However, the CAD for example has shown how the breakdown itself is not as relevant, since the price of the Canadian dollar did break down for it to go up the very next day. The near future of the AUD may reveal similar tendencies, with the price either going straight up and growing even more or, on the other hand, going up and then pulling back in the opposite direction.

The longer the consolidation, the more difficult for the trader to assess the chart’s future movement as much resistance has been building up. Likewise, the shorter distances do allow the price to break out more easily, and the break-out and pull-back tendencies are generally much more often in such cases. The chart below shows how the currency has been doing well lately in 2020 from the technical point of view, with its strength supported by the equities and gold markets experiencing all-time highs, strong risk-on sentiments, and a weak USD. The end of the August 2020 chart reveals how the current trend should be bullish, but it is not, so it is a sign that something is wrong at the moment and that the currency should be handled with care. 
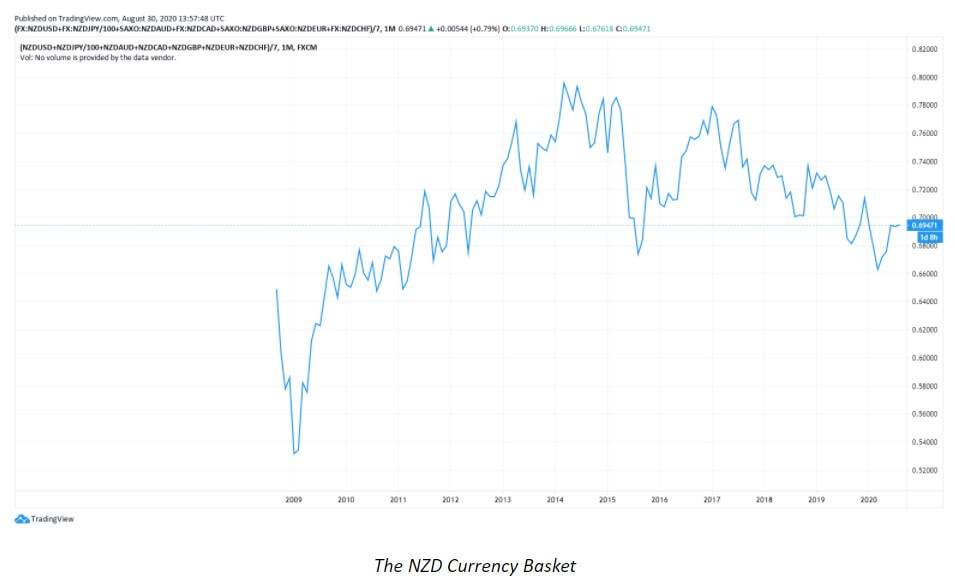
As the chart below reveals, the volatility seems to be on the low when it comes to the NZD lately. Compared to March, for example, the volatility level is much lower now. The NZD lost its momentum going upwards and in August 2020 started moving steadily in the opposite direction. The big move down may easily reach the bottom end, i.e. the support line, which would require a change in the overall outlook on behalf of traders.
Traders have been able to see some divergence with the AUD/NZD pair in the last few weeks. If traders are thinking of whether to go short on one or the other currency, the NZD is currently a much better pick. The AUD and the NZD are similar, but if they break the level they have been approaching for a while now, traders might be able to witness a more significant divergence happening. Should traders encounter a slowdown, the AUD may turn out to be a better choice after all. Owing to the current progressions, traders are advised to pay close attention to this currency pair in the time coming.
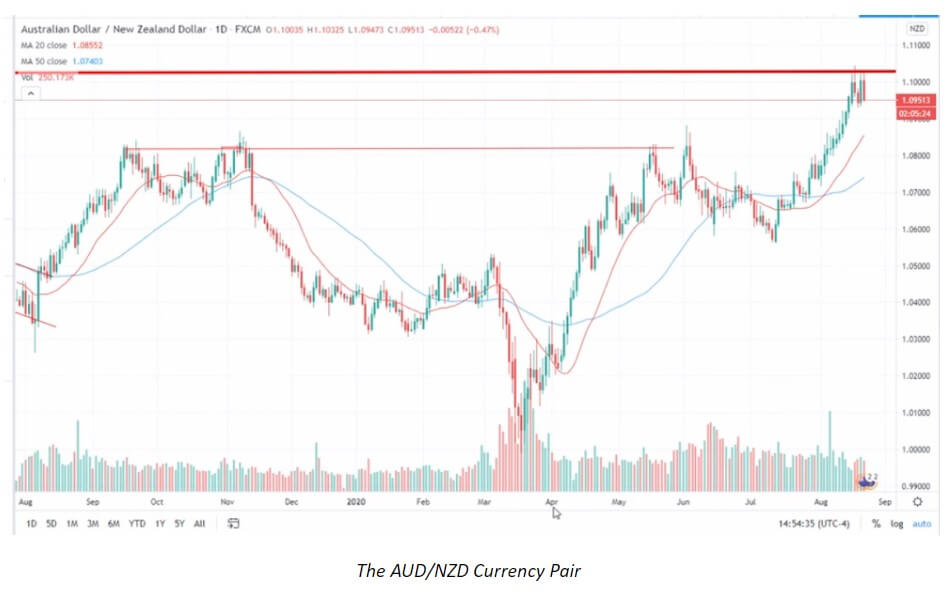
So, what does the future hold for these two currencies? It’s tough to know, the same as with any currency pair, as there are simply too many factors that determine how the market moves. What we can say with certainty is that at this time the pair is delivering some excellent trade opportunities if you only know where to look.


Categories
Forex Fundamental Analysis

GBP/NZD Global Macro Analysis – Part 1 & 2

Introduction

In this analysis, we will analyze endogenous factors that influence both the UK and New Zealand economies. The analysis will also include exogenous factors that impact the exchange rate between the GBP and the NZD.

Ranking Scale

We’ll rank the endogenous and exogenous factors on a scale from -10 to +10.

The score of the endogenous factors will be determined from correlation analysis between the GDP growth rate. If the score is negative, the endogenous factor had a devaluing effect on the domestic currency. Conversely, if the score is positive, the factor led to the appreciation of the domestic currency.

Similarly, we’ll do a correlation analysis between the exogenous factors and the GBP/NZD exchange rate. If the correlation is negative, the factor results in a drop in the exchange rate. If positive, then the exogenous factor increases the exchange rate.

Summary – GBP Endogenous Analysis

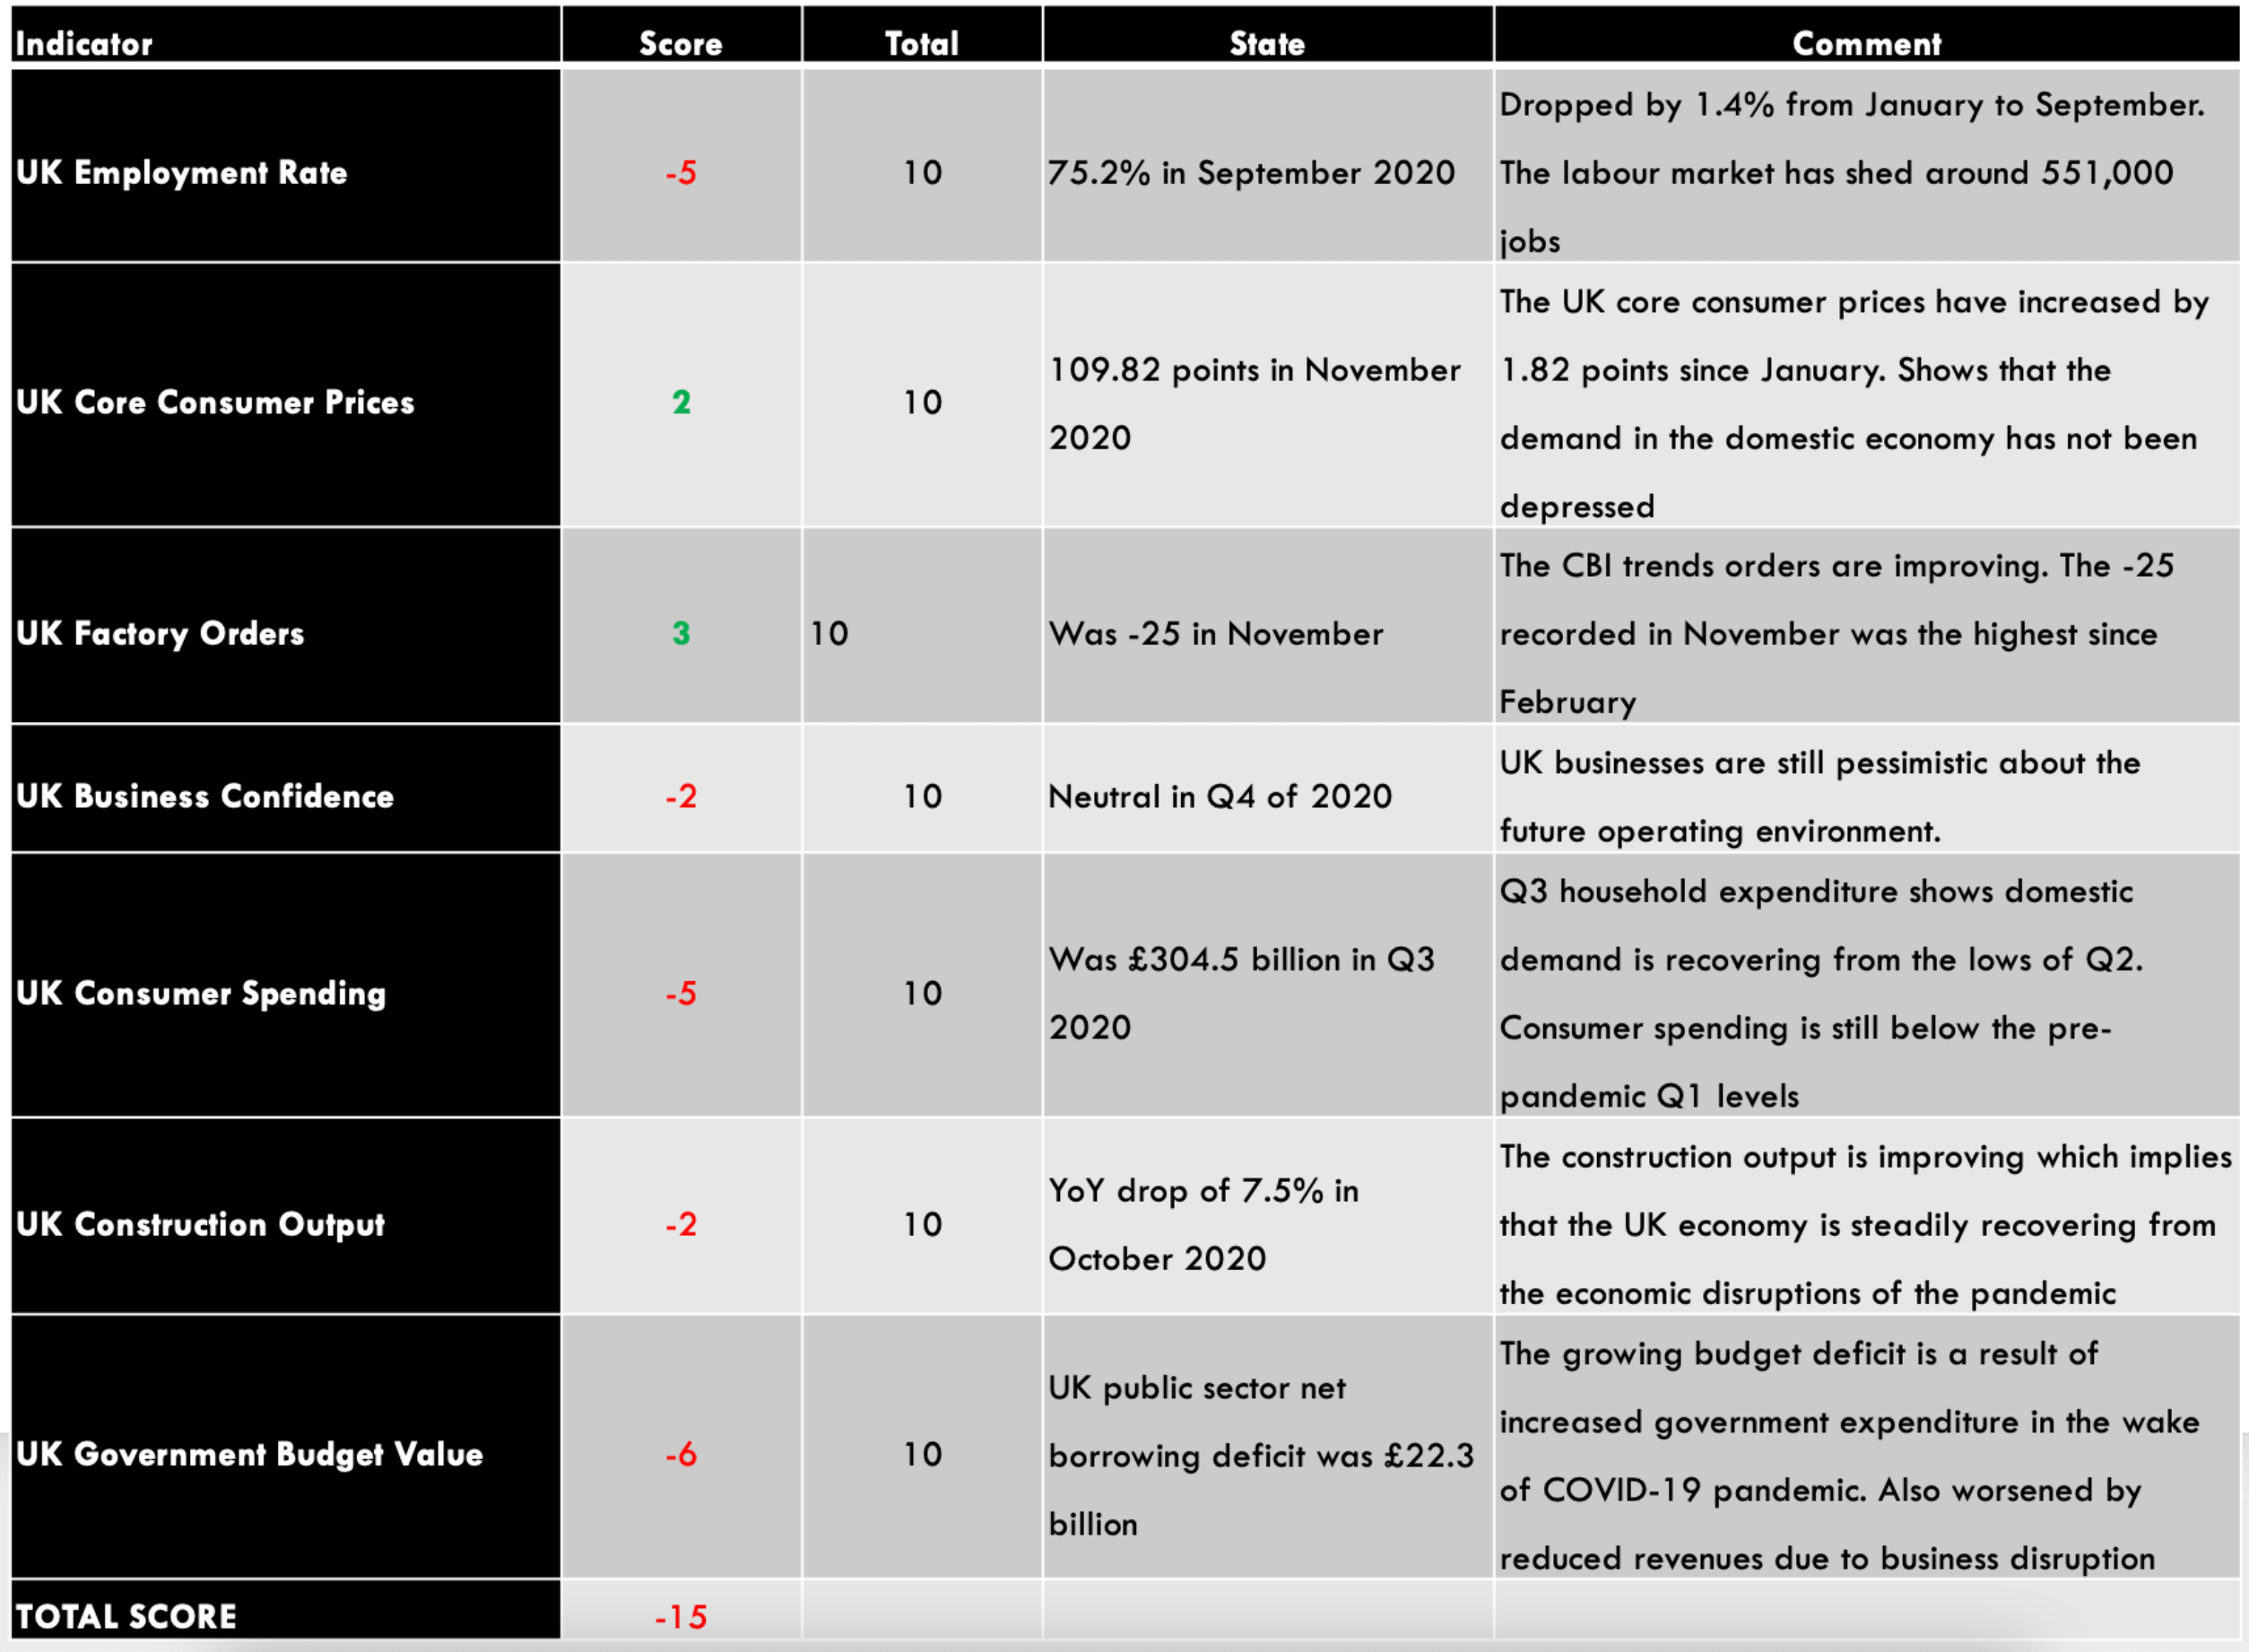
-15 score on Pound’s Endogenous Analysis indicates that this currency has depreciated since the beginning of 2020.

Summary – NZD Endogenous Analysis

A positive 5 indicates that the New Zealand dollar has appreciated since the beginning of this year.

Indicator Score Total State Comment
New Zealand Employment Rate -7 10 66.4% in Q3 2020 The NZ labor market is yet to recover from the economic disruptions of the pandemic
New Zealand Core Consumer Prices 1 10 1054 points in Q3 2020 From Q1 to Q3, inflation has increased by 1 point
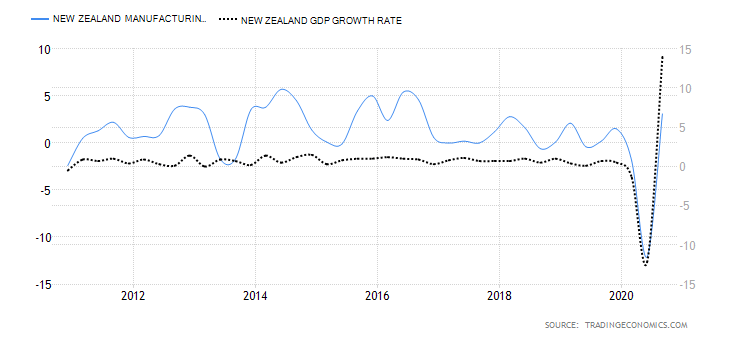
New Zealand Industrial Production 5 10 A 3.1% increase in Q3 The NZ industrial sector is rebounding from a 12.1% drop in Q2.
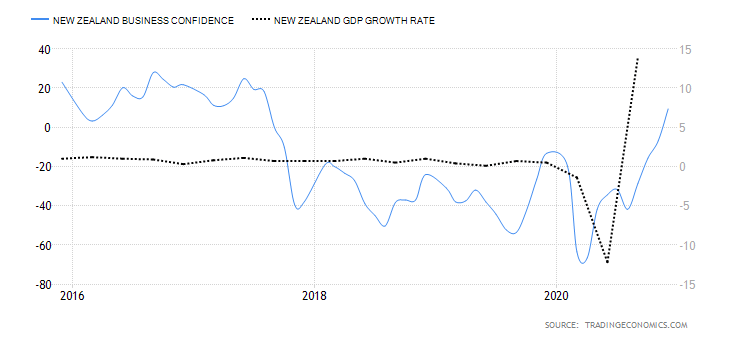
New Zealand Business Confidence 7 10 Was 9.4 in November November showed the first positive reading in ANZ business confidence since August 2018
New Zealand Consumer Spending 5 10 Q3 spending was 41.335 billion NZD. Q3 consumer spending was the highest recorded in 2020. This shows that the domestic demand has recovered beyond the pre-pandemic period
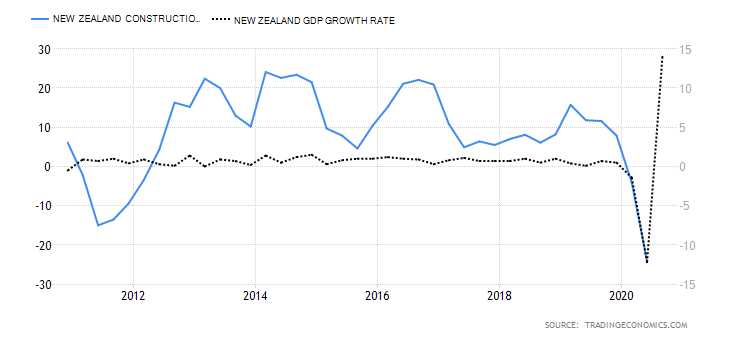
New Zealand Construction Output -4 10 Q2 output dropped by 24.2% The worst decline in construction output in about 18 years. It’s bound to increase as COVID-19 restrictions ease
New Zealand Government Budget Value -2 10 2020 projected deficit of 4.5 billion NZD This would be a drop from a surplus of 7.5 billion NZD in 2019. Attributed to the increase in government spending during the pandemic
TOTAL SCORE 5
  1. New Zealand Employment Rate

The employment rate shows the growth in New Zealand’s labor market. The change in the labor market shows how the economy is performing – especially in the coronavirus pandemic. The labor market shows if the economy is churning out new jobs or if jobs are lost. Thus, the growth of the labor market is a leading indicator of economic growth.

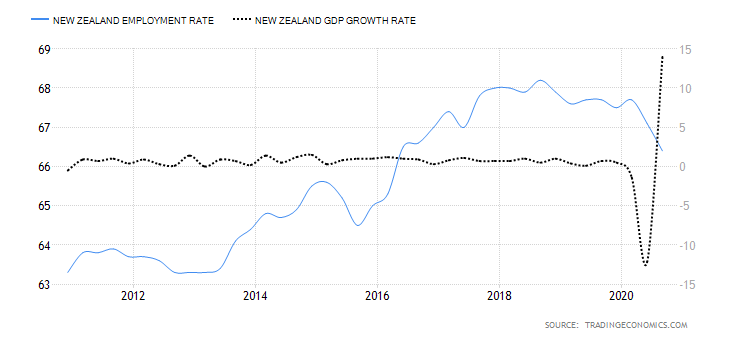
In Q3 2020, New Zealand’s employment rate dropped to 66.4% from 67.1% in Q2 and 67.7% in Q1. This shows that the labor market is yet to recover from the economic shocks of the pandemic. The New Zealand employment rate has a score of -7.

  1. New Zealand Core Consumer Prices

This indicator samples the price changes in a basket of the most commonly purchased goods and services by households. The price changes represent the rate of inflation in the overall economy. Note that the computation of the core consumer prices excludes goods and services whose prices tend to be volatile. It helps avoid seasonal distortions in the index.

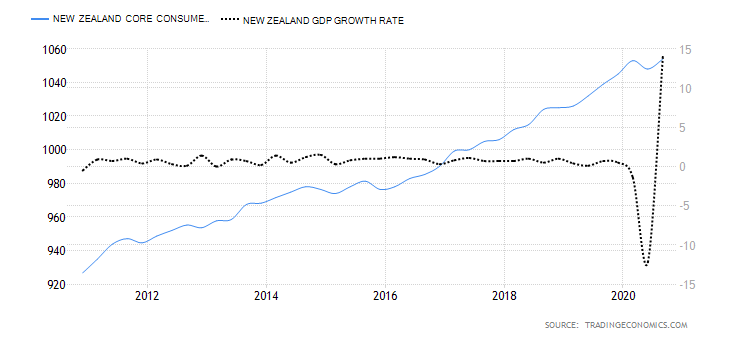
In Q3 of 2020, the core consumer prices in New Zealand rose to 1054 points from 1048 in Q2. The index had only increased by 1 point in 2020. Thus, we assign a score of 1.

  1. New Zealand Industrial Production

Industrial production in New Zealand refers to the YoY change in total manufacturing sales. It measures the YoY change in sales volume in the manufacturing sector. A survey of 13 industries across the manufacturing sector is surveyed to derive the YoY manufacturing sales data for the whole sector. Some of these industries include; petroleum and coal products, metal products, machinery, equipment and furniture, and food and beverage. Naturally, expansion in industrial production corresponds to the expansion of the economy.

New Zealand manufacturing sales rose by 3.1% in Q3 2020 from a drop of 12.1%. This is the largest YoY increase in manufacturing sales in three years. It shows that the economy is rebounding. We assign a score of 5.

  1. New Zealand Business Confidence

NZ business confidence is a survey of about 700 businesses. They are polled to establish their expectations about the future business operating environment and economic growth in general. Some aspects surveyed include; activity outlook, employment prospects, capacity utilization, and investment decisions.

In December 2020, the NZ ANZ business confidence rose to 9.4 from -6.9 in November. This shows an increased optimism in NZ businesses since it is the first positive reading since August 2018. Thus, we assign a score of 7.

  1. New Zealand Consumer Spending

This measures the value of the quarterly consumer expenditure in NZ. Changes in consumer expenditure go hand in hand with domestic demand changes in the economy, which drive GDP growth.

In Q3 2020, the NZ consumer spending increased to NZD 41.335 billion from NZD 35.197 billion in Q2. More so, the Q3 consumer spending is more than the NZD 40.04 billion recorded in Q1. Consequently, the NZ consumer spending has a score of 5.

  1. New Zealand Construction Output

This indicator shows the overall change in the value of all construction work done by contractors in NZ. It compares the YoY quarterly change, which helps to show if the economy is expanding or contracting.

In Q2 2020, the NZ construction output dropped by 24.2% compared to the 4.1% drop in Q2. This is the worst drop in over 18 years. Thus, we assign a score of -4.

  1. New Zealand Government Budget Value

This is the difference between the revenues that the NZ government collects and the amount it spends. Deficits arise if the revenues are less than expenditures, while surplus occurs when the revenues exceed expenditure.

In 2019, the NZ government had a budget surplus of NZD 7.5 billion. In 2020, it was projected that the budget would hit a deficit of NZD 4.5 billion. This is due to increased government expenditure to alleviate the pandemic’s economic shocks while revenues have been depressed due to nationwide shutdowns. Thus, we assign a score of -2.

For the exogenous analysis of both of these currencies, you can check our very next article. In case of any queries, let us know in the comments below. Cheers.

Categories
Forex Assets

Trading The NZD/HKD Forex Exotic Currency Pair

Introduction

NZD represents the official currency of New Zealand, while HKD is the official currency of Hong Kong. It is an exotic-cross currency pair where NZD is the base currency, and HKD the quote currency. The price of NZDHKD determines the value of HKD, which is equivalent to one NZD. In other words, this pair represents 1 NZD per X HKD. For example, if the pair is trading at 5.14452, we would need about 5.1 HKD to purchase one NZD.

NZD/HKD Specification

Spread

To get the Spread value, we just have to subtract the Bid price from the Ask price. The value of the spread is set by a broker. However, the amount in pips depends on the type of execution model used for executing the trades.

Spread on ECN: 31 pips | Spread on STP: 35 pips

Fees

Like other financial markets, Forex has some fees that a trader needs to pay while they take a trade. Note that the broker does not take any fee on STP accounts, but a few fees are charged on ECN model accounts.

Slippage

The slippage is a set of pips formed by the difference between the demanded price by the trader and the execution price by the broker. The main reason for the occurrence of slippage is market volatility or the broker’s execution speed.

Trading Range in NZD/HKD

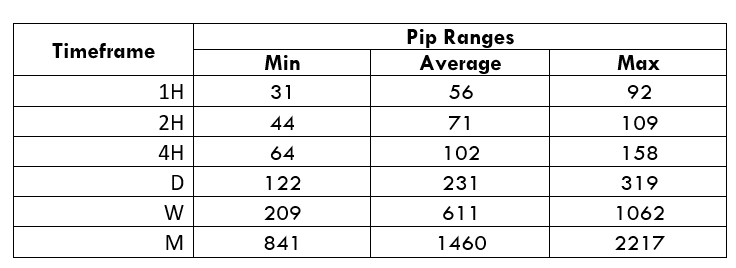
Procedure to assess Pip Ranges

  1. Add the ATR indicator to your chart
  2. Set the period to 1
  3. Add a 200-period SMA to this indicator
  4. Shrink the chart so you can assess a large time period
  5. Select your desired timeframe
  6. Measure the floor level and set this value as the min
  7. Measure the level of the 200-period SMA and set this as the average
  8. Measure the peak levels and set this as Max.

NZD/HKD Cost as a Percent of the Trading Range

The volatility values from the above table show how the cost varies with the change in volatility. The ratio between total cost and the volatility values reconverted into percentages to have a better outlook.

ECN Model Account 

Spread = 31 | Slippage = 5 | Trading fee = 8

Total cost = Spread + Slippage + Trading Fee

= 31 + 5 + 8

Total cost = 44

STP Model Account

Spread = 35 | Slippage = 1 | Trading fee = 0

Total cost = Spread + Slippage + Trading Fee

= 35 + 1 + 0 = 36

The Ideal way to trade the NZD/HKD

The NZDHKD is a pair with high liquidity. Therefore, trading this exotic currency pair seems to be feasible. We can see from the above table that the highest Percentage of values are barely above 100%. It means this currency pair is relatively less expensive to trade.

The most significant costs are in the hourly timeframe only, as the costs in 2H, 4H, and daily timeframes are also low. However, every trader should avoid the volatile market condition. Therefore, the best way to trade this pair is to look out for the possibilities to be on lower timeframes also while sticking to the average volatile level.

Also, traders can reduce the trading costs further by eliminating market orders and placing orders as ‘limit’ and ‘stop.’ In this case, slippage can completely be avoided. Please go through the below table to further understand this.

STP Model Account (Using Limit Orders)

Spread = 31 | Slippage = 0 | Trading fee = 0

Total cost = Spread + Slippage + Trading Fee

= 31 + 0 + 0 = 31 

Categories
Forex Assets

Asset Analysis – Trading The NZD/QAR Forex Exotic Pair

Introduction

NZD is the authorized currency of New Zealand, while the QAR (Qatari Rial) is the official currency of Qatar. The combination of these two currencies forms the NZDQAR exotic pair. As a trader, we aim to identify the possible movement in this pair by an appropriate analysis method and make money from the differential.

Understanding NZD/QAR

In every currency pair, the first currency is known as the base currency, and the second currency is known as the quote currency. We can quote it as 1 NZD per X numbers of QAR. For example, if the NZDQAR pair’s value is at 2.4460; therefore, we need almost 2.4460 QAR to buy one NZD.

NZD/QAR Specification

Spread

The bid price is the price level that buyers are willing to pay when they buy an instrument. Similarly, ask price is the lowest price that a seller is willing to pay when they sell a currency pair. The difference between these prices is known as Spread. This value changes with the change of the execution model.

Spread on ECN: 12 pips | Spread on STP: 17 pips

Fees

The fee or commission in Forex is similar to the one that is pair to stockbrokers where it is automatically deducted from traders’ accounts when they take a trade. However, an STP account does not take any fees but a few pips on ECN accounts.

Slippage

There is some market condition when we enter a buy or sell trade, but the trade opens some pips higher or lower, known as Slippage. The Slippage might happen when the market is volatile.

Trading Range in NZD/QAR

Procedure to assess Pip Ranges

  1. Add the ATR indicator to your chart
  2. Set the period to 1
  3. Add a 200-period SMA to this indicator
  4. Shrink the chart so you can assess a large time period
  5. Select your desired timeframe
  6. Measure the floor level and set this value as the min
  7. Measure the level of the 200-period SMA and set this as the average
  8. Measure the peak levels and set this as Max.

NZDQAR Cost as a Percent of the Trading Range

With the volatility values obtained from the above table, we can see how the cost varies as the volatility of the market varies. All we did is, got the ratio between the total cost and the volatility values and converted into percentages.

ECN Model Account 

Spread = 12 | Slippage = 5 | Trading fee = 8

Total cost = Spread + Slippage + Trading Fee

= 12 + 5 + 8 = 25

STP Model Account

Spread = 17 | Slippage = 5 | Trading fee = 0

Total cost = Spread + Slippage + Trading Fee

= 17 + 5 + 0 = 22

The Ideal way to trade the NZD/QAR

The NZD/QAR is a currency pair that has a lot of volatility and liquidity. Therefore, it is easier for a trader to trade this exotic-cross currency. If we analyze the table mentioned above, we can say that the H1 timeframe has the highest cost as a percentage of the trading range at an average of 44.64%, where the average movement is almost 56 pips. The increase in volatility provides higher price fluctuation, but it is often risky for a trader as there is a possibility of unwanted stop loss hit and reverse back.

Moreover, in the monthly timeframe, the price of the NZD/QAR provides an excellent movement with a low cost of an average of 0.77% only. Therefore, if we trade this pair in a higher timeframe, we might reduce the risk of market volatility. We can also use limit orders in the place of market orders to further reduce the costs, as shown below.

STP Model Account (Using Limit Orders)

Spread = 12 | Slippage = 0 | Trading fee = 0

Total cost = Spread + Slippage + Trading Fee

= 12 + 0 + 0 = 12