Introduction
NZD is the authorized currency of New Zealand, while the QAR (Qatari Rial) is the official currency of Qatar. The combination of these two currencies forms the NZDQAR exotic pair. As a trader, we aim to identify the possible movement in this pair by an appropriate analysis method and make money from the differential.
Understanding NZD/QAR
In every currency pair, the first currency is known as the base currency, and the second currency is known as the quote currency. We can quote it as 1 NZD per X numbers of QAR. For example, if the NZDQAR pair’s value is at 2.4460; therefore, we need almost 2.4460 QAR to buy one NZD.
NZD/QAR Specification
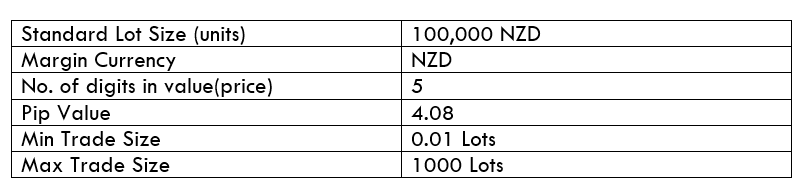
Spread
The bid price is the price level that buyers are willing to pay when they buy an instrument. Similarly, ask price is the lowest price that a seller is willing to pay when they sell a currency pair. The difference between these prices is known as Spread. This value changes with the change of the execution model.
Spread on ECN: 12 pips | Spread on STP: 17 pips
Fees
The fee or commission in Forex is similar to the one that is pair to stockbrokers where it is automatically deducted from traders’ accounts when they take a trade. However, an STP account does not take any fees but a few pips on ECN accounts.
Slippage
There is some market condition when we enter a buy or sell trade, but the trade opens some pips higher or lower, known as Slippage. The Slippage might happen when the market is volatile.
Trading Range in NZD/QAR
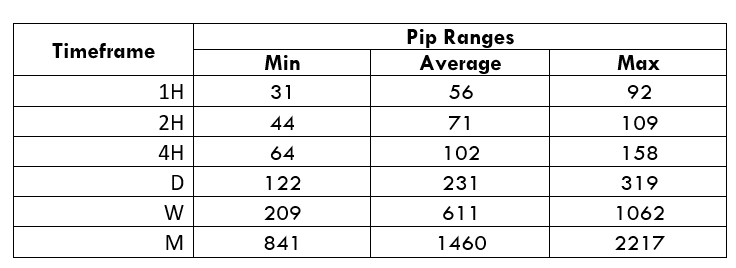
Procedure to assess Pip Ranges
- Add the ATR indicator to your chart
- Set the period to 1
- Add a 200-period SMA to this indicator
- Shrink the chart so you can assess a large time period
- Select your desired timeframe
- Measure the floor level and set this value as the min
- Measure the level of the 200-period SMA and set this as the average
- Measure the peak levels and set this as Max.
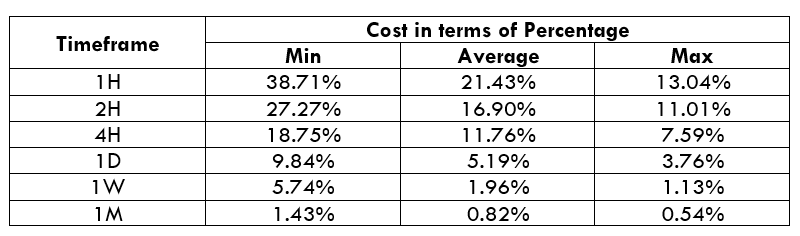
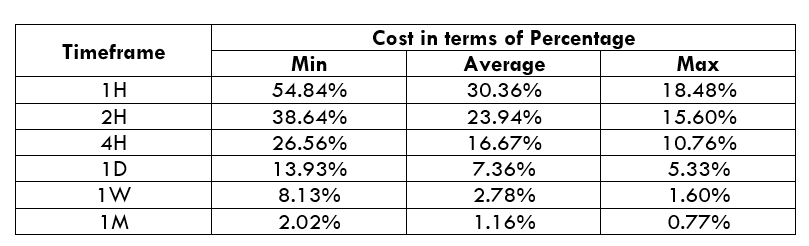
NZDQAR Cost as a Percent of the Trading Range
With the volatility values obtained from the above table, we can see how the cost varies as the volatility of the market varies. All we did is, got the ratio between the total cost and the volatility values and converted into percentages.
ECN Model Account
Spread = 12 | Slippage = 5 | Trading fee = 8
Total cost = Spread + Slippage + Trading Fee
= 12 + 5 + 8 = 25

STP Model Account
Spread = 17 | Slippage = 5 | Trading fee = 0
Total cost = Spread + Slippage + Trading Fee
= 17 + 5 + 0 = 22
The Ideal way to trade the NZD/QAR
The NZD/QAR is a currency pair that has a lot of volatility and liquidity. Therefore, it is easier for a trader to trade this exotic-cross currency. If we analyze the table mentioned above, we can say that the H1 timeframe has the highest cost as a percentage of the trading range at an average of 44.64%, where the average movement is almost 56 pips. The increase in volatility provides higher price fluctuation, but it is often risky for a trader as there is a possibility of unwanted stop loss hit and reverse back.
Moreover, in the monthly timeframe, the price of the NZD/QAR provides an excellent movement with a low cost of an average of 0.77% only. Therefore, if we trade this pair in a higher timeframe, we might reduce the risk of market volatility. We can also use limit orders in the place of market orders to further reduce the costs, as shown below.
STP Model Account (Using Limit Orders)
Spread = 12 | Slippage = 0 | Trading fee = 0
Total cost = Spread + Slippage + Trading Fee
= 12 + 0 + 0 = 12