
Introduction
GBP Pound sterling, also known as the pound, is the official currency of the United Kingdom and many others. The sterling is the fourth most-traded currency in the Forex market. On the other hand, TRY is known as the Turkish lira. It is the official currency of Turkey and the self-declared Turkish Republic of Northern Cyprus.
GBP/TRY
Currency pairs are the national currencies from two countries coupled for being exchanged in reference to each other. In the Forex, one currency is quoted against the other. GBP/TRY is the abbreviation for the Pound sterling against The Turkish lira. In this case, the first currency(GBP) is the base currency, and the second(TRY) is the quote currency. The GBP/TRY is classified as an exotic-cross currency pair.
Understanding GBP/TRY
In the Forex market, to find out the relative value of one currency, we need another currency to compare. The market value of GBPTRY determines the strength of TRY against the GBP that can be easily understood as 1GBP is equal to how much lira(TRY), so if the exchange rate for the pair GBPTRY is 8.0877. It means in to order to buy 1GBP we need 8.0877 TRY
If the value of the base currency goes down, the value of the quote currency goes up and vice versa.

Spread
The broker provides us with two prices, Ask price and Bid price. Here, the Bid price is the buy price, and the Ask price is the Sell price. The difference between the ask and the bid price is called the spread. The spread is how brokers make their money.
ECN: 61 pips | STP: 64 pips
Fees
A Fee is simply the commission we pay to the broker each time we execute a position. There is no fee on STP account models, but a few pips on ECN accounts.
Slippage
Slippage refers to the difference between the trader’s expected price and the actual price at which the trade is executed. It can occur at any time but mostly happens when the market is fast-moving and volatile. Also, sometimes when we place a large number of orders at the same time.
Trading Range in GBP/TRY
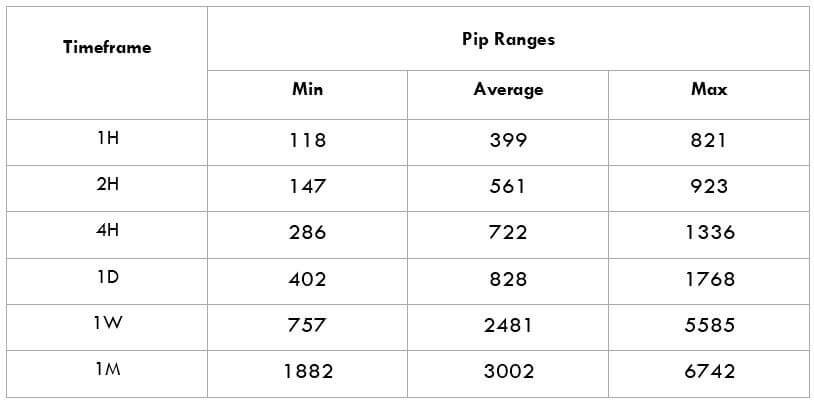
The amount of money you will win or lose in a given amount of time can be assessed using the trading range table. It is a representation of the minimum, average, and maximum pip movement in a currency pair. This can be evaluated simply by using the ATR indicator combined with 200-period SMA.
Procedure to assess Pip Ranges
- Add the ATR indicator to your chart
- Set the period to 1
- Add a 200-period SMA to this indicator
- Shrink the chart so you can assess a significant period
- Select your desired timeframe
- Measure the floor level and set this value as the min
- Measure the level of the 200-period SMA and set this as the average
- Measure the peak levels and set this as Max.
GBP/TRY Cost as a Percent of the Trading Range
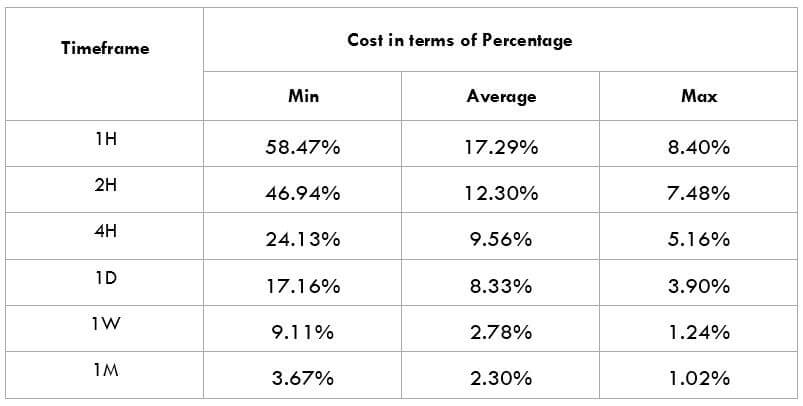
The cost of trade mostly depends on the broker and varies based on the volatility of the market. This is because the total cost involves slippage and spreads apart from the trading fee. Below is the representation of the cost variation in terms of percentages. The comprehension of it is discussed in the following sections.
ECN Model Account
Spread = 61 | Slippage = 3 |Trading fee = 5
Total cost = Slippage + Spread + Trading Fee = 3 + 61 + 5 = 69
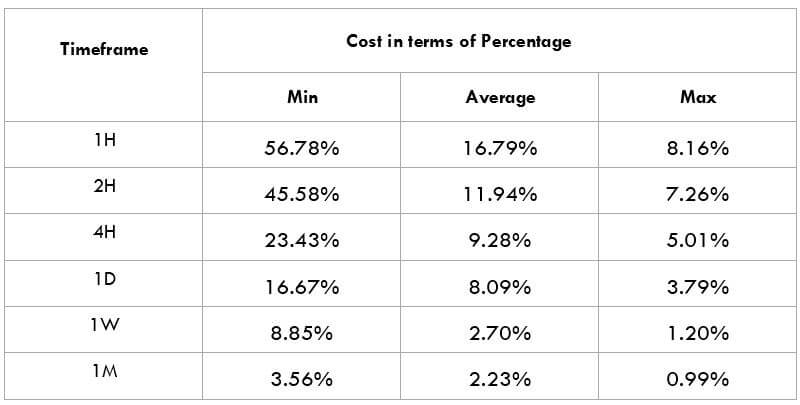
STP Model Account
Spread = 64 | Slippage = 3 | Trading fee = 0
Total cost = Slippage + Spread + Trading Fee = 3 + 64 + 0 = 67
Trading the GBP/TRY
From the trading range table, it can clearly be ascertained that this pair is very volatile. For example, the pip average pip movement in the 1H timeframe is as high as 400 pips. This also means that the risk is high from the 1H timeframe all the way to the 1M timeframe.
As far as the costs are concerned, it is in favor of the traders. This is because the greater the volatility, the lower are the costs. That is the reason the percentage values are large in the min column and comparatively smaller in the average and max columns.
With this in mind, one can opt to trade this pair when the volatility values are between the minimum and average. In doing so, the volatility will be comparatively lower, which in turn reduces the risk on the trade and also keeps the cost in balance with the volatility.