Categories
Crypto Videos

Turkey Are Already Pilot Testing There CBDC In Mid 2021!


Turkey Announces CBDC Pilot Tests Planned for Mid-2021

Turkey’s Parliament central bank governor Naci Agbal updated the public on the development of its central bank digital currency (CBDC for short), revealing that the “conceptual” research had been completed and that the public can expect practical tests for such a currency in the latter half of 2021. This announcement came at a time where Turkey struggles with soaring consumer prices and an inflation rate currently in the double digits.

“There is a research & development project initiated on digital money,” said Agbal, according to two local news outlets. “Currently, the conceptual phase of the project has been completed. We aim to start the pilot tests in the second half of the next year.”


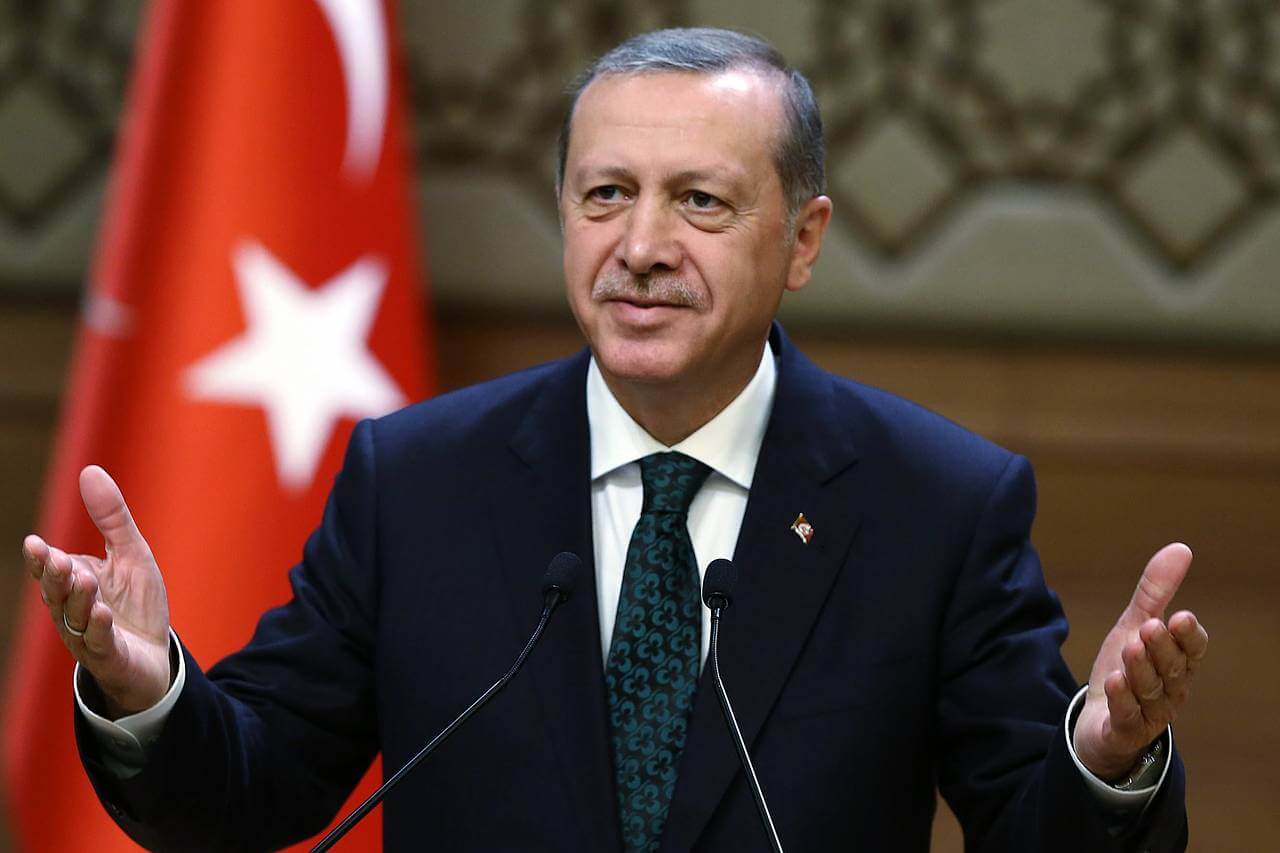
While this announcement came as a surprise to those that didn’t follow Turkey’s stance on CBDC’s in the past, the country was actually researching the possibility of implementing some form of a digital currency since mid-2019. In addition to that, a 2021 rollout of a digital Lira is not a new concept but rather an already expected but delayed scenario. Turkish president Recep Erdoğan announced in Nov 2019 that tests for a digital Lira would be complete by the end of 2020. The reason for the delays was most likely tied to Turkey changing its central bank head in Nov 2020.

The progress regarding digital Lira comes as the country’s central bank grapples with inflation being as high as 14%. In an official statement to reporters last week, Agbal – who got appointed as the central bank’s governor just last month — that the central bank is “determined” to reduce inflation and meet its year-end target of 9.4%. 


As we have stated before, Turkey is not new in the cryptocurrency sector. In fact, it is considered one of the most active countries in the world for cryptocurrency and digital transformation industry as a whole, with over 20% of its population holding some form of digital money. 

Categories
Forex Assets

Examining The Volatility Of CHF/TRY Forex Exotic Pair

Introduction

The abbreviation of CHF/TRY is Swiss Franc, paired with the Turkish Lira. In this pair, CHF is the official currency of Switzerland and is also the fifth highly traded currency in the Forex Exchange market. In contrast, TRY stands for the Turkish Lira, and it is the official currency of Turkey. This pair is classified as an exotic pair.

Understanding CHF/TRY

In the Foreign exchange market, to determine the relative value of one currency, we need an alternative currency to evaluate. Hence, when we are buying a currency (base) we are simultaneously selling one (the quote currency). The market value of CHF/TRY helps us to understand the power of TRY against the CHF. So, if the trade rate for the pair CHF/TRY is 7.1972, it means to buy 1 CHF, we need 7.1972 TRY.

CHF/TRY Specification

Spread

Spread is the distinction between the ask-bit price that is set at the exchanges. Below are the spread values of the CHF/TRY currency pair in both ECN & STP accounts. The spread charges for ECN and STP brokers for the CHF/TRY pair can be found below.

ECN: 35 pips | STP: 40 pips

Fees

For every position, a trader enters the stockbroker charges some fee for it. Traders must know that this fee is charged only on ECN accounts and not on STP accounts.

Slippage

Slippage is the price difference between the trader’s execution and at which the broker executed the price. The difference is because of the high market volatility and slow execution speed.

Trading Range in CHF/TRY

A trading range is the interpretation of the volatility in CHF/TRY in several timeframes. The values are obtained from the Average True Range indicator. One can use the table as a risk management tool to identify the profit/loss that a trader is possessed.

Below is a table indicating the minimum, average, and max volatility (pip movement) on various timeframes.

Procedure to assess Pip Ranges

  1. Add the ATR indicator to your chart
  2. Set the period to 1
  3. Add a 200-period SMA to this indicator
  4. Shrink the chart so you can assess a large time period
  5. Select your desired timeframe
  6. Measure the floor level and set this value as the min
  7. Measure the level of the 200-period SMA and set this as the average
  8. Measure the peak levels and set this as Max.

CHF/TRY Cost as a Percent of the Trading Range

The total cost of the trade fluctuates based on the volatility of the market. So, we must figure out the occasions when the costs are less to place ourselves in the market. Below is a table demonstrating the variant in the costs based on the change in the volatility of the market.

Note: The percentage rates represent the relative scale of costs and not the fixed costs on the trade.

ECN Model Account

Spread = 35 | Slippage = 5 | Trading fee = 8

Total cost = Slippage + Spread + Trading Fee = 5 + 35 + 8= 48

STP Model Account

Spread = 40 | Slippage = 5 | Trading fee = 0

Total cost = Slippage + Spread + Trading Fee = 5 + 40 + 0 = 45

The Ideal way to trade the CHF/TRY

Volatility and cost are the two components traders take into consideration for trading any security in the market. With the assistance of the above tables, let us evaluate these two factors to trade the CHF/TRY Forex pair.

As we can see, the pip variation is significantly high between the minimum volatility and the average volatility in each timeframe. As a day trader, our aim is to make income from the market’s pip movement. But, if there is hardly any movement in the price, it becomes tricky to make profits from the market. Thus, it is ideal to trade when the volatility is at the average value.

The cost of trade rises as the volatility decrease. They are inversely proportional. In other words, highly volatile markets have minimum costs. Though it is quite risky to trade markets with higher volatility, it can be considered by aggressive traders with optimal money management techniques in place as the costs are low. Hence, to retain a balance among the cost and volatility, traders may find trading occasions when the volatility is near the average values or a little above it.

Categories
Forex Assets

GBP/TRY – Knowing The Trading Costs Involved While Trading This Exotic pair

Introduction

GBP Pound sterling, also known as the pound, is the official currency of the United Kingdom and many others. The sterling is the fourth most-traded currency in the Forex market. On the other hand, TRY is known as the Turkish lira. It is the official currency of Turkey and the self-declared Turkish Republic of Northern Cyprus.

GBP/TRY

Currency pairs are the national currencies from two countries coupled for being exchanged in reference to each other. In the Forex, one currency is quoted against the other. GBP/TRY is the abbreviation for the Pound sterling against The Turkish lira. In this case, the first currency(GBP) is the base currency, and the second(TRY) is the quote currency. The GBP/TRY is classified as an exotic-cross currency pair.

Understanding GBP/TRY

In the Forex market, to find out the relative value of one currency, we need another currency to compare. The market value of GBPTRY determines the strength of TRY against the GBP that can be easily understood as 1GBP is equal to how much lira(TRY), so if the exchange rate for the pair GBPTRY is 8.0877. It means in to order to buy 1GBP we need 8.0877 TRY

If the value of the base currency goes down, the value of the quote currency goes up and vice versa.

Spread

The broker provides us with two prices, Ask price and Bid price. Here, the Bid price is the buy price, and the Ask price is the Sell price. The difference between the ask and the bid price is called the spread. The spread is how brokers make their money.

ECN: 61 pips | STP: 64 pips

Fees

A Fee is simply the commission we pay to the broker each time we execute a position. There is no fee on STP account models, but a few pips on ECN accounts.

Slippage

Slippage refers to the difference between the trader’s expected price and the actual price at which the trade is executed. It can occur at any time but mostly happens when the market is fast-moving and volatile. Also, sometimes when we place a large number of orders at the same time.

Trading Range in GBP/TRY

The amount of money you will win or lose in a given amount of time can be assessed using the trading range table. It is a representation of the minimum, average, and maximum pip movement in a currency pair. This can be evaluated simply by using the ATR indicator combined with 200-period SMA.

Procedure to assess Pip Ranges

  1. Add the ATR indicator to your chart
  2. Set the period to 1
  3. Add a 200-period SMA to this indicator
  4. Shrink the chart so you can assess a significant period
  5. Select your desired timeframe
  6. Measure the floor level and set this value as the min
  7. Measure the level of the 200-period SMA and set this as the average
  8. Measure the peak levels and set this as Max.

GBP/TRY Cost as a Percent of the Trading Range

The cost of trade mostly depends on the broker and varies based on the volatility of the market. This is because the total cost involves slippage and spreads apart from the trading fee. Below is the representation of the cost variation in terms of percentages. The comprehension of it is discussed in the following sections.

ECN Model Account

Spread = 61 | Slippage = 3 |Trading fee = 5

Total cost = Slippage + Spread + Trading Fee = 3 + 61 + 5 = 69


STP Model Account

Spread = 64 | Slippage = 3 | Trading fee = 0

Total cost = Slippage + Spread + Trading Fee = 3 + 64 + 0 = 67


Trading the GBP/TRY

From the trading range table, it can clearly be ascertained that this pair is very volatile. For example, the pip average pip movement in the 1H timeframe is as high as 400 pips. This also means that the risk is high from the 1H timeframe all the way to the 1M timeframe.

As far as the costs are concerned, it is in favor of the traders. This is because the greater the volatility, the lower are the costs. That is the reason the percentage values are large in the min column and comparatively smaller in the average and max columns.

With this in mind, one can opt to trade this pair when the volatility values are between the minimum and average. In doing so, the volatility will be comparatively lower, which in turn reduces the risk on the trade and also keeps the cost in balance with the volatility.

Categories
Forex Assets

Everything About EUR/TRY Forex Currency Pair

Introduction

EUR/TRY is the abbreviation for the Euro area’s euro against the Turkish Lira. This pair is classified as an exotic-cross currency pair. In this pair, EUR is the base currency, and TRY the quote currency.

Understanding EUR/TRY

The price of this pair determines the value of TRY, which is equivalent to one euro. It is quoted as 1 EUR per X TRY. For example, if the value of this pair is 6.5552, then about 6.5 Turkish Liras are required to purchase one euro.

EUR/TRY Specification

Spread

Spread is simply the difference between the bid price and the ask price in the market. This value is controlled by the brokers. This value varies on the type of execution model used for executing the trades.

Spread on ECN: 40 pips | Spread on STP: 44 pips

Fees

The fee in Forex is similar to the one that is pair to stockbrokers. Note that, there is no fee on STP accounts, but a few pips on ECN accounts.

Slippage

The slippage on a trade is the difference between the price that is demanded by the trader and the price that is actually executed by the broker. Market volatility and the broker’s execution speed are the reasons for slippage to occur.

Trading Range in EUR/TRY

A trading range is the representation of the minimum, average, and the maximum volatility of this pair on the 1H, 4H, 1D, 1W, and 1M timeframe. Using these values, we can assess our profit/loss margin of trade. Hence, this proves to be a helpful risk management tool for all types of traders.

Procedure to assess Pip Ranges

  1. Add the ATR indicator to your chart
  2. Set the period to 1
  3. Add a 200-period SMA to this indicator
  4. Shrink the chart so you can assess a large time period
  5. Select your desired timeframe
  6. Measure the floor level and set this value as the min
  7. Measure the level of the 200-period SMA and set this as the average
  8. Measure the peak levels and set this as Max.

EUR/TRY Cost as a Percent of the Trading Range

With the volatility values obtained from the above table, we can see how the cost varies as the volatility of the market varies. All we did is, got the ratio between the total cost and the volatility values and converted into percentages.

ECN Model Account 

Spread = 40 | Slippage = 3 | Trading fee = 3

Total cost = Spread + Slippage + Trading Fee = 40 + 3 + 3 = 46

STP Model Account

Spread = 44 | Slippage = 3 | Trading fee = 3

Total cost = Spread + Slippage + Trading Fee = 44 + 3 + 0 = 47

The Ideal way to trade the EUR/TRY

The EURTRY is a pair with enough volatility and liquidity. Hence, this makes it simpler to trade this exotic-cross currency.

From the above table, we can see that the percentage values are all within 200%. This means that the costs are low irrespective of the timeframe and volatility you trade.

Digging it a little deeper, the costs are higher when the volatility of the market is low and lower for higher volatilities. However, we cannot ignore the fact that this pair is highly volatile. For example, the maximum volatility on the 1H timeframe is as high as 456. So, traders must be cautious before trading this pair.

When it comes to the best time of the day to trade this pair, it is ideal for entering this pair during those times of the day when the volatility is in between the average values because this will ensure decent volatility as well as low costs.

Furthermore, traders can easily reduce their costs by placing orders as ‘limit’ and ‘stop’ instead of ‘market.’ In doing so, the slippage on the trade will not be considered in the calculation of the total costs. So, in our example, the total cost will reduce by three pips.

Categories
Forex Assets

Understanding The Trading Costs Involved In USD/TRY Exotic Currency Pair

Introduction

USDTRY, an exotic currency pair, is the abbreviation for the US Dollar against the Turkish Lira. One can expect high volatility in these pairs. Here, the US Dollar is called the base currency and TRY the quote currency.

Understanding USD/TRY

The value of USDTRY depicts the value of TRY equivalent to one USD. It is quoted as 1 USD per X TRY. So, if the market value of this pair is 5.9878, then 5.9878 Liras are required to buy one US Dollar.

Spread

Spread is the difference between the bid price in the market and the ask price in the market. These prices are set by the brokers. Hence, the prices from each broker differ. Moreover, it varies from the type of execution as well.

ECN: 12 pips | STP: 14 pips

Fees

The commission that you pay to your broker for taking a position in a currency pair is a fee on the trade. This, too, depends on the type of execution model. There is typically no fee on STP accounts. And on ECN accounts, there are a few pips of fees.

Slippage

Slippage is the difference between the trader’s requested price and the broker’s executed price. It depends on two factors, namely, the broker’s execution speed and market volatility.

Trading Range in USD/TRY

The trading range is the range of the pip movement in a currency pair on different timeframes. With it, traders can determine their minimum, average, and maximum risk on a trade in a specified time frame.

Procedure to assess Pip Ranges

  1. Add the ATR indicator to your chart
  2. Set the period to 1
  3. Add a 200-period SMA to this indicator
  4. Shrink the chart so you can determine a large time period
  5. Select your desired timeframe
  6. Measure the floor level and set this value as the min
  7. Measure the level of the 200-period SMA and set this as the average
  8. Measure the peak levels and set this as Max.

USD/TRY Cost as a Percent of the Trading Range

Apart from knowing how many pips the market moves in a given timeframe, it is also necessary to understand the total cost variation in a trade. And below are two tables (for ECN and STP) that will help determine the best time of the day to trade in the currency pair with reduced costs.

ECN Model Account

Spread = 12 | Slippage = 3 |Trading fee = 3

Total cost = Slippage + Spread + Trading Fee = 3 + 12 + 3 = 18

STP Model Account

Spread = 14 | Slippage = 3 | Trading fee = 0

Total cost = Slippage + Spread + Trading Fee = 3 + 14 + 0 = 17

The Ideal way to trade the USD/TRY

The costs on major currencies are pretty low, and the volatility is great. So it is ideal to enter any time in the market to trade these pairs. But, when it comes to exotic pairs, the volatility, as well as the costs, are quite high. Hence, one must be aware of when exactly they should trade these currencies.

The percentages in the above tables are directly proportional to the volatility of the market. Hence, we can conclude that costs are when the volatility is low and vice versa.

To determine the ideal times of the day to trade, you must glance at the volatility table and check if the current volatility if nearby the average values mentioned in the tables. If they are more or less in that range, you are good to trade that currency pair because this will assure a balance between both volatilities as well as costs.

Also, another simple way to reduce costs is by getting rid of the slippage on the trade. This can be done by executing orders using limit orders instead of market orders. In doing so, the total costs will reduce by a significant amount, and so will the cost of the trade.