Categories
Forex Basic Strategies

Trading The High Low Breakout ‘Asian Forex Session’

The significant advantage of the forex market is it opens 24 hours a day, which provides a couple of trading opportunities to traders around the globe. There are four major trading sessions that exist, the first one of Asia, followed by Frankfurt, London, and New York. All of these are the significant sessions that allow investors to trade even in opening sessions or even in the middle of the night. But not all the trading sessions are equally volatile; for example, London and New York are the biggest sessions where a lot of volume traded, and on the other hand, traders believe that the Frankfurt and Asian sessions are the least traded session in the market.

So this mentality stops the traders from trading the Asian session. Another reason might be that when the Asian session opens, half of the world slept, that’s why the price action is less volatile in the market. In a less volatile market, simply it is difficult for the traders to seize the more significant gains, and even in less volatile conditions, traders hate to trade the markets, and if you are the one who is always looking to make quick bucks in the volatile conditions. In this article, we will show you the strategy we created, especially to take advantage of the Asian markets.

We believe you know that London is the most significant trading session in the market, which provides where most of the traders around the globe, bankers, and institutions trade the market. In the London market, most of the currencies show a lot of volatility, and you can trade all of it, but it is advisable to give preference to the GBP, CHF, USD, and EUROS.

Trading Strategy

First of all, we suggest you follow the link below and find out when the London session starts according to your country’s time.

https://forex.timezoneconverter.com/

After finding out the opening time of the London session according to your local time, the next step is to sit on your desk one hour prior to the London opening and find out which of the currencies performed better in the Asian session and mark the Asian session High and Low. The next step is to wait for the London opening and in London session when the price action breaks the Asian session high or low take trade in that direction. As you know, London is the biggest session, so always expect longer moves.  This strategy is specially created for intraday traders, so always trade the Asian high and lows on lower timeframes, such as 5, 15, or 30 minutes.

According to the GMT, the Asian session opens at Midnight and closes at Morning 08:00, and the London session also opened the morning at 8:00 AM, so before the London, opening finds out the Asian high low to take the trade. The image represents the opening, high, and close of the Asian session, the below image clearly represents that the GBPAUD forex pair, didn’t move much in the Asian session and even it turned into a range to give us trades in the London Session.

The major mistake most of the breakout traders made is they don’t wait to confirm the breakout, and sometimes price action came back into the range, and they end up losing side. So it is advisable to confirm the breakout first then only activate your trade. As you can see in the below image, when price action breakout the Asian high and low in the London session, it started holding below the breakout line, which confirms that the breakout is real.

The image below represents our entry, exit, and take profit in this forex pair; we took entry when the price action holds below the breakout line. The stop loss was just above the breakout; the reason for the smaller stops is that the holding below the breakout line confirms the stability of the breakout. Some traders like to trade only the London session, and they exit their positions as the London session closes. It is your personal preference. However, we recommend you hold your positions for the more extended targets because the London session overlaps with the US session, and the US is the biggest session in the industry, where the traders with deep pockets trade the markets. So just like London, if the markets allow you to hold your position for the US session, then go ahead and milk the market. The last green on the below image represents the London closing, but we decided to go for the deeper targets because the trend of the market was quite healthy, which is a sign for us to hold our winning position.

The image below represents the Asian, opening, high, low, and close on the GBPAUD forex pair.

The image below shows that the Asian session failed to make any move in this pair, and it just holds sideways because it was waiting for London to open so that the increased volatility moves the market. When London opens then price action immediately breakout the range, it started holding above the range, which was a confirmation to go long in this pair.

The below image represents our entry, exit, and take profit in this pair; we took entry when price action holds above the breakout line. The stops were just below the breakout, and for the take profit, we decided to lose our position at the major resistance line in the US session.

Conclusion

Asian session high low breakout is an intraday strategy; it helps you to trade all the sessions in the market. You can take data from the Asian session and use it in the London session to take an entry, and the volatility and strength of the US session help you to exit your position at more significant gains. This is the beauty of this strategy, which makes you active in all the sessions. The more you use this strategy, the better your trading will be, and the deeper understanding you will have of all the trading sessions.

Categories
Forex Assets

Trading The AUD/TRY Forex Exotic Currency Pair and Analysing The Costs Involved

Introduction

AUD/TRY is an exotic currency pair in the forex market. The AUD is the short form of the Australian Dollar and the TRY for Turkish Lira. Forex traders interested in such exotic pairs should be aware that trading them comes with high volatility compared to trading major forex pairs. In this exotic currency pair, the AUD is the base currency, while the TRY is the quote currency. Thus, the AUD/TRY price represents the amount of TRY that 1 AUD can buy. For instance, if the AUD/TRY pair’s price is 5.8362, it means that 1 AUD can buy 5.8362 TRY.

AUD/TRY Specification

Spread

In the forex market, your broker sells a currency pair to you at a higher price and buys it from you at a lower price. The value difference between these two prices is the spread. It is the primary way in which forex brokers earn their revenue.

The spread for the AUD/TRY pair is – ECN: 3 pips | STP: 8 pips

Fees

Forex traders with ECN account normally pay a trading fee to their broker whenever they open a position. This commission depends on the size of the trade, and not all forex brokers levy it. STP accounts do not have commissions.

Slippage

In forex trading, slippage refers to the price you expect your market order to be filled at and the price at which it is executed. The difference is a result of delays by your forex broker or high volatility.

Trading Range in the AUD/TRY Pair

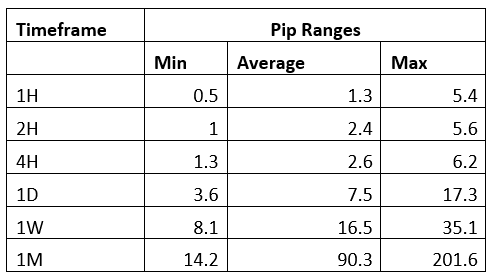
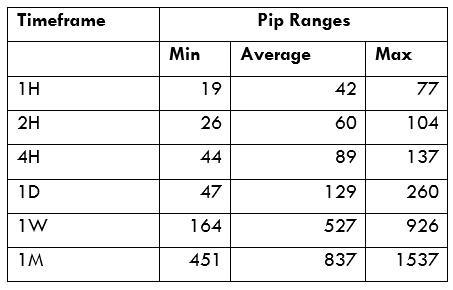
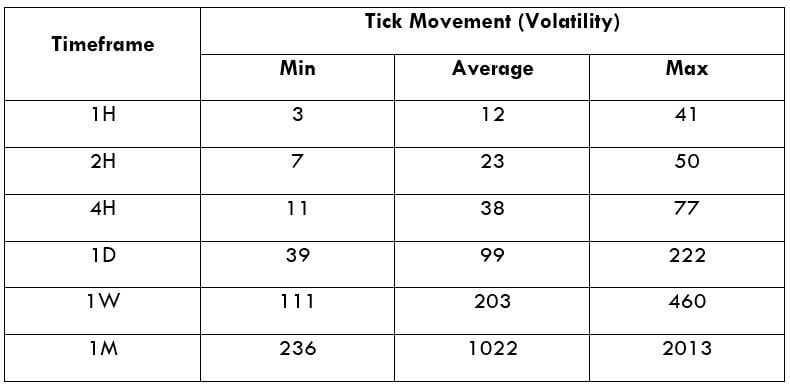
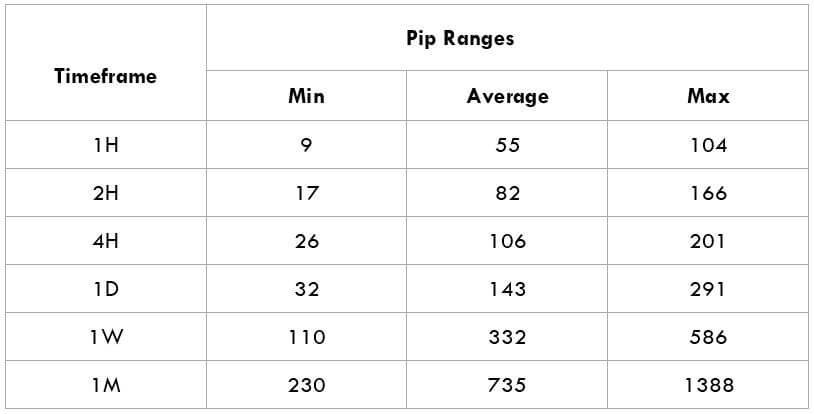
The trading range refers to the analysis of the price fluctuation of a currency pair across various timeframes. The trading range shows the volatility in pips for a currency pair throughout the trading period ranging from minimum to maximum.

The Procedure to assess Pip Ranges

  1. Add the ATR indicator to your chart
  2. Set the period to 1
  3. Add a 200-period SMA to this indicator
  4. Shrink the chart so you can determine a larger period
  5. Select your desired timeframe
  6. Measure the floor level and set this value as the min
  7. Measure the level of the 200-period SMA and set this as the average
  8. Measure the peak levels and set this as Max.

AUD/TRY Cost as a Percentage of the Trading Range

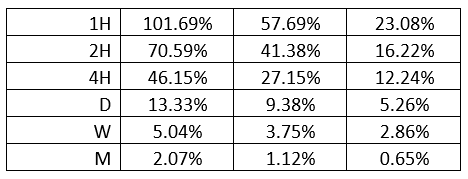
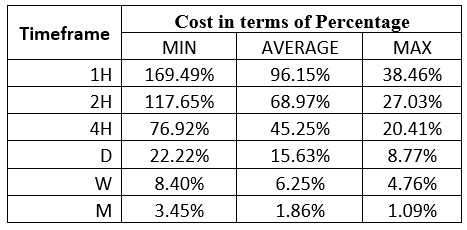
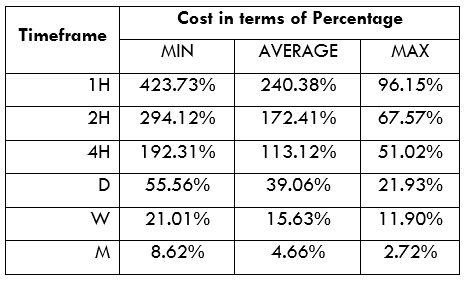
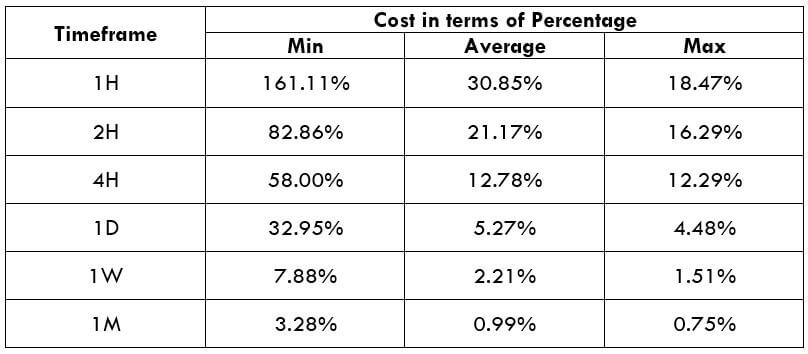
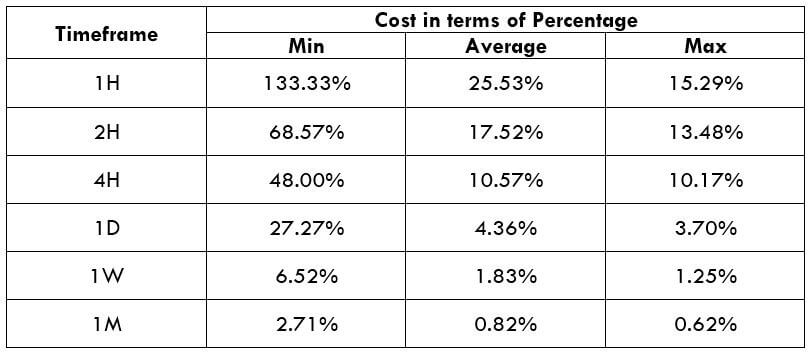
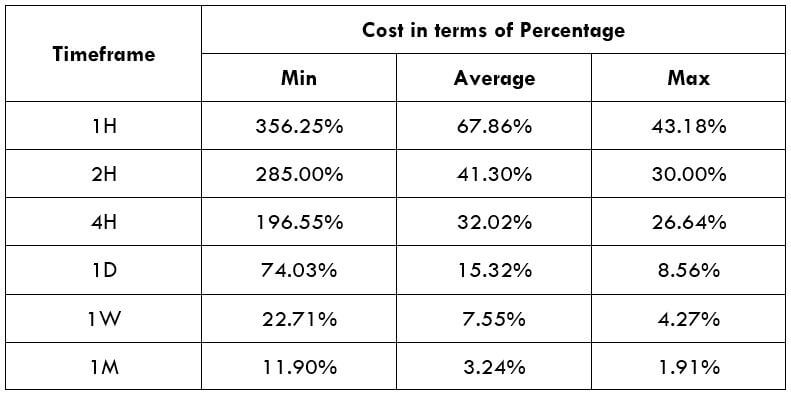
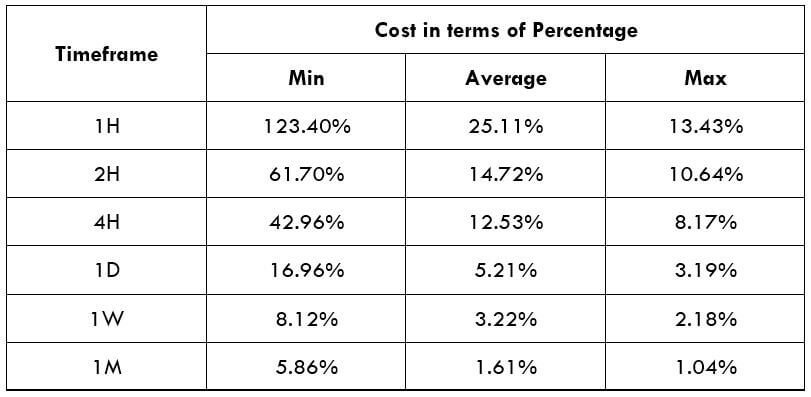
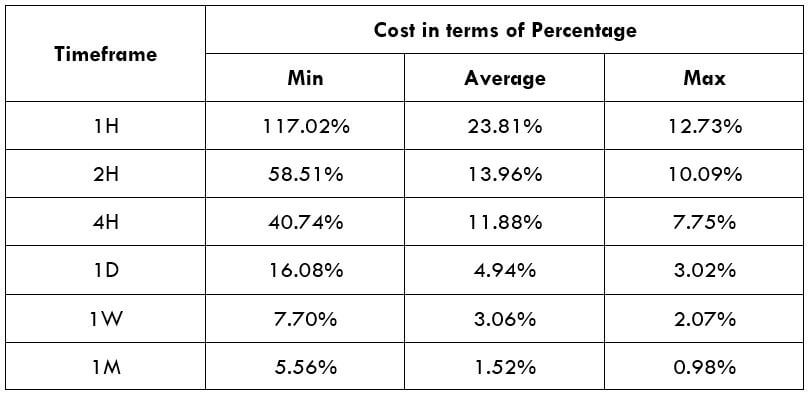
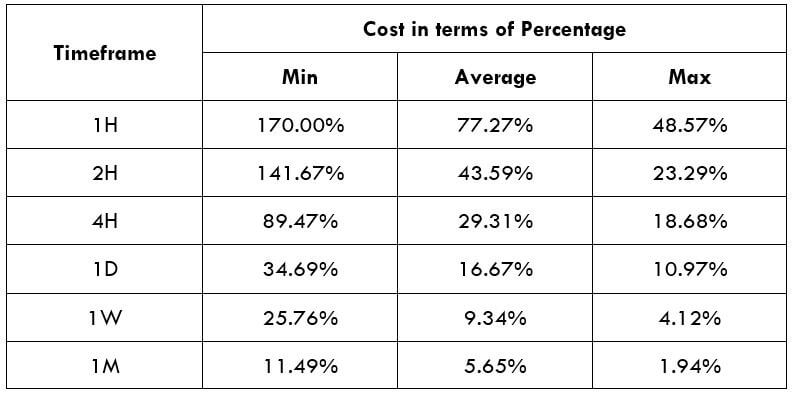
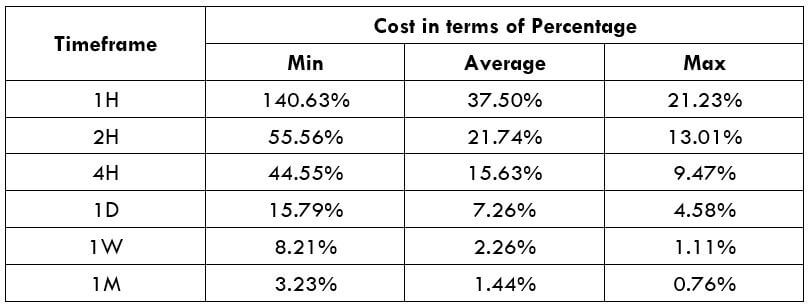
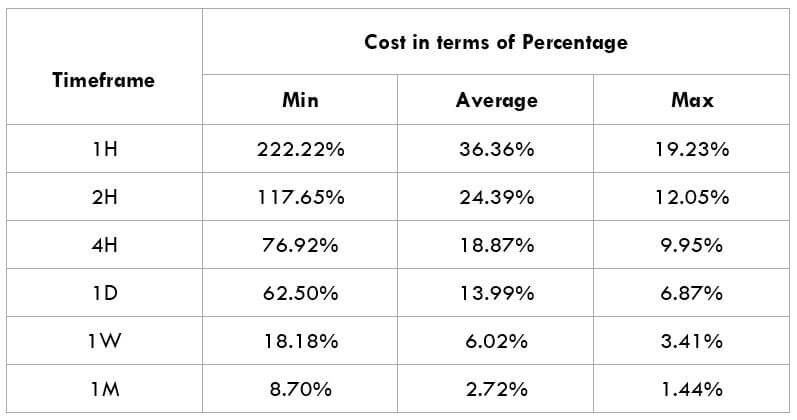
After determining the trading range, we can then determine the trading costs associated with these trading ranges. The total trading cost is expressed as a percentage of the pip volatility. Here are the trading costs for the AUD/TRY pair on both ECN and STP accounts.

ECN Model Account costs

Spread = 3 | Slippage = 2 | Trading fee = 1

Total cost = 6

STP Model Account

Spread = 8 | Slippage = 2 | Trading fee = 0

Total cost = 10

The Ideal Timeframe to Trade  AUD/TRY Pair

From these analyses, we have established that longer timeframes have lower trading costs while the shorter timeframes attract higher trading costs. Note that the highest trading costs coincide with periods of lower volatility.

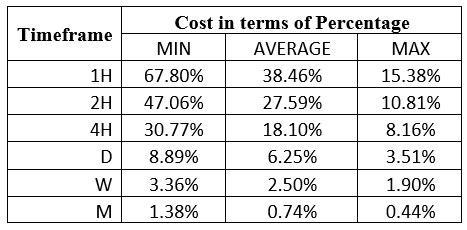
Therefore, the ideal timeframe to trade the AUD/TRY pair would be on longer timeframes when volatility is the highest. For shorter-term traders, opening positions when volatility is above the average can potentially lower the trading costs. Furthermore, traders across all timeframes can lower their trading costs by using the forex limit order types. With these types of orders, the cost of slippage is removed.

Below is an example using the ECN account.

ECN Account Using Limit Model Account

Total cost = Slippage + Spread + Trading fee

= 0 + 3 + 1 = 4

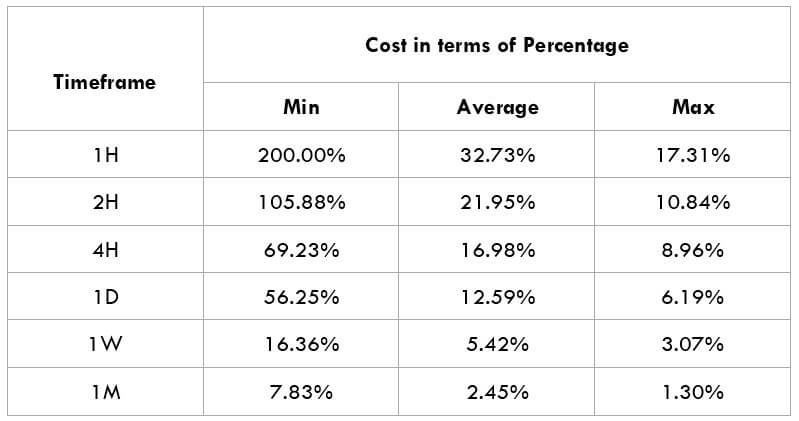
Using the forex limit order types has lowered the trading costs across all timeframes. You can notice that the highest cost has reduced from 101.69% to 67.8%.

Categories
Forex Assets

Exploring The Costs Involved While Trading The AUD/HUF Forex Exotic Pair

Introduction

The AUD/HUF pair is an exotic forex pair with the AUD representing the Australian Dollar and the HUF representing the Hungarian Forint. When trading in such an exotic currency pair, forex traders should anticipate higher volatility. The base currency in this pair is the AUD, while the HUF is the quote currency. Hence, the exchange rate of the AUD/HUF represents the amount of HUF that a single AUD can purchase. If the exchange rate of AUD/HUF is 221.51, it means that you can buy 221.51 HUF using 1 AUD.

AUD/HUF Specification

Spread

One of the ways forex brokers earn their revenue is through the spread. This is the difference in value between the price they sell a currency pair to you and the price at which they buy the same pair from you.

The spread for the AUD/HUF pair is – ECN: 22 pips | STP: 27 pips

Fees

For traders with the ECN account, they get charged a fee for opening positions. Note that not all brokers charge this commission. Forex brokers do not charge a fee on STP accounts.

Slippage

Every forex broker has different execution speeds. In times of high volatility, your order may be executed at a price other than the one you requested. This difference is slippage.

Trading Range in the AUD/HUF Pair

The trading range in forex trading is used to analyse the fluctuation in the price of a currency pair across multiple timeframes. The volatility, as measured with the trading range, is pips from the minimum, average, to the maximum for all timeframes. With this information, you can deduce the most profitable timeframes to trade.

The Procedure to assess Pip Ranges

  1. Add the ATR indicator to your chart
  2. Set the period to 1
  3. Add a 200-period SMA to this indicator
  4. Shrink the chart so you can determine a larger period
  5. Select your desired timeframe
  6. Measure the floor level and set this value as the min
  7. Measure the level of the 200-period SMA and set this as the average
  8. Measure the peak levels and set this as Max.

AUD/HUF Cost as a Percentage of the Trading Range

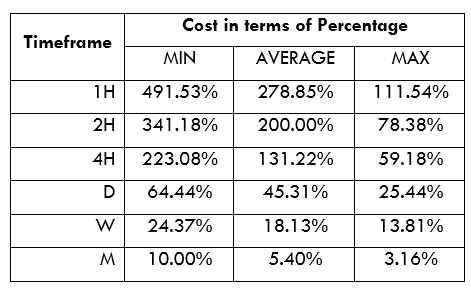
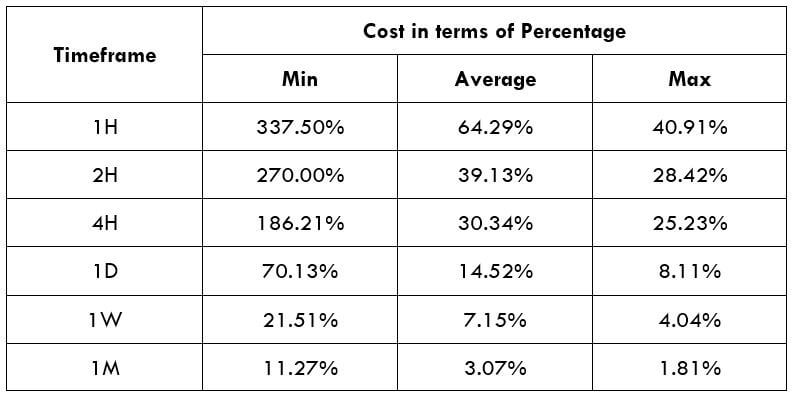
Now that we’ve established the volatility,  we can proceed to calculate the trading costs incurred when trading these timeframes. The trading cost is expressed as a percentage of total costs to the volatility.

Below are the trading costs of the AUD/HUF pair for both ECN and STP accounts.

ECN Model Account costs

Spread = 22 | Slippage = 2 | Trading fee = 1

Total cost = 25

STP Model Account

Spread = 27 | Slippage = 2 | Trading fee = 0

Total cost = 29

The Ideal Timeframe to Trade  AUD/HUF Pair

From the above analyses, we can see that the trading cost of the AUD/HUF pair decreases with an increase in volatility. Since the volatility also increases with the timeframe, trading the AUD/HUF over longer timeframes incurs lower costs.

Although the lower timeframes have higher trading costs, these costs can be reduced by timing trades when volatility approaches the maximum. Furthermore, slippage costs can be avoided if traders use forex limit order types. With the forex limit orders, trades are executed at precise price points, avoiding the impact of slippage. Let’s look at an example of this using the ECN account.

ECN Account Using Limit Model Account

Total cost = Slippage + Spread + Trading fee

= 0 + 22 + 1 = 23

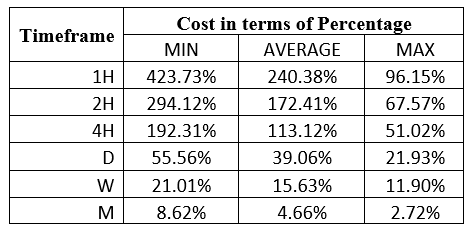
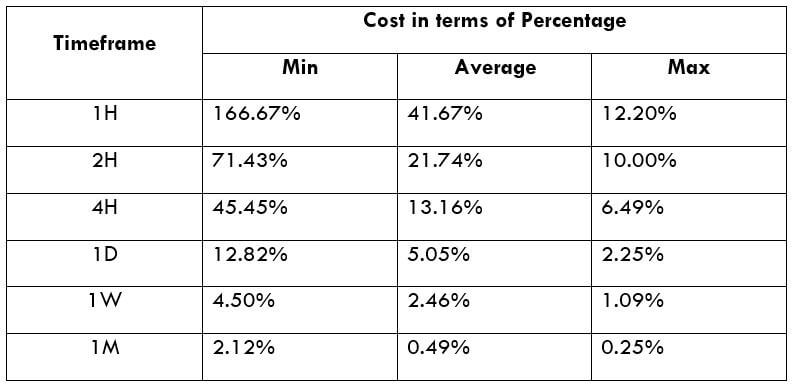
Notice that the trading costs have been reduced in all timeframes. For example, the highest cost has been lowered from 423.73% to 389.83%.

Categories
Forex Assets

Exploring The Costs Involved While Trading The AUD/KRW Exotic Pair

Introduction

The AUD/KRW is an exotic currency pair where AUD is the Australian Dollar, and KRW is the South Korean Won. This article will cover some of the essential elements of the AUD/KRW pair that you should know before you start trading this exotic pair.

The AUD is the base currency, and the KRW is the quote currency in this pair. Hence, the pair’s price represents the amount of KRW that can be bought using 1 AUD. For example, say the price of AUD/KRW is 795.89, it means that for every 1 AUD, you can buy 795.89 KRW.

AUD/KRW Specification

Spread

In forex trading, your broker will sell a currency pair to you at a higher price than the one they will buy from you if you sold it back to them. These prices are “bid” and “ask,” and the difference between them is the spread. The spread for the AUD/KRW pair is:

ECN: 21 pips | STP: 26 pips

Fees

STP type accounts incur no trade commissions. For the ECN accounts, the fees charged depend on your broker and the size of your position.
Slippage

When placing a forex market order with your broker, that order might be executed at a different price. The difference is slippage and is due to higher volatilities or execution delays by the broker.

Trading Range in the AUD/KRW Pair

The trading in forex aims to show the trader how a currency pair fluctuates across multiple timeframes. This analysis is used to determine volatility associated with the pair.

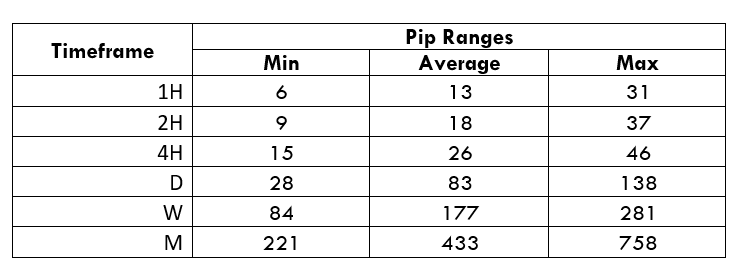
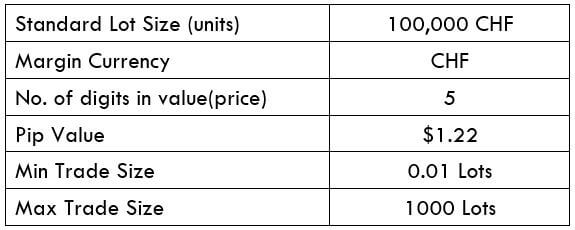
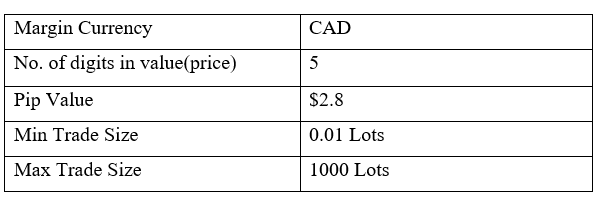
If. For example, the trading range of the AUD/KRW across the 4H timeframe is ten pips; it means that a trader can expect to gain or lose  AUD 12.6; since the value of 1 pip is AUD 1.26.

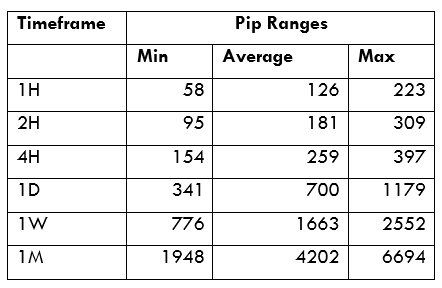
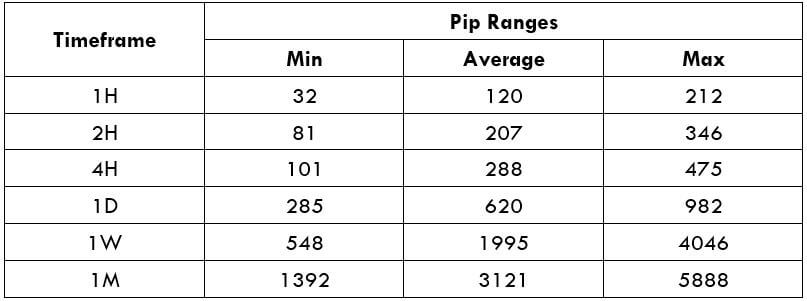
Here’s the trading range of the AUD/KRW  across multiple timeframes.

The Procedure to assess Pip Ranges

  1. Add the ATR indicator to your chart.
  2. Set the period to 1
  3. Add a 200-period SMA to this indicator.
  4. Shrink the chart so you can determine a larger period
  5. Select your desired timeframe
  6. Measure the floor level and set this value as the min
  7. Measure the level of the 200-period SMA and set this as the average
  8. Measure the peak levels and set this as Max.

AUD/KRW Cost as a Percentage of the Trading Range

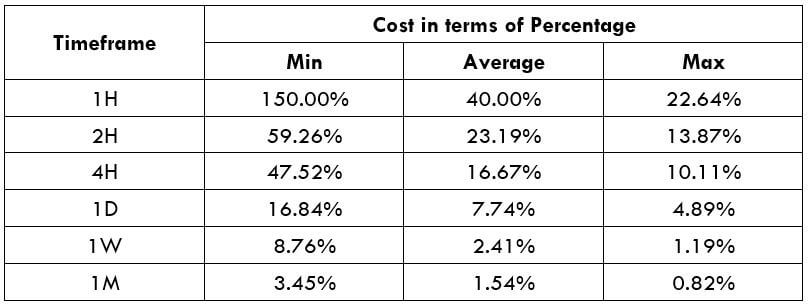
Here, we calculate the total trading costs that a trader can incur trading the AUD/KRW across different timeframes under different volatility.

The trading cost is expressed as a percentage of the volatility, which is in pips.

ECN Model Account Costs

Spread = 21 | Slippage = 2 | Trading fee = 1

Total cost = 24

STP Model Account

Spread = 26 | Slippage = 2 | Trading fee = 0

Total cost = 28

The Ideal Timeframe to Trade AUD/KRW Pair

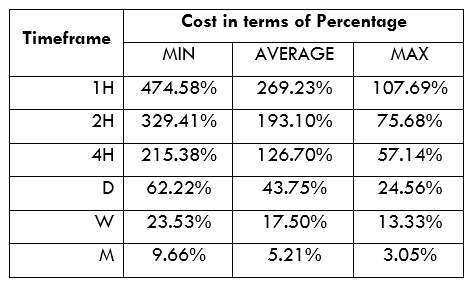
From the above analyses, we can observe that the highest costs in both the ECN and the STP accounts are incurred at the 1H timeframe when volatility is at the minimum 58 pips. Although the trading costs decline as the timeframe becomes longer, you can notice that the costs are lower when volatility is at the maximum across all timeframes. Therefore, for intraday traders trading the AUD/KRW pair when volatility approaches, the maximum will help lower the costs.

Using the forex limit order types can also help to reduce the overall costs since it eliminates the risks of slippage encountered in market orders. Here’s an example.

ECN Account Using Limit Model Account

Total cost = Slippage + Spread + Trading fee

= 0 + 21 + 1 = 22

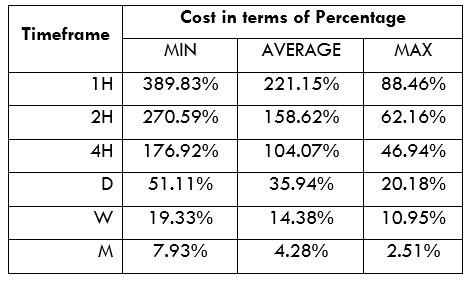
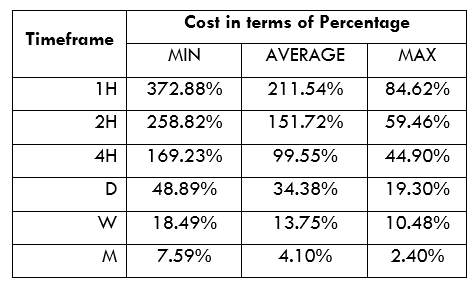
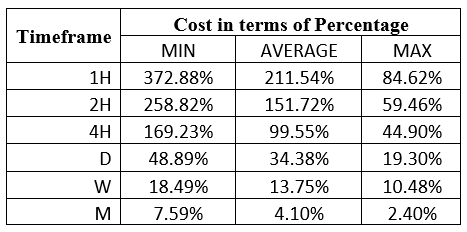
Notice how the overall trading costs have been lowered in all timeframes. When volatility is at the minimum at the 1H timeframe, the highest trading cost has declined from 406.78% to 372.88%.

Categories
Forex Assets

Understanding The Costs Involved While Trading The CAD/ILS Forex Exotic Pair

Introduction

CAD/ILS is an exotic currency cross. Here, CAD is the Canadian Dollar, and ILS is the Israeli Shekel. The CAD is the base currency, and the ILS is the quote currency. Therefore, the price of the CAD/ILS pair represents the quantity of the ILS that  CAD can buy. If the price of the pair is 2.6004, it means that 1 CAD can buy 2.6004 ILS.

CAD/ILS Specification

Spread

The buying price and the selling price of a currency pair tend to be different in forex. The difference between these two prices is the spread. The spread for the CAD/ILS pair is: ECN: 22 pips | STP: 27 pips

Fees

Forex brokers charge a commission on every trade made with the ECN account. The commission varies depending on the broker and the type of trade. Trades on STP accounts do not attract a trading fee.

Slippage

It is rare for a trader to get the exact price they request for a trade. Usually, there is a difference between the price requested and the execution price. This difference is the slippage, and it depends on market volatility and the speed of trade execution.

Trading Range in the CAD/ILS Pair

The trading range is the analysis of how currency fluctuates across different timeframes in terms of pips. The trading range is used to analyze a currency pair’s volatility and expected profit. For example, if on the 2-hour timeframe the trading range of the CAD/ILS pair is 10 pips, then a trader can expect to either gain or lose $38.5

Here’s the trading range for the CAD/ILS pair.

The Procedure to assess Pip Ranges

  1. Add the ATR indicator to your chart
  2. Set the period to 1
  3. Add a 200-period SMA to this indicator
  4. Shrink the chart so you can determine a larger period
  5. Select your desired timeframe
  6. Measure the floor level and set this value as the min
  7. Measure the level of the 200-period SMA and set this as the average
  8. Measure the peak levels and set this as Max.

CAD/ILS Cost as a Percentage of the Trading Range

The cost of trading any currency involves the slippage, fees, and the spread. These costs vary across different timeframes under different volatility conditions. For a forex trader, analyzing the cost as a percentage of the trading range helps implement informed risk management techniques.

The tables below show the analyses of the trading costs for the CAD/ILS pair across different timeframes.

ECN Model Account

Spread = 22 | Slippage = 2 | Trading fee = 1

Total cost = 25

STP Model Account

Spread = 27 | Slippage = 2 | Trading fee = 0

Total cost = 29

The Ideal Timeframe to Trade CAD/ILS

We can see that the trading cost for the CAD/ILS pair is higher during shorter timeframes and low volatility in both the ECN and STP accounts. Longer-term traders trading on weekly and monthly timeframes enjoy relatively lesser trading costs than shorter timeframe traders.

It is worth noting that for every type of trader, initiating trades when volatility is above average reduces the trading costs. Furthermore, opting to use forex limit orders instead of market orders which are susceptible to slippage, can significantly reduce trading costs. With limit orders, the risk of slippage is removed hence lowering trading costs. Here are the trading costs when limit orders are used.

ECN Account Using Limit Model Account

Total cost = Slippage + Spread + Trading fee

= 0 + 22 + 1 = 23

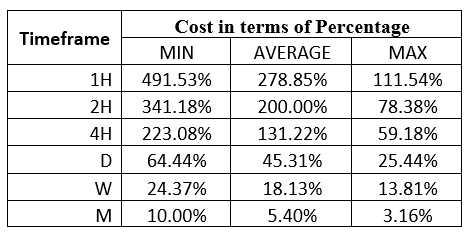
We can see that trading costs for the CAD/ILS have reduced across all timeframes, with the highest cost dropping from 491.53% to 372.88% of the trading range.

Categories
Forex Assets

Asset Analysis – Trading The CAD/PHP Forex Currency Pair

Introduction

CAD/PHP is an exotic Forex currency pair where CAD is the Canadian Dollar while PHP is the Philippine Peso, the Philippines’ official currency. This article will cover fundamental aspects that you should know about CAD/PHP before you start trading the pair.

Understanding CAD/PHP

In this currency pair, the CAD is the base currency, and the PHP is the quote currency. The CAD/PHP pair price represents the quantity of the PHP that can be bought by 1 CAD. If the CAD/PHP price is 36.181, it means that for every 1 CAD you have, you can buy 36.181 PHP.

CAD/PHP Specification

Spread

In forex trading, the spread is the difference in the value at which a trader can buy a currency pair and the price at which they can sell it.

ECN: 10 pips | STP: 15 pips

Fees

There are no trading fees associated with STP accounts. However, for the ECN accounts, the trading fees that you will incur per transaction are determined by your forex broker.

Slippage

When trading forex, slippage occurs when there is a difference between the price at which you place your trade and the price at which your broker executes it. Slippage in forex frequently happens at times of higher volatility or when significantly larger orders are made.

Trading Range in the CAD/PHP Pair

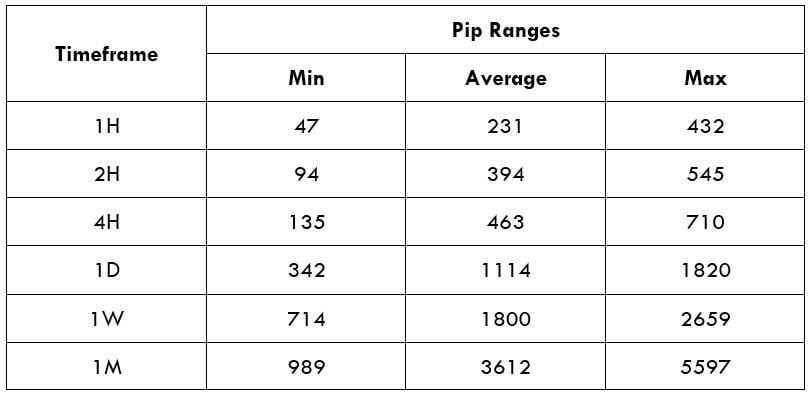
Forex traders should know how a given currency pair changes within different timeframes. This change in terms of pips is referred to as the trading range. It is used to analyze the historical volatility of a given pair across different timeframes. Therefore, the trading range can be used to determine the amount of profit that a trader should expect to earn.

The Procedure to assess Pip Ranges

  1. Add the ATR indicator to your chart.
  2. Set the period to 1
  3. Add a 200-period SMA to this indicator.
  4. Shrink the chart so you can determine a larger period
  5. Select your desired timeframe
  6. Measure the floor level and set this value as the min
  7. Measure the level of the 200-period SMA and set this as the average
  8. Measure the peak levels and set this as Max.

CAD/PHP Cost as a Percentage of the Trading Range

Slippage, spread, and brokers’ fees amount to trading costs to a forex trader.

Total cost = Slippage + Spread + Trading Fee

Therefore, forex traders should be aware of how these costs vary during different timeframes depending on the pip change of the currency they trade.

The tables below are of the percentage costs that can be expected when trading the CAD/PHP pair under the ECN and STP account types. The costs are expressed as pips.

ECN Model Account

Spread = 10 | Slippage = 2 | Trading fee = 1

Total cost = 13

STP Model Account

Spread = 15 | Slippage = 2 | Trading fee = 0

Total cost = 17

The Ideal Timeframe to Trade CAD/PHP

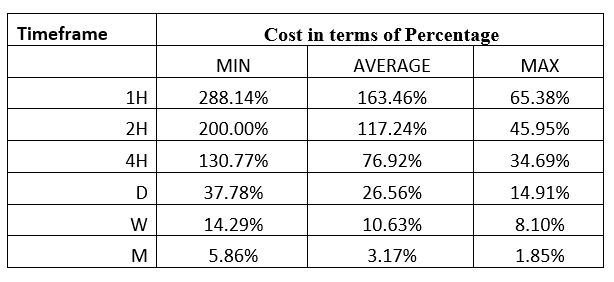
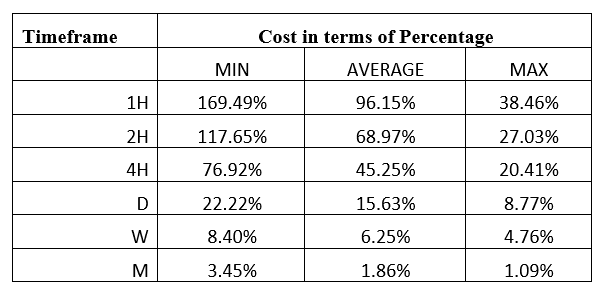
From the above trading range cost analysis, the most cost is incurred at the 1H timeframe at 220.34% for the ECN account and 288.14% for the STP account. These costs imply that it is not ideal to trade during times of low volatility of about 2.3 pips. However, the trading costs associated with the 1H, 2H, 4H, and the 1D timeframes are lower when the market volatility is above average. Intraday traders can time their entry when the volatility of the CAD/PHP is above average.

The longer timeframes for both types of accounts have lower trading costs associated with them. Thus, longer-term traders can get to enjoy lower costs.

Forex traders can also significantly reduce their trading costs by employing limit order types to ensure they do not experience slippage costs. Let’s look at the total costs when slippage is zero with the ECN account.

Total cost = Slippage + Spread + Trading fee

= 0 + 10 + 1 =11

With the ECN account, the highest trading cost reduces from 220.334% to 169.49%, showing that using the limit order types significantly reduces the trading costs.

Categories
Forex Assets

Analyzing The Costs Involved While Trading The NZD/SGD Exotic Forex Pair

Introduction

NZD/SGD is the abbreviation for the native currencies of New Zealand and Singapore. It is considered an exotic pair, where NZD is the first (base) currency, and SGD is the second (quote) currency.

Understanding NZDSGD

This pair’s price determines the value of SGD, which is equivalent to one New Zealand Dollar, NZD. We can quote it as 1 NZD per X number of SGD. For example, if the NZDSGD pair’s value is at 0.90759, we need almost 0.90759 SGD to buy one NZD.

NZDSGD Specification

Spread

The spread comes from the difference between the bid and the ask prices offered by the broker. This value is controlled by the brokers; therefore, traders don’t have a say in this. This value varies on the type of execution used for performing the trades. Below are the ECN and STP values for NZD/SGD currency pair.

Spread on ECN: 26 pips | Spread on STP: 31 pips

Fees

The fee or commission in Forex is similar to the one that is paid to stockbrokers, where it is automatically deducted from traders’ accounts when they take a trade. Note that there are no fees on STP trading accounts, but a few pips are charged on ECN accounts.

Slippage

Slippage happens when a trader tries to open a trade in a price, but it opens at another price. The main reason to occur slippage is the market volatility and the broker’s execution speed.

Trading Range in NZDSGD

Procedure to assess Pip Ranges

  1. Add the ATR indicator to your chart
  2. Set the period to 1
  3. Add a 200-period SMA to this indicator
  4. Shrink the chart so you can assess a large time period
  5. Select your desired timeframe
  6. Measure the floor level and set this value as the min
  7. Measure the level of the 200-period SMA and set this as the average
  8. Measure the peak levels and set this as Max.

NZDSGD Cost as a Percent of the Trading Range

If we look at the volatility values at the above table, we can see how the cost changes with the change in volatility of the market. We just have got that ratio and converted into percentages.

ECN Model Account 

Spread = 26 | Slippage = 5 | Trading fee = 8

Total cost = Spread + Slippage + Trading Fee

= 26 + 5 + 8

Total cost = 39

STP Model Account

Spread = 26 | Slippage = 5 | Trading fee = 0

Total cost = Spread + Slippage + Trading Fee

= 26 + 5 + 0

Total cost = 31

The Ideal way to trade the NZDSGD

The NZDSGD is a currency pair that has a lot of volatility and liquidity. Therefore, it is easier for a trader to trade this currency pair. The above-mentioned percentage values are all within almost 500%. It is an indication that the cost is higher in the lower timeframe and lowers in the higher timeframe.

In other words, the cost rises with an increase in volatility. Therefore, the risk of this pair is that it is highly volatile. However, the best time to trade in this pair is when the volatility is at the average value. A decrease in volatility is ineffective, while the increase in volatility is risky. Therefore, sticking to the average value is suitable for this pair.

Furthermore, there’s an additional way to lessen the cost of the trades you execute. This is by placing a pending order as a ‘limit’ order instead of a ‘market’ order. In this case, there will be no slippage. So, in this example, the total cost will be reduced by five pips.

STP Model Account (Using Limit Orders)

Spread = 26 | Slippage = 0 | Trading fee = 0

Total cost = Spread + Slippage + Trading Fee

= 26 + 0 + 0

Total cost = 26

Categories
Forex Assets

Asset Analysis – Trading Costs Involved While Trading The CAD/AED Currency Pair

Introduction

CAD/AED is a Forex exotic currency pair, where CAD represents the currency of Canada, an AED is the currency of the UAE. In this exotic currency pair, CAD is the base first, and AED is the second currency.

Understanding CADAED

This pair’s price determines the value of AED, which is equivalent to one CAD. We can term it as 1 CAD per X numbers of AED. For example, if the CAD/AED pair’s value is at 2.8007; therefore, we need almost 2.8007 AED to buy one CAD.

CADAED Specification

Spread

In every financial market, Spread represents the difference between the Bid and Ask. It is usually a charge that is deducted by the forex broker. This value changes with the type of execution model.

Spread on ECN: 10 pips | Spread on STP: 15 pips

Fees

The trading fees in the forex market and stock market are the same. It is deducted from the traders’ accounts as soon as they open a new position. Note that STP accounts do not charge anything, but a few pips charges on ECN accounts.

Slippage

Slippage happens when price opens above or below the execution level. Slippage occurs because of two important reasons – market volatility and broker’s execution speed.

Trading Range in CADAED

Procedure to assess Pip Ranges

  1. Add the ATR indicator to your chart
  2. Set the period to 1
  3. Add a 200-period SMA to this indicator
  4. Shrink the chart so you can assess a large time period
  5. Select your desired timeframe
  6. Measure the floor level and set this value as the min
  7. Measure the level of the 200-period SMA and set this as the average
  8. Measure the peak levels and set this as Max.

CADAED Cost as a Percent of the Trading Range

The volatility values on the above table indicate how the cost varies with the change in market volatility. All we did is to get the ratio between the total cost and the volatility values and converted them into percentages.

ECN Model Account 

Spread = 10 | Slippage = 5 | Trading fee = 8

Total cost = Spread + Slippage + Trading Fee

= 10 + 5 + 8 = 23

STP Model Account

Spread = 10 | Slippage = 5 | Trading fee = 0

Total cost = Spread + Slippage + Trading Fee

= 10 + 5 + 0 = 15

The Ideal way to trade the CADAED

The CADAED is an exotic cross currency pair with higher volatility and liquidity. Because of this, traders may find it easy to trade in this pair. We can see that the percentage values above where the value did not move above 230% that represents a higher trading cost in the lower timeframe. However, when we move to the monthly timeframe, the average cost came to below 2%.

Therefore, trading intraday in this currency pair is risky due to the high trading cost. On the other hand, trading in a higher timeframe has less cost, but it requires a lot of patience and time. Overall, for every trader, it is recommended to stick on trading where the trading cost is at the average value.

Another way to reduce the cost is to place a pending order as ‘limit’ and ‘stop’ instead of ‘market.’ In that case, there will be no slippage in the calculation of the total costs. So, in our example, the overall cost will be reduced by five pips.

STP Model Account (Using limit orders) 

Spread = 10 | Slippage = 0 | Trading fee = 0

Total cost = Spread + Slippage + Trading Fee

= 10 + 0 + 0 = 10

Categories
Forex Assets

Costs Involved While Trading The NZD/INR Forex Currency Pair

Introduction

The abbreviation of NZD/INR is the New Zealand Dollar paired with the Indian Rupee. Here, NZD is the official currency of New Zealand, and Indian Rupee is India’s currency. Like other currency pairs, NZD/INR provides some decent movement that allows traders to make money from the forex market.

Understanding NZD/INR

In NZD/INR currency pairs, NZD is the base currency (First Currency), and the INR is the quote currency (Second Currency). In a currency pair’s sell trade, we trade the base currency to buy the quote currency and vice versa. Therefore, if the NZD/INR pair is trading at 49.02, it means we should have 49.02 INR to buy 1 NZD.

Spread

As price and bid price is a common term in the forex market, most of the traders should know. The price represents the price in which we sell a currency pair. On the other hand, the bid price is the price at which we take a buy trade.

The difference between the asking price and the bid price is called the spread, usually a charge that the broker takes from a trader. Below are the spread values for the NZD/INR Forex pair.

ECN: 36 pips | STP: 41 pips

Fees

A Fee is a cost that traders pay to the broker as a charge to take a trade. This fee differs on the type of broker (ECN/STP) we use.

Slippage

In some cases, when we take a trade at a particular price, it might ignore the level and open the trade at another price, which is usually known as Slippage. The Slippage can occur at any price level and at any time, usually when the market remains volatile.

Trading Range in NZD/INR

Our aim as a trader is to eliminate losses and minimize trading risks. The trading range here will indicate how much we will make as a profit or loss within a timeframe. To calculate the exact value, we will use ATR is a technical indicator that suggests the price movement in a currency pair. In the lower table, we interpret the minimum, average, and maximum pip movement in a currency pair. We will assess it merely by using the ATR indicator merged with 200-period SMA.

Procedure to assess Pip Ranges

  1. Add the ATR indicator to your chart
  2. Set the period to 1
  3. Add a 200-period SMA to this indicator
  4. Shrink the chart so you can assess a considerable time period
  5. Select your desired timeframe
  6. Measure the floor level and set this value as the min
  7. Measure the level of the 200-period SMA and set this as the average
  8. Measure the peak levels and set this as Max.
  9. NZD/INR Cost as a Percent of the Trading Range

The price of trade differs on the type of brokers and varies based on the volatility of the market. The full cost of trade involves fees, spread, and sometimes Slippage if the volatility is higher.

ECN Model Account

Spread = 36 | Slippage = 5 |Trading fee = 8

Total cost = Slippage + Spread + Trading Fee = 5 + 36 + 8 = 49

STP Model Account

Spread = 41 | Slippage = 5 | Trading fee = 0

Total cost = Slippage + Spread + Trading Fee = 5 + 41 + 0 = 46

The Ideal way to trade the NZD/INR

Considering the table, we should evaluate these two factors to make trading decisions in the NZD/INR pair. The trading cost and volatility are two critical factors that trade should contemplate when trading in the currency market.

In timeframes, we can see the price movement fluctuates from the minimum volatility and the average volatility. As a trader, we aim to make a profit from this pip movement and variation. However, it often becomes challenging to make a profit if there is no sufficient variant in the pip value. As per the price mentioned above, the NZD/INR pair is profitable in swing trading and day trading.

Categories
Forex Assets

Analyzing the Trading Costs on ‘NZD/CZK’

Introduction

NZD/CZK is the abbreviation for the Euro Area’s Euro against the Czech Koruna. This pair is considered an exotic-cross currency pair. Here, the NZD is the base (first) currency, and the CZK is the quote (second) currency. NDZ is the official currency used in New Zealand, while CZK is the native currency of the Czech Republic.

Understanding NZD/CZK

The price of this pair in the foreign exchange market defines the value of CZK equivalent to one NZD. It is quoted as 1 NZD per X CZK. So, if the value of this pair is 14.8124, these many Korunas are required to purchase one NZD.

Spread

Spread is the mathematical difference between the bid and the asking price offered by the broker. This value is distinct in the ECN account model and STP account model. An approximate value for NZD/CZK pair is given below.

ECN: 43 pips | STP: 48 pips

Fees

The fee is the price/compensation that one pays for the trade. There are no charges on STP accounts, but a few additional pips are levied on ECN accounts.

Slippage

Slippage is a variation between the value proposed by the trader, and the trader indeed received from the broker.

Trading Range in NZD/CZK

The tabular interpretation of the pip movement of a currency pair in separate timeframes is called as the trading range is the. These values are helpful in influencing the profit that can be produced from a trade before-hand. To uncover the value, you must multiply the below volatility price with the pip value of this pair.

Procedure to assess Pip Ranges

  1. Add the ATR indicator to your chart
  2. Set the period to 1
  3. Add a 200-period SMA to this indicator
  4. Shrink the chart so you can assess a large time period
  5. Select your desired timeframe
  6. Measure the floor level and set this value as the min
  7. Measure the level of the 200-period SMA and set this as the average
  8. Measure the peak levels and set this as Max.

NZD/CZK Cost as a Percent of the Trading Range

Trading Range is the interpretation of the total price variation of trades for distinct timeframes and volatilities. The values are achieved by discovering the ratio amongst the total price and the volatility value; it is expressed as a percentage.

ECN Model Account

Spread = 43 | Slippage = 5 |Trading fee = 8

Total cost = Slippage + Spread + Trading Fee = 3 + 43 + 8 = 56 


STP Model Account

Spread = 48 | Slippage = 5 | Trading fee = 0

Total cost = Slippage + Spread + Trading Fee = 5 + 48 + 0 = 53

Trading the NZD/CZK

The bigger the percentage values, the higher is the price on the trade. From the preceding tables, we can see that the values are sizeable in the min column and relatively less significant in the maximum column. This means that the prices are high when the volatility of the market is low.

It is neither suitable to trade when the market’s volatility is elevated nor when the costs are high. To balance out between both these aspects, it is perfect to trade when the volatility of the pair is in the array of the average values.

Additionally, to decrease your costs even beyond, you may place trades using limit orders as a substitute for market orders. In executing so, the slippage will not be involved in the computation of the total costs. And this will put down the cost of the trades by a sizeable number. An example of the same is given below.

STP Model Account (Using Limit Orders)

Spread = 48 | Slippage = 0 |Trading fee = 0

Total cost = Slippage + Spread + Trading Fee = 0 + 48 + 0 = 48

Categories
Forex Assets

Everything About Trading The CHF/THB Forex Exotic Pair

Introduction

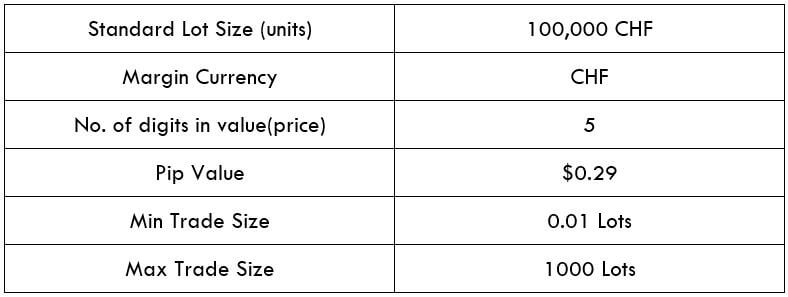
CHF/THB is the abbreviation for the Swiss Franc against the Thai Baht. It is classified as an exotic-cross currency pair as it usually has a low trading volume. In this case, the Swiss Franc (on the left) is the base currency, and the Thai Baht (on the right) is the quote currency. The THB is the official currency of Thailand, and it is further split up into 100 satangs.

Understanding CHF/THB

The market price of CHF represents the value of THB that is required to purchase one CHF(Swiss Franc). It is quoted as 1 CHF per X THB. If the market cost of this pair is 34.350, then this amount of THB is required to buy one unit of CHF.

Spread

The distinction between the asking price and the offering price is labeled as the spread. ECN and STP account model will have various spread values; The approximate spread values of CHF/THB pair in both the accounts are mentioned below:

ECN: 30 pips | STP: 35 pips

Fees

The fee is the commission that one pays while entering a trade. A few extra pips are charged on ECN accounts, but there is no fee charged on STP accounts.

Slippage

The mathematical difference between the price expected by the trader and the given price by the broker can be termed slippage. Its cost varies on two factors, i.e., the market’s high volatility and broker’s implementation speed.

Trading Range in CHF/THB

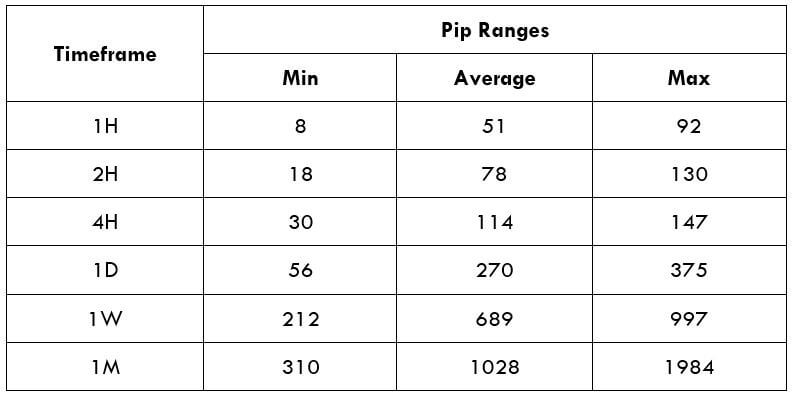
The trading range helps us understand the minimum, average, and maximum pip movement in various time frames. These values assist us in determining the risk, which could be caused by trade. The same is in shown in the below table:

Procedure to assess Pip Ranges

  1. Add the ATR indicator to your chart
  2. Set the period to 1
  3. Add a 200-period SMA to this indicator
  4. Shrink the chart so you can assess a large time period
  5. Select your desired timeframe
  6. Measure the floor level and set this value as the min
  7. Measure the level of the 200-period SMA and set this as the average
  8. Measure the peak levels and set this as Max.

CHF/THB Cost as a Percent of the Trading Range

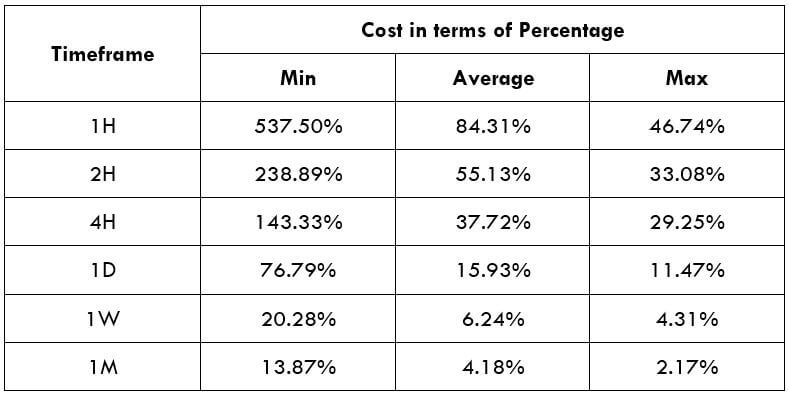
The cost variations in trade can be determined by applying the total cost to the table mentioned below. The cost percentage of the trading range represents the difference in fees on the trade and various time frames for differing volatility.

ECN Model Account

Spread = 30 | Slippage = 5 |Trading fee = 8

Total cost = Slippage + Spread + Trading Fee = 5 + 30 + 8 = 43 

STP Model Account

Spread = 35 | Slippage = 5 | Trading fee = 0

Total cost = Slippage + Spread + Trading Fee = 5 + 35 + 0 = 40

The Ideal way to trade the CHF/THB

The CHF/THB is an exotic-cross currency pair, and this market’s volatility is moderate. For instance, the average pip movement on the 1H timeframe is 51 pips. We should understand the higher the volatility, the lower will be the cost to implement the trade. However, this is not an added advantage as trading in a volatile market means more risk.

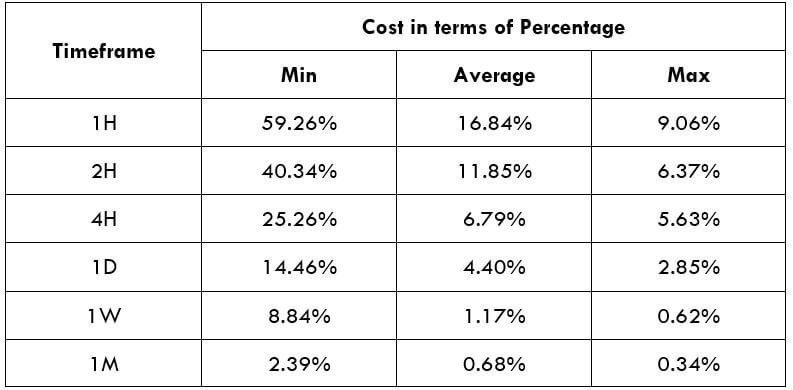
For example, in the 1M time frame, the Maximum pip range value is 1984, and the minimum is 310. When we evaluate the trading fees for both the pip movements, we can see that for 310pip movement fess is 13.87%, and for the 1984 pip movement, the fee is only 2.17%. With the mentioned example, we can conclude that trading the CHF/THB currency pair will be comparatively expensive.

Categories
Forex Assets

Trading Costs Involved While Trading The ‘CHF/CNY’ Exotic pair

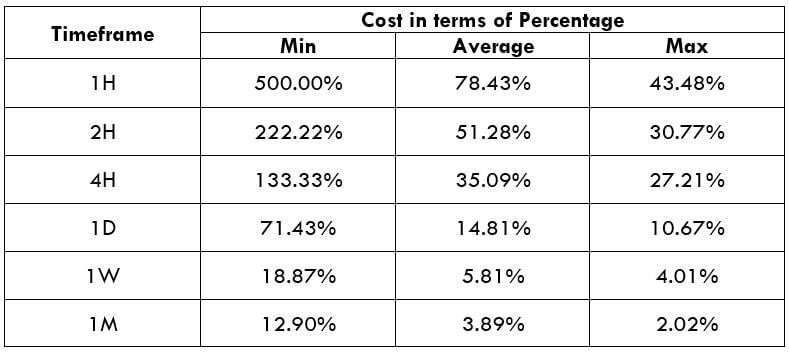
Introduction

CHF/CNY is the abbreviation for the Swiss Franc against the Chinese Yuan. It is categorized as an exotic-cross currency pair with moderate volatility and low trading volume. Here, the Swiss Franc (on the left) is the base currency, and the Chinese Yuan (on the right) is the quote currency. The Chinese Yuan(CNY) is also known as the Renminbi, which is also the official currency of China.

Understanding CHF/CNY

The market price of CHF represents the value of CNY that is compelled to purchase one CHF. It is quoted as 1 CHF per X CNY. If at all the market price of this pair is 7.5423, then this amount of CNY is required to buy one unit of CHF.  

Spread

The distinction between the asking price and the offering price is termed as the spread. ECN and STP account models will have different spread values. The estimated spread values of CHF/CNY pair in both the accounts are mentioned below:

ECN: 19 pips | STP: 24 pips

Fees

The fee is the commission that one pays for the trade. There is no commission charged on STP accounts, but a few additional pips are charged on ECN accounts.

Slippage

The variation between the trader’s expected price and the executed price offered by the broker is referred to as slippage. Its cost varies on the volatility of the market and the broker’s implementation speed.

Trading Range in CHF/CNY

The trading range is represented in a tabular form to understand the pip movement of a currency pair in different timeframes. These values help us determine the profit, which will be generated from trade. To obtain the worth, you will need to multiply the below pip value with the volatility value.

Procedure to assess Pip Ranges

  1. Add the ATR indicator to your chart
  2. Set the period to 1
  3. Add a 200-period SMA to this indicator
  4. Shrink the chart so you can assess a large time period
  5. Select your desired timeframe
  6. Measure the floor level and set this value as the min
  7. Measure the level of the 200-period SMA and set this as the average
  8. Measure the peak levels and set this as Max.

CHF/CNY Cost as a Percent of the Trading Range

We can ascertain the cost variations in trade by implementing the total cost to the below-mentioned table. The values are achieved by identifying the proportion between total cost and volatility value, and they are represented in the form of a percentage.

ECN Model Account

Spread = 19 | Slippage = 5 |Trading fee = 8

Total cost = Slippage + Spread + Trading Fee = 5 + 19 + 8 = 32

STP Model Account

Spread = 24 | Slippage = 5 | Trading fee = 0

Total cost = Slippage + Spread + Trading Fee = 5 + 24 + 0 = 29

The Ideal way to trade the CHF/CNY

Understanding the above table is very simple. The proportion of the total cost of trade is directly relative to the value. It is seen that the rates are approximately high on the minimum section and the other way around. The perfect time to enter the market might be where CHF/CNY’s volatility is between the average pip movement.

To lower your risk, it is recommended to trade when the volatility is near the minimum levels. In this case, the volatility is low, and the costs are marginally high compared to the average and the max values. But, if your primary worry is on lowering costs, you may trade when the market volatility is close to the maximum values.

Trading in such timeframes will assure low expenses just as smaller liquidity. It will also include fewer costs by placing orders using limit/pending orders instead of market orders. This will substantially reduce the total cost with slippage being zero.

STP Model Account (Using Limit Orders)

Spread = 24 | Slippage = 0 | Trading fee = 0

Total cost = Slippage + Spread + Trading Fee = 0 + 24 + 0 = 24

I hope this article will aid you to trade this pair in a much efficient way. Cheers!

Categories
Forex Assets

Trading The CHF/MYR Exotic Forex Pair & Comprehending The Costs Involved

Introduction

CHF/MYR is the abbreviation for the Swiss Franc against the Malaysian Ringgit, and it is considered an exotic currency pair. In this case, the CHF is the base currency, and the MYR is the quote currency. The franc is the official currency of Switzerland and Liechtenstein, while MYR is the official currency of Malaysia.

Understanding CHF/MYR

The market value of CHF/MYR defines MYR’s value that is obliged to buy one franc. It is priced as 1 CHF per X MYR. If the price of the pair is 4.5465 in the market, then these many Malaysian ringgit units are required to buy one CHF.

Spread

The distinction in price between the bid and ask price is determined as Spread. Bid and ask prices are set by the broker. This pip difference is where most of the brokers generate their revenue. Below are the Spread values of CHF/MYR Forex pair in both ECN & STP accounts.

ECN: 44 pips | STP: 49 pips

Fees

The fee is the price you spend on each spot you open with the broker. There is no fee imposed on STP account models, but a few extra pips are charged on ECN accounts.

Slippage

The difference between the price at which, trader implements the trade, and the price he receives from the broker is termed Slippage. This fluctuates based on the broker’s execution speed and the market’s volatility.

Trading Range in CHF/MYR

The total money you will gain or lose in a particular timeframe can be measured utilizing the trading range table. This represents the maximum, average, and minimum pip movement in a currency pair.

Procedure to assess Pip Ranges

  1. Add the ATR indicator to your chart
  2. Set the period to 1
  3. Add a 200-period SMA to this indicator
  4. Shrink the chart so you can assess a large time period
  5. Select your desired timeframe
  6. Measure the floor level and set this value as the min
  7. Measure the level of the 200-period SMA and set this as the average
  8. Measure the peak levels and set this as Max.

CHF/MYR Cost as a Percent of the Trading Range

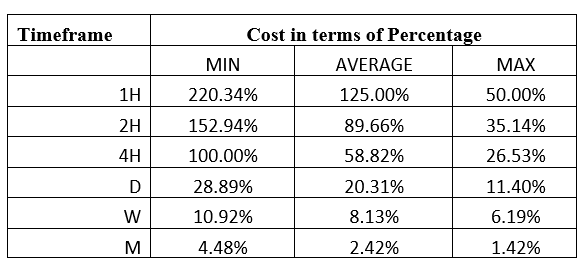
The cost of trade alters based on the volatility of the market. This is for the reason that the total cost involves Slippage and spreads apart from the trading fee. Below is the interpretation of the cost variant in terms of percentages. The understanding of it is reviewed in the following sections.
ECN Model Account

Spread = 44 | Slippage = 5 |Trading fee = 8

Total cost = Slippage + Spread + Trading Fee = 5 + 44 +8 = 57

STP Model Account

Spread = 49 | Slippage = 5 | Trading fee = 0

Total cost = Slippage + Spread + Trading Fee = 5 + 49 + 0 = 54

Trading the CHF/MYR

The CHF/MYR is not an extremely volatile currency pair. For instance, the average pip movement on the 1H timeframe is only 84 pips. Note that the elevated the volatility, the smaller is the cost of the trade. However, this cannot be considered a benefit as it is risky to trade extremely volatile markets.

Also, the higher or lesser the percentages, the higher or lower are the costs on the trade. We can conclude that the costs are elevated for low volatile markets and high for extremely volatile markets.

To reduce your risk, it is proposed to trade when the volatility is near the average standards. In this case, the volatility is low, and the costs are slightly high related to the average and the maximum values. But, if your primary concern is on lowering costs, you may trade when the market volatility is near the maximum values.

Categories
Forex Basic Strategies

Heard Of The ‘Piranha’ Forex Trading Strategy?

Introduction

The forex market is mostly seen to move in a trend or a range. In the previous article, we discussed the rapid-fire strategy, which works best in a trend. The piranha strategy that we are going to discuss is used in a ranging market.

Everyone would have heard of piranhas. They typically take small bites frequently off their prey until it is totally devoured. A single bite may not cause much harm, but it is the frequency of bites that causes the attack to be deadly. In the same way, the piranha strategy was developed to allow scalpers to bite the market and chew off small profits each time.

This strategy is specifically designed for the GBP/USD currency pair, where it is applied to the 5-minutes time frame chart. On average, one can find over 15 trades in a day using the piranha strategy.

Time Frame

The piranha strategy is useful for trading on the 5-minutes time frame. This means each candlestick on the chart represents 5 minutes of price movement.

Indicators

For this strategy, we use the Bollinger band technical indicator with the following settings.

  1. Period 12, Shift 0
  2. Deviation 2

When prices approach the upper band, the market is considered to be overbought, and when prices approach the lower band, markets tend to consolidate. By setting a higher deviation value, the price volatility will be magnified, and we geta a Bollinger band with wider upper and lower bands.

Currency Pairs

The strategy is designed for the GBP/USD currency pair, which is also referred to as The Cable. However, some other currency pairs in which the strategy can be used include EUR/USD, USD/JPY, and GBP/JPY. Since the strategy takes place in short timeframes it is advisable on highly liquid pairs.

Strategy Concept

We will use the Bollinger band indicator to identify the trading range of GBP/USD, after which we will mimic the nature of the piranhas by defining objective entries for long and short positions. Long trades are initiated when market prices touch the bottom of the band, and short trades are taken when prices touch the upper band.
Piranhas are active in rivers and ponds but not in the rough seas with strong currents and waves. In a somewhat similar way, we avoid trading this strategy at times of major news announcements during the U.S. or London sessions, as such environments reflect rough seas with strong currents and waves. We will analyze the GBP/USD currency pair on the 5-minutes chart to look for long and short trades.
Trade Setup

Step 1

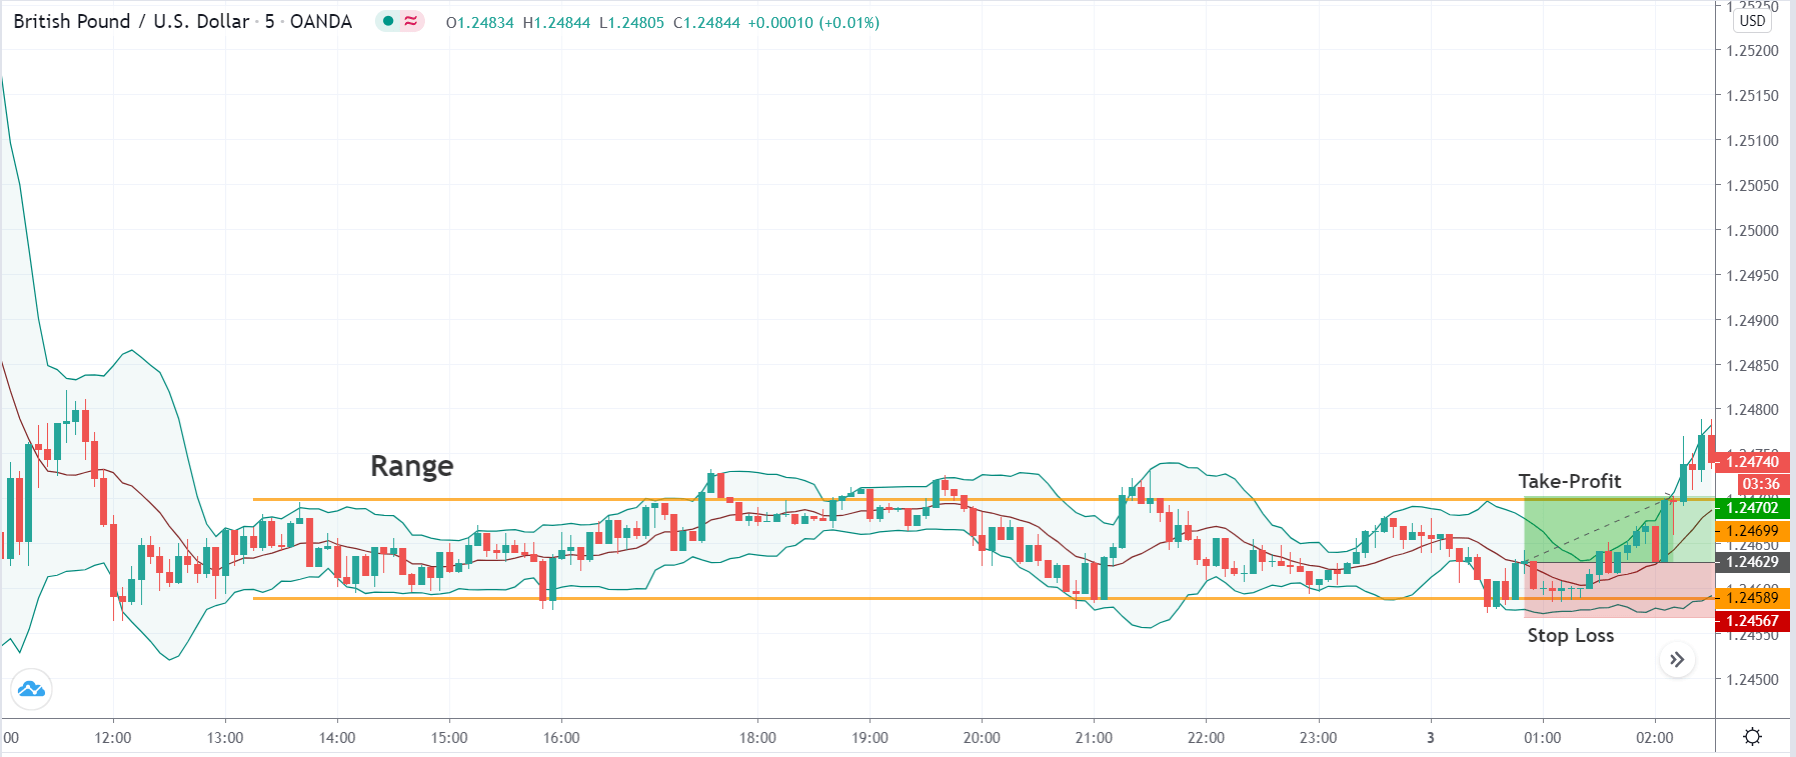
The first step of the strategy is to first look for a range on the chart of GBP/USD. The range can be identified using the Bollinger band strategy. However, we need to apply the concepts of price action for the identification of the range. The essential criterion for a range is that the price should respect the support and resistance levels at least twice. After we have identified the range, we will apply our strategy at the extreme ends of the range to take a suitable position in the pair.

The below image shows an example of the kind range that is required for the strategy.

Step 2

The next step is to wait for the market to hit the lower band of the indicator or upper band of the indicator. At the lower band, we will look for buy opportunities, and likewise, if the price at the upper band, we will look for sell trades.

In this example, we see that the price has approached the lower band, which means there is a high chance that buyers will take the price higher from this point.

Step 3

One should not enter the market soon after the price touches the lower or upper band, which carries a huge risk. We need confirmation from the market before we can take a suitable position. In this step, we look for that confirmation. Once the price closes above the middle line of the Bollinger band indicator, it is a confirmation that the support is respected this time and that the price is heading at least till the range’s resistance.

Step 4

In this step, we determine the take-profit and stop-loss levels for the strategy. We have two take-profit levels – the first take-profit is set at the upper side of the range, a typical place for booking profits. Another method is to hold on to the trades until the market shows signs of reversals, which is when the price falls below the middle line of the Bollinger band.

The stop-loss for this strategy is placed below the support of the range or below the lower band. The trade offers a risk to reward ratio of around 1 to 1.5, which is not bad.

Strategy roundup

In the beginning, we mentioned that the piranhas hunt their prey until it is completely devoured. In a similar way, once the trade hits our stop loss, it means there is nothing left, and we need to look for a new setup.

The triggering of stop loss is an indication that the market is no longer trading in that band, and it has started a new trend. In such cases, wait until the market halts and starts moving in a range. The only difference will be that we will be looking for a trade in the opposite direction with the same rules.

This is an important point and a trick that one can use to navigate themselves in trending markets. As the strategy is developed to trade in a range, one will find few opportunities when the market goes into a strong trend.

Categories
Forex Assets

Trading Costs Involved While Trading The ‘CHF/SEK’ Forex Exotic Pair

Introduction

The acronym of CHF/SEK is Swiss Franc, paired with the Swedish Krona. In this exotic Forex pair, CHF is the official currency of Switzerland and is also the fifth highly traded currency in the Forex market. In contrast, SEK stands for the Swedish Krona, and it is the official currency of Sweden.

Understanding CHF/SEK

In the Forex market, to ascertain the relative value of one currency, we need an alternate currency to assess. The market value of CHF/SEK helps us to understand the power of SEK versus the CHF. So, if the trade rate for the pair CHF/SEK is 9.8418, it means to buy 1 CHF, we need 9.8418 SEK.

CHF/SEK Specification

Spread

Spread is the variable between the ask-bit price that is set at the exchanges. Below are the spread values of the CHF/SEK currency pair in both ECN & STP accounts. The spread charges for ECN and STP brokers for CHF/SEK are given below.

ECN: 45 | STP: 50

Fees

For every place, a trader enters the broker charges some fee for it. A trader must know that this fee is applicable on ECN accounts only and not on STP accounts.

Slippage

Slippage is the price variation between the trader’s execution and at which the broker implemented the price. The variance is due to high market volatility and slow execution speed.

Trading Range in CHF/SEK

A trading range is the interpretation of the volatility in CHF/SEK in numerous timeframes. The values are attained from the Average True Range indicator. One can use the table as a risk management tool to distinguish the profit/loss that a trader is possessed.

Below is a table explaining the minimum, average, and max volatility (pip movement) on a variety of timeframes.  

 Procedure to assess Pip Ranges

  1. Add the ATR indicator to your chart
  2. Set the period to 1
  3. Add a 200-period SMA to this indicator
  4. Shrink the chart so you can assess a large time period
  5. Select your desired timeframe
  6. Measure the floor level and set this value as the min
  7. Measure the level of the 200-period SMA and set this as the average
  8. Measure the peak levels and set this as Max.

CHF/SEK Cost as a Percent of the Trading Range

The entire cost of the trade varies based on the volatility of the market. So, we must find out the instances when the costs are less to place ourselves in the market. Below is a table explaining variation in the costs based on the change in the market volatility.

Note: The percentage costs represent the comparative scale of costs and not the fixed costs on the trade.

ECN Model Account

Spread = 45 | Slippage = 5 | Trading fee = 8

Total cost = Slippage + Spread + Trading Fee = 5 + 45 + 8= 58

STP Model Account

Spread = 50 | Slippage = 5 | Trading fee = 0

Total cost = Slippage + Spread + Trading Fee = 5 + 50 + 0 = 55

The Ideal way to trade the CHF/SEK

The two components a trader should consider while trading any security in the markets are – Volatility & Cost. With the help of the above tables, let us evaluate these two factors to trade the CHF/SEK ideally.

We can see that the pip difference is substantially high among the minimum volatility and the average volatility in every timeframe. For a day trader, the objective is to make revenue from the pip movement of the market. But, if there is barely any pip movement in the price, it becomes difficult to make profits out of the market. Therefore, it is perfect to trade when the volatility is at the average value.

The cost increases as the volatility decline, and they are inversely proportional to each other. In other words, highly volatile markets have the lowest costs. However, it is relatively risky to trade markets with higher volatility though the costs are low. Therefore, to maintain stability among the cost and volatility, traders may discover instances when the volatility is close to the average values or a little above it.

Categories
Forex Assets

Asset Analysis – Trading The Natural Gas Commodity Asset

Introduction

Natural gas is a soft commodity that is extensively traded in the market, like Crude Oil. The price changes every moment, as it is publicly traded on an exchange. The price of natural gas is determined by supply and demand in the physical market, as well as the demand and supply from the traders in the online market.

Understanding Natural Gas

Trading natural gas in the online market is speculating the short-term price fluctuations. Buying natural gas is only an electronic transaction and does not mean the physical purchase of the commodity.

There are several ways to trade natural gas in the online market. One of the heavily traded ways is through futures contracts. A futures contract is a contract (agreement) to buy or sell an asset at a future price.

Chicago Mercantile Exchange (CME Group) is the route through which nature gas futures is traded. There are many types of natural gas and its contracts that can be traded. However, the most traded contract is the Henry Hub Natural Gas Futures (NG).

Each contract of NG represents 10,000 million British thermal units (mmBtu). In the futures exchange market, NG fluctuates with a minimum of $0.001. In other words, a $0.001 price movement in NG represents one pip (tick). Like pip value in forex, the tick value of NG is $10. For every tick in price, a trader will see a $10 change in P/L.

Natural Gas Specification

Fees Associated with Natural Gas Futures Trading

There are different types of fees involved while trading natural gas futures. Typically, there are four basic fees that a brokerage charges for every futures contract traded:

  • Exchange/Clearing fees
  • National Futures Association (NFA) fee
  • Data fees
  • Brokerage commissions

The types of the fee listed above are either charged “per side” or “round turn” basis. Also, it varies from broker to broker.

Trading Range in Natural Gas

A trading range represents the price fluctuations in natural gas in different time frames. Similar to pips in currency pairs, the price movement in natural gas is represented in ticks, where each tick is an increment of $0.001.

Procedure to assess Pip Ranges

  1. Add the ATR indicator to your chart
  2. Set the period to 1
  3. Add a 200-period SMA to this indicator
  4. Shrink the chart so you can assess a significant period
  5. Select your desired timeframe
  6. Measure the floor level and set this value as the min
  7. Measure the level of the 200-period SMA and set this as the average
  8. Measure the peak levels and set this as Max.

Cost as a Percent of the Trading Range

Cost a percent of the trading range is the depicts the variation in fees on the trade-in different time frames for varying volatility. It is simply the ratio of the total fee and the tick values.

Total fee (per contract) = $50 (5 ticks) [approx. fee]  

Trading the Natural Gas

Natural gas is heavily traded in the futures market. It is a soft commodity like Crude Oil and is quite popular in the commodity space. Traders speculate on natural gas using both fundamental and technical analysis. The fundamentals of NG vary from that of other commodities, while the technical analysis works perfectly the same as any other asset. The fee structure, too, is pretty different from that of currency pairs, as it is mostly traded in the futures market. However, the total fee is more or less the same.

Understanding the fee variation

The fee is something that varies relatively with the change in time frame and volatility traded. In essence, a trader trading the 1H time frame will have to pay relatively more fee than a trader speculating on the 4H. Due to this, the percentage values are higher on the 1H time frame than the 4H time frame.

Likewise, the relative fee is higher when the market volatility is at the minimum values, even though the time frame remains the same. So, to efficiently manage the fee, one must trade during the times when the market volatility is at or above the average values.

Categories
Forex Assets

Everything About Trading The CHF/DKK Forex Asset Class

Introduction

The abbreviation of CHF/DKK is Swiss Franc, paired with the Danish Krone. Here CHF is the official currency of Switzerland and is also the fifth highly traded currency in the Forex market. In contrast, DKK stands for the Danish Krone, and it is the official currency of Denmark and the provinces of Greenland and the Faroe Islands.

Understanding CHF/DKK

In the Foreign exchange market, to ascertain the comparative value of one currency, we need an alternative currency to evaluate. Once when we buy a currency, which is identified as the base currency and simultaneously sell the quote currency. The market value of CHF/DKK helps us to comprehend the power of DKK against the CHF. So if the trade rate for the pair CHF/DKK is 6.9915, it means to buy 1 CHF, we need 6.9915 DKK.

CHF/DKK Specification

Spread

A spread is described as a distinction between the buying & offering price of a Forex pair. In other words, it is a distinction between the ask-bid price of an asset. Below is the spread charges for ECN and STP stock brokers for CHF/DKK pair.

ECN: 12 | STP: 17

Fees

A Fee is a cost that we traders pay to the broker for achieving a trade. The Fees differ on the type of broker (STP/ECN) we use.

Slippage

When we want to implement a trade at a specific market rate, but as a replacement for it, the trade gets implemented at a different rate, and that is because of the slippage. Slippage occurs when we deal with a volatile market, and when we execute a large order at the same time.

Trading Range in CHF/DKK

The trading range in the table below will ascertain the amount of money we will gain or lose in each timeframe. We have the interpretation of the minimum, average, and maximum pip movement in a currency pair in the below table. Now we will use the ATR indicator that demonstrates the price movement in a currency pair.

Below is a table demonstrating the minimum, average, and max volatility (pip movement) on numerous timeframes.

Procedure to assess Pip Ranges

  1. Add the ATR indicator to your chart
  2. Set the period to 1
  3. Add a 200-period SMA to this indicator
  4. Shrink the chart so you can assess a large time period
  5. Select your desired timeframe
  6. Measure the floor level and set this value as the min
  7. Measure the level of the 200-period SMA and set this as the average
  8. Measure the peak levels and set this as Max.

CHF/DKK Cost as a Percent of the Trading Range

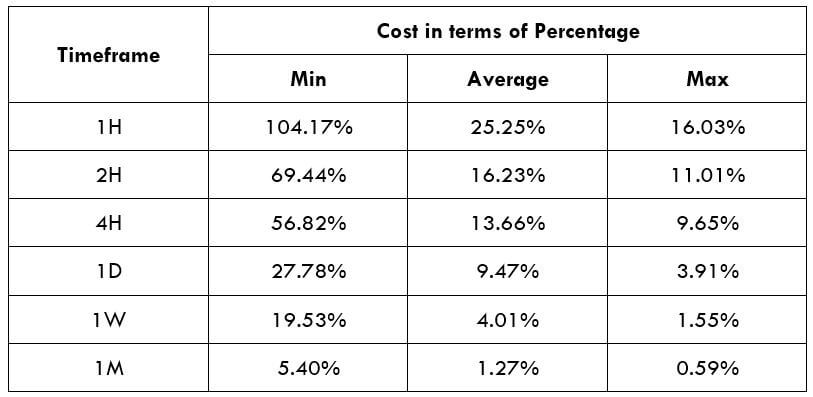
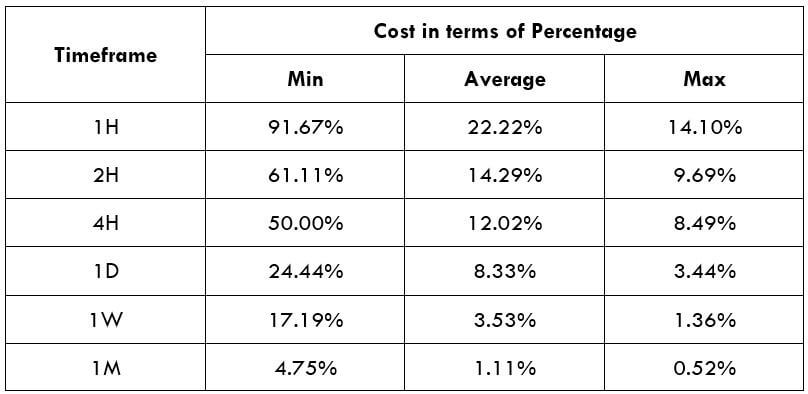
The price of trade differs on the type of broker and fluctuates based on the volatility of the market. The aggregated cost of trade involves spread, fees, and occasionally slippage if the volatility is high. To reduce the cost of the trade, we can use limit orders as an alternative for market execution.

ECN Model Account

Spread = 12 | Slippage = 5 | Trading fee = 8

Total cost = Slippage + Spread + Trading Fee = 5 + 12 + 8= 25

STP Model Account

Spread = 17 | Slippage = 5 | Trading fee = 0

Total cost = Slippage + Spread + Trading Fee = 5 + 17 + 0 = 22

The Ideal way to trade the CHF/DKK

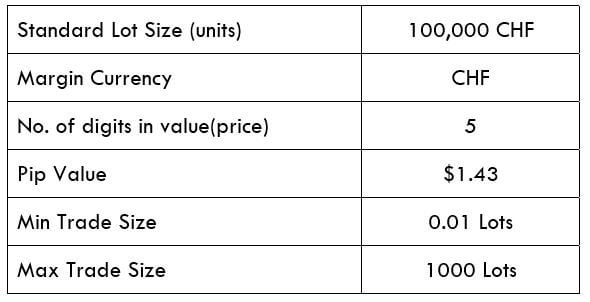
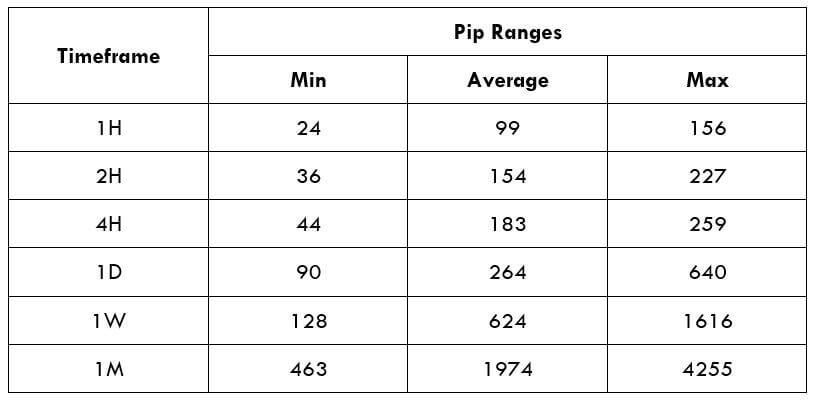
CHF/DKK is an exotic currency pair. Here, the average pip movement in 1hr timeframe is 99, which implies higher volatility. The greater the volatility, the greater is the risk and low cost of the trade and the other way around. Considering the above tables, we can see from the trading range that when the pip movement is lower, the proportion is high, and when the pip movement is elevated, the proportion is low.

The ratios are higher in the minimum column. This indicates the cost is high when the volatility of the market is lower. For example, on the 1H timeframe, when the volatility is 24 pips, the cost percentage is 104.17%. Meaning, one must accept high costs if they enter or exit trades when the volatility is around 24 pips. So, preferably, it is suggested to trade when the market volatility is higher than the average.

Categories
Forex Assets

CHF/SGD – Trading Costs Involved While Trading This Forex Exotic Pair

Introduction

CHF/SGD is the short form for the Swiss Franc against the Singapore Dollar. It is classified as an exotic Forex currency pair. Currencies in the Forex market are always traded in pairs. The key currency in the pair (CHF) is the base currency, while the subsequent one (SGD) is the quote currency.

Understanding CHF/SGD

The market value of CHF/SGD determines the value of SGD required to buy one Swiss Franc. It is quoted as 1 CHF per X SGD. Therefore, if the market price of this pair is 1.4699, then these many Singapore Dollar units are necessary to buy one CHF.

Spread

The spread is the distinction between the bid-ask price. Generally, these two prices are set by the stockbrokers. The pip contrast is through which brokers generate revenue.

ECN: 12 pips | STP: 17 pips

Fees

The fee is the commission you pay to the broker on each spot you open. There is no fee charged on STP account models, but a few extra pips on ECN accounts.

Slippage

Slippage is the distinction between the price at which the trader implemented the trade and the actual price he got from the broker – this change based on the volatility of the market and the broker’s implementation speed.

Trading Range in CHF/SGD

The trading range table will help you ascertain the amount of money that you will win or lose in each timeframe. This table represents the minimum, average, and maximum pip movement in a currency pair.

Procedure to assess Pip Ranges

  1. Add the ATR indicator to your chart
  2. Set the period to 1
  3. Add a 200-period SMA to this indicator
  4. Shrink the chart so you can assess a large time period
  5. Select your desired timeframe
  6. Measure the floor level and set this value as the min
  7. Measure the level of the 200-period SMA and set this as the average
  8. Measure the peak levels and set this as Max.

CHF/SGD Cost as a Percent of the Trading Range

The price of the trade fluctuates based on the volatility of the market. Therefore, the total cost involves slippage and spreads, excluding from the trading fee. Below is the interpretation of the cost difference in terms of percentages.

ECN Model Account

Spread = 12 | Slippage = 5 |Trading fee = 8

Total cost = Slippage + Spread + Trading Fee = 5 + 12 + 8 = 25

STP Model Account

Spread = 17 | Slippage = 5 | Trading fee = 0

Total cost = Slippage + Spread + Trading Fee = 5 + 17 + 0 = 22

Trading the CHF/SGD

The CHF/SGD is not a volatile pair. For example, the average pip movement on the 1H timeframe is only 22 pips. If the volatility is higher, then the cost of the trade is low. However, it involves an elevated risk to trade highly volatile markets. Also, the higher/lesser the percentages, the greater/smaller are the costs on the trade. So, we can conclude that the costs are higher for low volatile markets and high for highly volatile markets.

To diminish your risk, it is advised to trade when the volatility is around the average values. The volatility here is low, and the costs are a slightly high matched to the average and the maximum values. But, if the priority is towards lowering costs, you could trade when the volatility of the market is near the maximum values with optimal risk management.

Advantage on Limit orders (STP Model Account)

For orders that are executed as market orders, there is slippage applicable to the trade. But, with limit orders, there is certainly no slippage applicable. Only the spread and the trading fees will be accounted for by calculating the total costs. Hence, this will bring down the cost considerably.

Spread = 17 | Slippage = 0 | Trading fee = 0

Total cost = Slippage + Spread + Trading Fee = 0 + 17 + 0 = 17

Categories
Forex Assets

Asset Analytics – Trading The CHF/HKD Foreign Exchange Pair

Introduction

CHF/HKD is the abbreviation for the Swiss Franc against the Hong Kong Dollar. It is categorized as an exotic currency pair that usually has high volatility and low trading volume. Here, the CHF (on the left) is the base currency, and the HKD (on the right) is the quote currency.

Understanding CHF/HKD

The market price of CHF/HKD represents the value of HKD that are obliged to purchase to one CHF. It is quoted as 1 CHF per X HKD. If at all the market price of this pair is 8.1718, then this amount of HKD is required to buy one CHF.  


Spread

The difference between the bid-ask price is described as the spread. Its value differs from the ECN account model and STP account model. The approximate value for the two is specified below:

ECN: 35 pips | STP: 40 pips

Fees

A fee is a price that one pays to the broker for executing a trade. There is no fee charged on STP accounts, but a few pips are charged on ECN accounts.

Slippage

The difference between price called for by the client and price that was offered by the broker is described as the slippage. Its value varies on the volatility of the market and the broker’s execution.

Trading Range in CHF/HKD

The trading range is that the tabular representation of the pip movement of a currency pair in several timeframes. These values are useful in determining the profit, which will be generated from trade in advance. To seek out the worth, you need to multiply the below volatility value with the pip value of this pair.

Procedure to assess Pip Ranges

  1. Add the ATR indicator to your chart
  2. Set the period to 1
  3. Add a 200-period SMA to this indicator
  4. Shrink the chart so you can assess a large time period
  5. Select your desired timeframe
  6. Measure the floor level and set this value as the min
  7. Measure the level of the 200-period SMA and set this as the average
  8. Measure the peak levels and set this as Max.

CHFHKD Cost as a Percent of the Trading Range

By implementing the total cost to the mentioned table, we can ascertain the cost differences in a trade. The values are attained by finding a proportion between total cost and volatility value and are indicated as a percentage.

ECN Model Account

Spread = 35 | Slippage = 5 |Trading fee = 8

Total cost = Slippage + Spread + Trading Fee = 5 + 35 + 8 = 48 

STP Model Account 

Spread = 40 | Slippage = 5 | Trading fee = 0

Total cost = Slippage + Spread + Trading Fee = 5 + 40 + 0 = 45

The Ideal way to trade the CHF/HKD

Comprehending the above tables is important. The ratio to the total cost of trade is directly proportional to the value. It is seen that the rates are nearly high on the min section (less volatility) and the other way around. Now, the perfect chance to enter the market would be the point at which the volatility of CHF/HKD is somewhere between the average pip movement. Trading this pair during such minutes will guarantee low trading costs just as lower liquidity.

You can reduce the trading costs by placing orders using limit/pending orders instead of market orders. This will considerably reduce the total cost with slippage being zero. I hope this article will assist you in trading this pair in a much efficient way. Cheers!

Categories
Forex Assets

Analyzing The ‘ADA/USD’ Crypto-Fiat Asset Class

Introduction

Cardano is a decentralized platform allowing programmable transfers of value securely in a scalable fashion. It is the first blockchain created out from a scientific philosophy. It is also the first research-driven cryptocurrency that is built on the Haskell programming language.

Cardano is traded with the ticker ADA. It has a market capitalization of $2.2 billion. It can be bought, sold, and exchanged in several cryptocurrency exchanges. Apart from USD, it can be traded against other cryptos such as BTC, ETH, USDT, etc.

Understanding ADA/USD

The price of ADA/USD depicts the value of the US Dollar equivalent to one Cardano. It is quoted as 1 ADA per X USD. For example, if the market price of ADA/USD is 0.086112, then each ADA will be worth 0.086112 US dollars.

ADA/USD specifications

Forex brokers allow trading of only a few popular cryptocurrencies like Bitcoin, Ethereum, Ripple, etc. The other cryptos must be traded via cryptocurrency exchanges. And the working of these exchanges is different from that of forex brokers. As a major difference, cryptos are not traded in lots, in cryptocurrency exchanges.

Spread

Spread is the difference between the buying and selling price of the cryptocurrency. Crypto exchanges match these prices between induvial traders. Thus, there is no fixed spread. Also, typically, the spread is negligible in trading cryptos.
Fee

There are different fees charged by cryptocurrency exchanges for trading any coin. The various forms of fees include

  • Execution fee (Taker or Maker)
  • 30-day trading volume fee
  • Margin opening fee, if applicable

Note that the taker or maker fee will be considered for opening as well as closing the trade, and will depend on the value being traded.

Example

  • Short 10,000 ADA/USD at $0.085800
  • 30-day volume fee is $0
  • Order is executed as Taker

Total cost of the order = 10000 x $0.085800 = $858

Assuming the taker fee to be 0.26%, the opening fee will be – $858 x 0.26% = $2.23

Assuming the trade is opened with leverage, and the margin opening fee is 0.02%, the fee is calculated as – $858 x 0.02% = $0.17

If the order is closed at $0.095800, the total cost of closing will be 10,000 x $0.095800 = $958. And the fee for the same obtained is – $958 x 0.26% = $2.5

Thus, the total fee for the opening, maintaining and closing the trade would be equal to – $2.24 + $0.17 + $2.5 = $4.91

Trading Range in ADA/USD

The trading range represents the number of units moved in the pair in a specified time frame. For example, if 10,000 ADA/USD is traded and the average unit movement in the 1H time frame is 0.000778, then it means the pair will yield 10,000 x 0.000778 = $7.78.

Note: the above values are for trading 10,000 units of ADA/USD. If X units are traded, then the ATR values will be,

(Above ATR value / 10,000) x X units

Procedure to assess ATR values

  1. Add the ATR indicator to your chart.
  2. Set the period to 1
  3. Add a 200-period SMA to this indicator.
  4. Shrink the chart so you can assess a large time period
  5. Select your desired timeframe
  6. Measure the floor level and set this value as the min
  7. Measure the level of the 200-period SMA and set this as the average
  8. Measure the peak levels and set this as Max.

ADA/USD Cost as a Percent of the Trading Range

The following tables depict the variations in total cost in terms of percentage based on the change in volatility and time frame.

Taker Execution Model

Opening = $2.23 | Margin fee = $0.17 | Closing = $2.5

Total fee = Opening + Margin fee + Closing = $2.24 + $0.17 + $2.5 = $4.91

Maker Execution Model

Opening = $1.37* | Margin fee = $0.17 | Closing = $1.53*

Total fee = Opening + Margin fee + Closing = $1.37 + $0.17 + $1.53 = $3.07

*Assuming maker fee to be 0.16% the trade value.

Trading the ADA/USD

Cardano stands 10th in CoinMarketCap in terms of market capitalization. Thus, making it a tradable pair in the crypto market. Almost all forex brokers do not ADA enabled for trading, so it must be traded through cryptocurrency exchanges. The fee structure here is quite different from forex brokers. However, the overall fee is more or less the same.

Comprehending the above tables, the magnitude of the percentage depicts how expensive/cheap a trade will be relative to the time frame and profit/loss. Let us understand this with an example.

The average values in 4H and 1D are 26.65% and 9.73%, respectively. The percentage in the 4H time frame is greater than the percentage in the 1D time frame. This means that the total cost for both is the same ($4.91), but relative to the generated profit, it is higher in the 4H time frame. A detailed reason for this can be given from the trading range table.

In the trading range table, the corresponding values are $11.52 and $31.55. This can be interpreted as, an average of $11.52 will be generated in trading the 4H time frame, and $31.55 when trading the 1D time frame. The fee in both cases is the same. Thus, we infer that the fee that is paid to generate $31.55, the same fee is deducted for generating $11.52. And hence, this is exactly what the higher percentage value depicts.

Reading through the row, the percentage values for a time frame is highest in the minimum column and least in the maximum column. So, if you’re are able to deal with higher volatility, it is ideal to trade when the volatility is around the average or maximum values. And if you cannot deal with the high volatility, you may trade the higher time frames to reduce the relative costs.

Categories
Forex Assets

AUD/RON – What Should You Know Before Trading This Exotic Pair?

Introduction

The abbreviation of AUD/RON is Australian Dollar paired with Romanian Leu. Here AUD is the official currency of Australia and is also to be the fifth most traded currency in the Forex market. While RON stands for The Romanian leu, and it is the currency of Romania.

Understanding AUD/RON

In AUD/RON currency pairs, the first currency (AUD) is the base currency, and the second currency (RON) is the quote currency. In the Foreign Exchange market, we always buy the base currency and simultaneously sell the quote currency and vice versa. Here, the market value of AUD/RON helps us to understand the strength of RON against the AUD. So if the exchange rate of the pair AUD/RON is 2.9141, it means to buy1 AUD we need 2.9141 RON.

Spread

Forex brokers charge some commission on the trade we open, and that depends on the ask and the bid price by the broker. Spread is the difference between this Ask and Bid price. Every broker has different ask and bid prices. Below is the spread charges for ECN and STP brokers for AUD/RON pair.

ECN: 33 pips | STP: 35 pips

Fees

A Fee is the charges that we traders pay to the broker for opening a trade. This fee depends on the type of broker we use (STP/ECN).

Slippage

When we want to execute a trade at a particular market rate, but instead, the trade gets executed at a different rate. This is because of slippage. Slippage can take place at any time, but mostly we can counter a volatile market, and when we execute a large order at the same time.

Trading Range in AUD/RON

As a trader, our main motive should be to know the market volatility and avoid losses. The trading range here will determine the amount of money we will win or lose in a given amount of time. ATR is a technical indicator that indicates the price movement in a currency pair. In the below table, we have the representation of the minimum, average, and maximum pip movement in a currency pair. We will evaluate it merely by using the ATR indicator combined with 200-period SMA.

Procedure to assess Pip Ranges

  1. Add the ATR indicator to your chart
  2. Set the period to 1
  3. Add a 200-period SMA to this indicator
  4. Shrink the chart so you can determine a significant period
  5. Select your desired timeframe
  6. Measure the floor level and set this value as the min
  7. Measure the level of the 200-period SMA and set this as the average
  8. Measure the peak levels and set this as Max.

AUD/RON Cost as a Percent of the Trading Range

The cost of trade depends on the broker type and varies based on the volatility of the market. The overall cost of trade includes spread, fees, and sometimes slippage if the volatility is more. To decrease the cost of the trade, we can use limit orders instead of market execution.

ECN Model Account

Spread = 33 | Slippage = 3 |Trading fee = 5

Total cost = Slippage + Spread + Trading Fee = 3 + 33 + 5 = 41

STP Model Account

Spread = 35| Slippage = 3 | Trading fee = 0

Total cost = Slippage + Spread + Trading Fee = 3 + 35 + 0 = 38

Trading the AUD/RON

AUD/RON is an exotic currency pair. As we can see, the average pip movement in 1hr is 127, which shows the volatility is very high. Note, the higher the volatility, the higher is the risk and lower is the cost of the trade and vice versa.

Taking an example, we can see from the trading range that when the pip movement is lower, the charge is high, and when the pip movement is high, the charge is low. AUD/RON must be traded with proper risk management because of its volatile nature. If we have our strategy with adequate risk management, we can trade in a volatile market too.

Categories
Forex Assets

Trading The EOS/USD Crypto-Fiat pair & Understanding The Costs Involved

Introduction

EOS is a blockchain-based cryptocurrency, as well as a platform for decentralized app execution. This blockchain was developed despite the existence of Bitcoin and Ethereum to solve the problem of speed and scalability.

Understanding EOS/USD

The price of EOS/USD represents the value of the US Dollar equivalent to one EOS. It is quoted as 1 EOS per X USD. So, if the market price of EOS/USD is 2.5290, these many dollars are required to buy one EOS.

EOS/USD specifications

Spread

The difference between the bid & ask prices is known as spread. It changes with the execution model used brokers. Below are the spreads for both ECN & STP models for EOS/USD pair.

Spread on ECN: 10 pips | Spread on STP: 13 pips

Fee

A Fee is basically the commission on the trade. Note that there is a fee on ECN accounts, not STP.

Slippage

Due to high market volatility and the broker’s slower execution speed, slippage occurs. It is a difference in the price intended by the trader and price executed by the broker.

Trading Range in EOS/USD

The trading range is basically a tabular representation of the pip movement in EOS/USD for different timeframes. These numbers can be used traders as a risk management tool as determines the approx. profit/loss that can be made on a trade.

Procedure to assess Pip Ranges

  1. Add the Average True Range indicator to your price chart
  2. Then set the period to one
  3. Add a 200-period Simple Moving Average to this indicator
  4. You can assess a large time period by shrinking the price chart
  5. Select your desired timeframe
  6. Measure the floor level and set this value as the min
  7. Measure the level of the 200-period SMA and set this as the average
  8. Measure the peak levels and set this as Max.

EOS/USD Cost as a Percent of the Trading Range

The total cost comprising of the spread, slippage, and trading fee, changes with the volatility of the market. Hence, it is necessary for traders to position themselves to avoid paying high costs.

Below is a table representing the variation in the costs for different values of volatility.

ECN Model Account

Spread = 10 | Slippage = 3 |Trading fee = 5

Total cost = Slippage + Spread + Trading Fee = 3 + 10 + 5 = 18

STP Model Account

Spread = 13 | Slippage = 3 | Trading fee = 0

Total cost = Slippage + Spread + Trading Fee = 13 + 3 + 0 = 16

Trading the EOS/USD

The volatility and liquidity in this pair are similar to coins like Bitcoin and Ethereum. Hence, this makes EOS/USD a tradable pair. The spread in this pair is between 10-15 pips, which is extremely less compared to its volatility. Due to this, the costs reduce significantly. The highest cost percentage is only 18%.

However, we cannot ignore the fact about the volatility in this pair. This pair is pretty volatile and must be traded cautiously. It is recommended for traders to trade when the volatility of the market is around the average values. Furthermore, the costs can be reduced even further by placing orders as a limit or stop instead of the market. In doing so, the slippage will become zero and will reduce the total cost of the trade.

Categories
Forex Assets

Analyzing The BCH/USD Crypto-Fiat Pair

Introduction

BCH/USD is a cryptocurrency abbreviated for the Bitcoin Cash against the US Dollar. This is the highest traded cryptocurrency in terms of volume. Also, it is a 24/7 market. Note that, Bitcoin Cash is not the same Bitcoin; both are two different cryptocurrencies.

Understanding BCH/USD

The price of BCH/USD represents the value of the US Dollar that makes up one Bitcoin Cash. It is quoted as 1 BCH per X USD. For example, if the value of BCH/USD is 234.06, these many US Dollars are required to purchase one Bitcoin Cash.

BCH/USD Specifications 

Spread

Spread is the difference between the bid and the ask price. Spread is different with different brokers and the type of execution model they use. Below are the ECN & STP values for the BCH/USD pair.

Spread on ECN: 400 pips (4.00 USD) | Spread on STP: 450 pips (4.50 USD)

Fee

A Fee is a commission paid on each position a trader takes and closes. This fee is charged only by ECN brokers. The slippage for each lot traded is a pip. The seems to be less because one lot accounts for only 1 BCH.

Slippage

Slippage is the difference between the price demanded by the trader and the price given by the broker. There are two reasons for slippage to occur:

  • High market volatility
  • Broker’s execution speed

Trading Range in BCH/USD

A Trading range is the representation of the volatility in BCH/USD for different timeframes. The numbers help in determining the approximate risk and reward on a trade.

Procedure to assess Pip Ranges

  1. Add the ATR indicator to your chart
  2. Set the period to 1
  3. Add a 200-period SMA to this indicator
  4. Shrink the chart so you can assess a large time period
  5. Select your desired timeframe
  6. Measure the floor level and set this value as the min
  7. Measure the level of the 200-period SMA and set this as the average
  8. Measure the peak levels and set this as Max.

BCH/USD Cost as a Percent of the Trading Range

A Fee is a variable that varies as the volatility of the market changes. Below are tables depicting the variation in the costs with the change in the volatility.

ECN Model Account

Spread = 400 | Slippage = 10 |Trading fee = 1

Total cost = Slippage + Spread + Trading Fee = 10 + 400 + 1 = 411

STP Model Account

Spread = 450 | Slippage = 10 | Trading fee = 0

Total cost = Slippage + Spread + Trading Fee = 10 + 450 + 0 = 460

Trading the BCH/USD

As mentioned, BCH/USD is currently the most traded cryptocurrency in the market. Therefore, one can expect enough volatility and liquidity. The volatility in BCH/USD is very high. For example, the minimum volatility on the 1H timeframe is 20, while the maximum is 118 on the same timeframe, which is five times the minimum. Hence, this makes this pair highly volatile and risky as well.

So, it is ideal for traders to trade when the volatility is between the average values. The volatility during such times is neither too high nor too low. Also, the costs aren’t too high. If traders wish to reduce costs even further, they could trade via limit or stop orders instead of market orders, as this would completely cut the slippage on the trade. The cost variations when the trades are executed either by limit or stop is given below.

ECN Model Account (Using Limit Orders)

Spread = 400 | Slippage = 0 |Trading fee = 1

Total cost = Slippage + Spread + Trading Fee = 0 + 400 + 1 = 401

Categories
Forex Assets

Asset Analysis – Exploring The ‘GBP/BND’ Exotic Pair

Introduction

The abbreviation of GBP is the Great British Pound, and this currency is mostly known as pound sterling across the globe. It is one of the most-traded currencies in the Forex market and stands at the fourth position right after USD, EUR, & JPY. Whereas the abbreviation of BND is the Brunei Dollar, and it has been the currency of the Sultanate of Brunei since 1967. The Monetary Authority of Brunei Darussalam issues the Brunei Dollar.

GBP/BND

In the Forex market, currencies of the two countries are paired for being exchanged in reference to each other. GBP/BND is the abbreviation for the Pound Sterling against The Brunei Dollar. In this case, the first currency (GBP) is the base currency, and the second (BND) is the quote currency. The GBP/BND is classified as an exotic-cross currency pair.

Understanding GBP/BND

In the Forex, one currency is quoted against the other. To find out the relative value of one currency, we need another currency to compare. If the value of the base currency goes down, the value of the quote currency goes up and vice versa.

The market value of GBP/BND determines the strength of BND against the GBP. This can be easily understood as 1GBP is equal to how much BND. So if the exchange rate for the pair GBP/BND is 1.7660, it means 1GBP is equal to 1.7660 BND.

Spread

Forex brokers set two different prices for the currency pairs – Bid & Ask prices. Here the ‘bid’ price is at which we can sell the base currency, and the ‘ask’ price is at which we can buy the base currency. The difference between the ask and the bid price is called spread. The spread is how brokers make their money. Some brokers, instead of charging a separate fee for trading, they already have the fees inbuilt in the form of spread. Below are the ECN & STP spread values for GBP/BND Forex pair.

ECN: 12 pips | STP: 15 pips

Fees

A Fee is simply the commission we pay to the broker each time we execute a position. There is no fee on STP account models, but a few pips of the trading fee is charged on ECN accounts.

Slippage

Slippage refers to the difference between the expected price at which the trader wants to execute the trade and the price at which the trade gets executed. The slippage can occur at any time but mostly happens when the market is fast-moving and volatile in nature. Slippage also occurs when we place a large number of orders at the same time.

Trading Range in GBP/BND

The amount of money we will win or lose in a given time can be assessed by using the trading range table. It is a representation of the minimum, average, and maximum pip movement in a currency pair. This can be evaluated easily by using the ART indicator combined with 200-period SMA.

Procedure to assess Pip Ranges

  1. Add the ATR indicator to your chart
  2. Set the period to 1
  3. Add a 200-period SMA to this indicator
  4. Shrink the chart so you can assess a significant period
  5. Select your desired timeframe
  6. Measure the floor level and set this value as the min
  7. Measure the level of the 200-period SMA and set this as the average
  8. Measure the peak levels and set this as Max.

GBP/BND Cost as a Percent of the Trading Range

The cost of trade mostly depends on the type of broker we chose and also varies based on market volatility. This is because the total cost involves slippage and spreads apart from the trading fee. Below is the representation of the cost variation in terms of percentages. The comprehension of it is discussed in the following sections.

ECN Model Account

Spread = 12 | Slippage = 3 |Trading fee = 5

Total cost = Slippage + Spread + Trading Fee = 3 + 12 + 5 = 20

STP Model Account

Spread = 15 | Slippage = 3 | Trading fee = 0

Total cost = Slippage + Spread + Trading Fee = 3 + 15 + 0 = 18

Trading the GBP/BND

The GBP/BND is an exotic-cross currency pair and it is typically a Ranging market. The average pip movement of this pair on the 1H timeframe is 55 pips. Since the market is ranging, the volatility is less and the trading costs are relatively high while trading the GBP/BND pair. Always remember that cost of trade increases as the volatility decreases and vice versa.

Conservative traders who don’t mind spending more on trading fees can trade this pair on all the timeframes as the volatility is moderate. Comprehending the above tables, we should note that the costs on the trade are high when the volatility is less. But traders who don’t prefer spending more on trading costs can trade this pair when the volatility of the market is around the maximum values. Cheers!

Categories
Forex Assets

Everything About The EUR/RUB Forex Asset

Introduction

The EUR/RUB is the abbreviation of the Euro Area’s Euro against the Russian Ruble. This is an exotic-cross currency pair. The volatility and volume in this pair are good enough for traders to day trade this currency. Here, the EUR is the base currency, and the RUB is the quote currency.

Understanding EUR/RUB

The price in the exchange market of the EUR/RUB specifies the value of RUB that is needed to purchase one Euro. It is quoted as 1 EUR per X RUB. For example, if the value of EUR/RUB is 85.769, this much of Rubles are required to buy one Euro.

Spread

The price of buying is not the same as the price for selling. One must pay the ask price for buying and bid price for selling. And the difference between the bid price and the ask price is called the spread. This value varies based on the type of execution model used by the broker.

ECN: 42 pips | STP: 44 pips

Fees

Like in the stock market where you pay commission on both sides of your trade, in the forex market as well, you must pay few pips of fee for your trade. This could be between 5-10 pips. Note that the fee on STP accounts is nil.

Slippage

Due to the volatility in the market and the broker’s execution speed, there is a difference in the price at which you execute the trade and price, which is actually given by the broker. This is known as slippage.

Trading Range in EUR/RUB

The depiction of the minimum, average, and maximum volatility in the market for different timeframes is given in the below table. These values help us in assessing the risk of trade for a specified time frame.

Procedure to assess Pip Ranges

  1. Add the ATR indicator to your chart
  2. Set the period to 1
  3. Add a 200-period SMA to this indicator
  4. Shrink the chart so you can assess a large time period
  5. Select your desired timeframe
  6. Measure the floor level and set this value as the min
  7. Measure the level of the 200-period SMA and set this as the average
  8. Measure the peak levels and set this as Max.

EUR/RUB Cost as a Percent of the Trading Range

The cost of trade changes as the volatility of the market also changes. In the below tables, we have illustrated the cost variation in the trade-in different timeframes and volatilities for both ECN and STP model account.

ECN Model Account
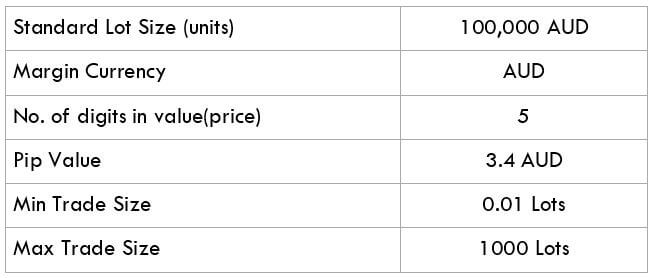
Spread = 42 | Slippage = 3 |Trading fee = 3

Total cost = Slippage + Spread + Trading Fee = 3 + 42 + 3 = 48

STP Model Account
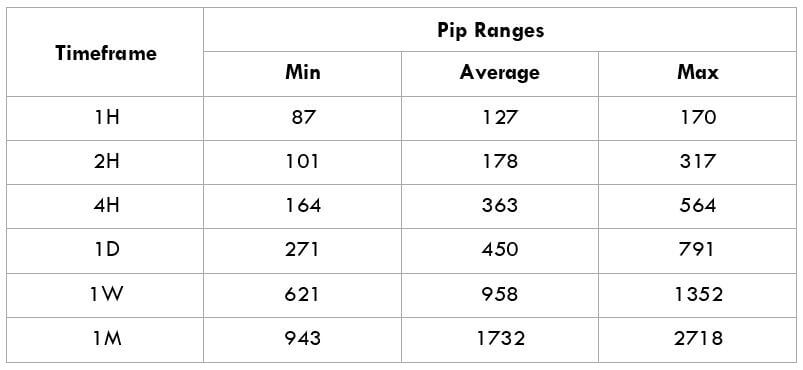
Spread = 44 | Slippage = 3 | Trading fee = 0

Total cost = Slippage + Spread + Trading Fee = 3 + 44 + 0 = 47

Trading the EUR/RUB

The EUR/RUB is one of the most traded exotic-cross currency pairs. The volatility in this pair is pretty high. However, a retail trader can still trade it.

Consider the above two volatility tables. We can see that the values are large in the min column and small in the max column. This means that the costs are more when the volatility is low, and less when the volatility is high.

Traders looking to trade with low cost can consider trading when the volatility is high. And traders who need low volatility will have to bear higher costs. There are traders who look for a balance between the two. Such traders can trade when the volatility of the market is around the average values. This will ensure enough volatility as well as low costs.

Another simple way to reduce cost is by placing orders using limit and stop instead of the market. This will take away the slippage on the trade. Hence, this will reduce the total cost of the trade. So, in our example, the total cost will reduce by three pips.

Categories
Forex Assets

EUR/MXN – Analyzing The Costs Involved While Trading This Exotic Pair

Introduction

EUR/MXN is the abbreviation for the Euro Area’s euro against the Mexican Peso. It is classified as an exotic-cross currency pair. Here, the EUR is the base currency, and the MXN is the quote currency.

Understanding EUR/MXN

The market value of EURMXN determines the value of MXN that is required to buy one euro. It is quoted as 1 EUR per X MXN. So, if the market price of this pair is 24.4733, then these many units of Mexican pesos are required to buy one EUR.

Spread

The spread is the difference between the bid price and the ask price. These two prices are set by the brokers. The pip difference is through which brokers generate revenue.

ECN: 46 pips | STP: 49 pips

Fees

A fee is simply the commission you pay to the broker on each position you open. There is no fee on STP account models, but a few pips on ECN accounts.

Slippage

Slippage is the difference between the price at which the trader executed the trade and the price he actually got from the broker. This changes based on the volatility of the market and the broker’s execution speed.

Trading Range in EUR/MXN

The amount of money you will win or lose in a given amount of time can be assessed using the trading range table. This is a representation of the minimum, average, and maximum pip movement in a currency pair.

Procedure to assess Pip Ranges

  1. Add the ATR indicator to your chart
  2. Set the period to 1
  3. Add a 200-period SMA to this indicator
  4. Shrink the chart so you can assess a large time period
  5. Select your desired timeframe
  6. Measure the floor level and set this value as the min
  7. Measure the level of the 200-period SMA and set this as the average
  8. Measure the peak levels and set this as Max.

EUR/MXN Cost as a Percent of the Trading Range

The cost of trade varies based on the volatility of the market. This is because the total cost involves slippage and spreads apart from the trading fee. Below is the representation of the cost variation in terms of percentages. The comprehension of it is discussed in the coming sections.

ECN Model Account
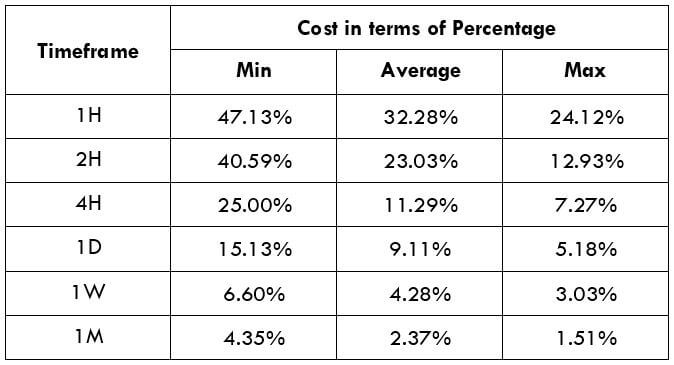
Spread = 46 | Slippage = 3 |Trading fee = 3

Total cost = Slippage + Spread + Trading Fee = 3 + 46 + 3 = 52

STP Model Account
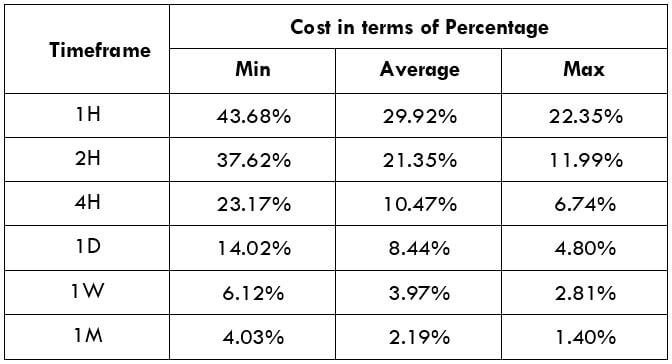
Spread = 49 | Slippage = 3 | Trading fee = 0

Total cost = Slippage + Spread + Trading Fee = 3 + 49 + 0 = 52

Trading the EUR/MXN

The EURMXN is a very volatile pair. For instance, the average pip movement on the 1H timeframe is only 335 pips. Note that the higher the volatility, the lower is the cost of the trade. However, this is not an advantage as it is risky to trade highly volatile markets.

Also, the larger/smaller the percentages, the higher/lower are the costs on the trade. So, we can infer that the costs are higher for low volatile markets and high for highly volatile markets.

To reduce your risk, it is recommended to trade when the volatility is around the minimum values. The volatility here is low, and the costs are a little high compared to the average and the maximum values. But, if you’re priority is towards reducing costs, you may trade when the volatility of the market is around the maximum values.

Advantage from Limit orders

When orders are executed as market orders, there is slippage on the trade. But, with limit orders, there is no slippage as such. Only trading fees and the spread will be taken into consideration to calculate the total costs. Hence, this will bring down the cost significantly.

Categories
Forex Assets

Costs Involved While Trading The EUR/CZK Forex Pair

Introduction

EUR/CZK is the abbreviation for the Euro Area’s euro against the Czech Koruna. This pair is an exotic-cross currency pair. Here, the EUR is the base currency, and the CZK is the quote currency.

Understanding EUR/CZK

The price of this pair in the exchange market determines the value of CZK equivalent to one euro. It is quoted as 1 EUR per X CZK. So, if the value of this pair is 26.0896, these many Korunas are required to purchase one EUR.


Spread

Spread is the difference between the bid and the ask price offered by the broker. This value is different on the ECN account model and STP account model. An approximate value for the two is given below.

ECN: 45 pips | STP: 47 pips

Fees

A fee is another term for the commission of the trade. There is no fee on STP accounts, but a few pips on ECN accounts.

Slippage

Slippage is the difference between the price intended by the trader and the price the trader actually received from the broker.

Trading Range in EUR/CZK

The trading range is the tabular representation of the pip movement of a currency pair in different timeframes. These values are useful for determining the profit that can be generated from a trade before-hand. To find the value, you must multiply the below volatility value with the pip value of this pair.

Procedure to assess Pip Ranges

  1. Add the ATR indicator to your chart
  2. Set the period to 1
  3. Add a 200-period SMA to this indicator
  4. Shrink the chart so you can assess a large time period
  5. Select your desired timeframe
  6. Measure the floor level and set this value as the min
  7. Measure the level of the 200-period SMA and set this as the average
  8. Measure the peak levels and set this as Max.

EUR/CZK Cost as a Percent of the Trading Range

This is the representation of the cost variation of trades for different timeframes and volatilities. The values are obtained by finding the ratio between the total cost and the volatility value and are expressed as a percentage.

ECN Model Account

Spread = 45 | Slippage = 3 |Trading fee = 3

Total cost = Slippage + Spread + Trading Fee = 3 + 45 + 3 = 51

STP Model Account
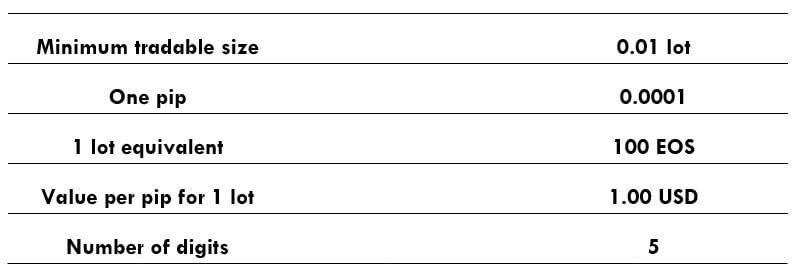
Spread = 47 | Slippage = 3 | Trading fee = 0

Total cost = Slippage + Spread + Trading Fee = 3 + 47 + 0 = 50

Trading the EUR/CZK

The larger the percentage values, the higher is the cost of the trade. From the above tables, we can see that the values are large in the min column and comparatively smaller in the max column. This means that the costs are high when the volatility of the market is low.

It is neither advisable to trade when the volatility of the market is high, nor when the costs are high. To have a balance between both these factors, it is ideal to trade when the volatility of the pair is in the range of the average values.

Furthermore, to reduce your costs even further, you may place trades using limit orders instead of market orders. In doing so, the slippage will not be included in the calculation of the total costs. And this will bring down the cost of the trades by a decent number. An example of the same is given below.

Spread = 45 | Slippage = 0 |Trading fee = 3

Total cost = Slippage + Spread + Trading Fee = 0 + 45 + 3 = 48

Categories
Forex Assets

Analyzing The EUR/PLN Exotic Currency Pair

Introduction

EUR/PLN is the abbreviation for the Euro Area’s euro against the Polish Zloty. This European currency is classified as an exotic-cross currency pair. In this pair, the EUR is the base currency, and the PLN is the quote currency.

Understanding EUR/PLN

The value of this pair simply represents the value of PLN equivalent to one Euro. It is quoted as 1 EUR per X PLN. An example of the same is shown below.

Spread

The spread is a popular terminology used in the forex industry, which is defined as the difference between bid and ask prices in the market. This is not the same on all brokers but varies based on the execution model they use.

ECN: 30 pips | STP: 34 pips

Fees

A Fee is similar to the commission that is paid to the brokers. Fee on ECN accounts is between 5-10 pips, while it is nil for STP accounts.

Slippage

Slippage is the difference between the price wanted by the client and the price they actually received from the broker. There is this difference due to two reasons:

  • Broker’s execution speed
  • Market volatility

Trading Range in EUR/PLN

A trading range is a table that represents the minimum, average, and maximum volatility of the market for various timeframes. With these pip movements from the past, we can determine the profit/loss that can be made from a trade.

Procedure to assess Pip Ranges

  1. Add the ATR indicator to your chart
  2. Set the period to 1
  3. Add a 200-period SMA to this indicator
  4. Shrink the chart so you can assess a large time period
  5. Select your desired timeframe
  6. Measure the floor level and set this value as the min
  7. Measure the level of the 200-period SMA and set this as the average
  8. Measure the peak levels and set this as Max.

EUR/PLN Cost as a Percent of the Trading Range

In calculating the total costs, spread and slippage are variables. These values change as the volatility of the market changes. And below, we have represented the variation of the costs by applying the values from the trading range table.

ECN Model Account

Spread = 30 | Slippage = 3 |Trading fee = 3

Total cost = Slippage + Spread + Trading Fee = 3 + 30 + 3 = 36

STP Model Account

Spread = 34 | Slippage = 3 | Trading fee = 0

Total cost = Slippage + Spread + Trading Fee = 3 + 34 + 0 = 37

Trading the EUR/PLN

Trading the EURPLN is not a hurdle. Though this pair is a major/minor currency pair, its characteristics are similar to that of majors/minors.

Firstly, the spread is around 30 pips, which are lower compared to other exotic-cross currencies involving EUR as the base currency. Secondly, the volatility of this pair is pretty decent. It is neither too high nor too low.

Coming to the above two tables, we can see that the percentage values are large in the min column and gets smaller as we move towards the max column. Since the values in the min column are significant, it is not advisable to trade this pair during low volatility. To have enough volatility with inexpensive costs, one may trade when the volatility is around the average values.

Placing orders through ‘limit’ and ‘stop’ would further decrease the costs. In doing so, the slippage on the trade will be nullified, and this will, in turn, bring down the total costs.

Categories
Forex Assets

Everything About EUR/TRY Forex Currency Pair

Introduction

EUR/TRY is the abbreviation for the Euro area’s euro against the Turkish Lira. This pair is classified as an exotic-cross currency pair. In this pair, EUR is the base currency, and TRY the quote currency.

Understanding EUR/TRY

The price of this pair determines the value of TRY, which is equivalent to one euro. It is quoted as 1 EUR per X TRY. For example, if the value of this pair is 6.5552, then about 6.5 Turkish Liras are required to purchase one euro.

EUR/TRY Specification

Spread

Spread is simply the difference between the bid price and the ask price in the market. This value is controlled by the brokers. This value varies on the type of execution model used for executing the trades.

Spread on ECN: 40 pips | Spread on STP: 44 pips

Fees

The fee in Forex is similar to the one that is pair to stockbrokers. Note that, there is no fee on STP accounts, but a few pips on ECN accounts.

Slippage

The slippage on a trade is the difference between the price that is demanded by the trader and the price that is actually executed by the broker. Market volatility and the broker’s execution speed are the reasons for slippage to occur.

Trading Range in EUR/TRY

A trading range is the representation of the minimum, average, and the maximum volatility of this pair on the 1H, 4H, 1D, 1W, and 1M timeframe. Using these values, we can assess our profit/loss margin of trade. Hence, this proves to be a helpful risk management tool for all types of traders.

Procedure to assess Pip Ranges

  1. Add the ATR indicator to your chart
  2. Set the period to 1
  3. Add a 200-period SMA to this indicator
  4. Shrink the chart so you can assess a large time period
  5. Select your desired timeframe
  6. Measure the floor level and set this value as the min
  7. Measure the level of the 200-period SMA and set this as the average
  8. Measure the peak levels and set this as Max.

EUR/TRY Cost as a Percent of the Trading Range

With the volatility values obtained from the above table, we can see how the cost varies as the volatility of the market varies. All we did is, got the ratio between the total cost and the volatility values and converted into percentages.

ECN Model Account 

Spread = 40 | Slippage = 3 | Trading fee = 3

Total cost = Spread + Slippage + Trading Fee = 40 + 3 + 3 = 46

STP Model Account

Spread = 44 | Slippage = 3 | Trading fee = 3

Total cost = Spread + Slippage + Trading Fee = 44 + 3 + 0 = 47

The Ideal way to trade the EUR/TRY

The EURTRY is a pair with enough volatility and liquidity. Hence, this makes it simpler to trade this exotic-cross currency.

From the above table, we can see that the percentage values are all within 200%. This means that the costs are low irrespective of the timeframe and volatility you trade.

Digging it a little deeper, the costs are higher when the volatility of the market is low and lower for higher volatilities. However, we cannot ignore the fact that this pair is highly volatile. For example, the maximum volatility on the 1H timeframe is as high as 456. So, traders must be cautious before trading this pair.

When it comes to the best time of the day to trade this pair, it is ideal for entering this pair during those times of the day when the volatility is in between the average values because this will ensure decent volatility as well as low costs.

Furthermore, traders can easily reduce their costs by placing orders as ‘limit’ and ‘stop’ instead of ‘market.’ In doing so, the slippage on the trade will not be considered in the calculation of the total costs. So, in our example, the total cost will reduce by three pips.

Categories
Forex Assets

Exploring The EUR/THB Exotic Currency Pair

Introduction

EUR/THB is the abbreviation for the Euro area’s euro against the Thai Baht. This pair is classified as an exotic currency pair. In this pair, EUR is the base currency, and THB is the quote currency.

Understanding EUR/THB

The market value of this pair represents the value of THB equivalent to one EUR. It is quoted as 1 EUR per X THB. For example, if the current market price of this pair is 35.345, these many units of THB are required to purchase one euro.

EUR/THB Specification

Spread

The algebraic difference between the bid and the ask price is referred to as the spread. Spread is determined by the brokers and varies based on the execution model they use.

Spread on ECN: 25 pips | Spread on STP: 28 pips

Fee

The fee is simply the commission paid on the trade. However, this fee is levied only on ECN accounts, not STP accounts.

Slippage

When you execute orders by market, the price you receive from the broker is different from the price you trigger your order. This happens solely due to the changes in the market volatility and the speed with which brokers execute the trades.

Trading Range in EUR/THB

The trading range is the representation of the range of pip movement in a currency pair. These pip values help in assessing the profit/loss in a trade, even before opening positions. In the below table, we have included six timeframes, ranging from 1H to 1M.

Procedure to assess Pip Ranges

  1. Add the ATR indicator to your chart
  2. Set the period to 1
  3. Add a 200-period SMA to this indicator
  4. Shrink the chart so you can assess a large time period
  5. Select your desired timeframe
  6. Measure the floor level and set this value as the min
  7. Measure the level of the 200-period SMA and set this as the average
  8. Measure the peak levels and set this as Max.

EUR/THB Cost as a Percent of the Trading Range

The cost as a percent of the trading range is the representation of the cost variation in the trade. The cost varies based on the volatility of the market. Having an idea of the cost variation, we can find our ideal times of day to trade in the market with reduced costs.

ECN Model Account
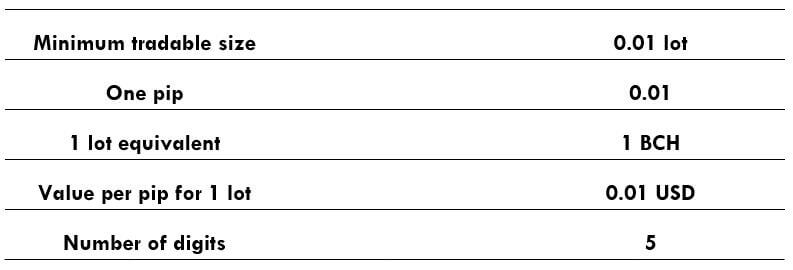
Spread = 25 | Slippage = 3 | Trading fee = 3

Total cost = Spread + Slippage + Trading Fee = 25 + 3 + 3 = 31

STP Model Account

Spread = 28 | Slippage = 3 | Trading fee = 0

Total cost = Spread + Slippage + Trading Fee = 28 + 3 + 0 = 31

The Ideal way to trade the EUR/THB

Before getting right into it, let’s comprehend the above tables. To analyze the tables, we consider the magnitude of the percentages. The higher the percentages, the higher is the cost of the trade. Conversely, lower percentages imply lower costs.

The costs in the min column are higher compared to the max column. This means that the costs are high when the volatility of the market is low, and the converse holds true as well.

The ideal way to trade this pair is completely dependent on the type of trader you are. For instance, if you are a trader looking for low costs, then you may trade when the volatility is high. Since the majority of the traders need a balance between the two, they may trade when the volatility of the market is somewhere around the average values in the trading range table.

Another simple technique to reduce costs is implementing strategies such that orders are executed using limit orders instead of market orders. In doing so, the slippage will be completely eradicated, and the total costs will be reduced by a decent number.

Categories
Forex Assets

Trading Costs Involved While Trading The EUR/SGD Exotic pair

Introduction

EUR/SGD is the abbreviation for the Euro area’s euro against the Singapore Dollar. This is one of the most traded exotic currency pairs in the world. In this pair, EUR is the base currency, and SGD is the quote currency.

Understanding EUR/SGD

The price of this pair represents the value of SGD, which is equal to one EUR. It is quoted as 1 EUR per X SGD. For example, if the value of this pair is 1.5552, then about 1.5 Singapore Dollars are required to purchase one euro.

EUR/SGD Specification

Spread

The spread is the difference between the bid and the ask price in the market. These two prices are set by the brokers. And it depends on the type of execution model used by the brokers.

Spread on ECN: 10 pips | Spread on STP: 11 pips

Fees

On ECN accounts, for every position you open, there is some fee involved with it. This is different for different brokers. However, on STP accounts, there is no fee as such.

Slippage

To put it in simple words, slippage is the difference between the trader’s demanded price and price given by the broker. The trader does not get his intended price due to two reasons – Broker’s execution speed & Market volatility

Trading Range in EUR/SGD

With the trading range table, we can assess our gain/loss on a trade in a given timeframe even before we open positions for it. This is done by considering the past volatility of the market.

Now, to determine the profit/loss on a trade, all you must do is, multiply the volatility value with the pip value ($7.25).

Procedure to assess Pip Ranges

  1. Add the ATR indicator to your chart
  2. Set the period to 1
  3. Add a 200-period SMA to this indicator
  4. Shrink the chart so you can assess a large time period
  5. Select your desired timeframe
  6. Measure the floor level and set this value as the min
  7. Measure the level of the 200-period SMA and set this as the average
  8. Measure the peak levels and set this as Max.

EUR/SGD Cost as a Percent of the Trading Range

This is an excellent application to the above volatility table. By considering the pip movement values, we can determine the cost variation of a trade as well. To do so, we find the ratio between the total cost and volatility value and convert it into percentages. Below are the cost variations for ECN and STP accounts models.

ECN Model Account 

Spread = 10 | Slippage = 3 | Trading fee = 3

Total cost = Slippage + Spread + Trading Fee = 3 + 10 + 3

Total cost = 16

STP Model Account

Spread = 11 | Slippage = 3 | Trading fee = 0

Total cost = Slippage + Spread + Trading Fee = 3 + 11 + 0

Total cost = 14

The Ideal way to trade the EUR/SGD

Comprehending the costs : Large/Small percentage -> High/Low costs

From the above the tables and the implications, we can conclude that costs are high when the volatility of the low and high when the volatility is low. And when it comes to the ideal way to trade this pair, conservative traders may trade it during those times when the volatility values are at or above the average values. This will ensure enough volatility as well as affordable costs. And other aggressive traders may trade during any of the extremes.

Also, traders can reduce their total costs by trading using limit orders and stop orders. Unlike the market orders, limit and stop orders do not include slippage on the trade. Hence, this will reduce costs considerably.

Categories
Forex Assets

Analyzing The USD/BND Forex Currency Pair

Introduction

USD/BND is the abbreviation for the US Dollar against the Brunei Dollar. Brunei is located on the Asian continent, and this pair is classified as an emerging currency pair. In the USD/BND, USD is the base currency, and BND is the quote currency.

Understanding USD/BND

The market price of this currency pair specifies the value of BND equivalent to one USD. It is quoted as 1 USD per X BND. For example, if the value of this pair is 1.3711, then these many units of the quote currency (BND) are required to purchase one unit of the base currency (USD).

Spread

The difference between the bid and the ask price is called the spread. The spread varies from broker to broker and also by execution model used.

ECN: 5 pips | STP: 8 pips

Fees

A fee is a synonym for commission. This is similar to the one that is paid to the stockbrokers. Below is the fee on ECN and STP brokers.

Fee on ECN – 0 pips | Fee on STP – 5-10 pips

Slippage

The difference between the price requested by you and the price you actually received from the broker is called slippage. There are two reasons for slippage to place:

  • Market volatility
  • Broker’s execution speed

Trading Range in USD/BND

A trading range is a tabular representation of the minimum, average, and the maximum volatility of this currency pair. And these values help in determining the profit/loss of a trade in a given timeframe. Hence, this is a great risk management tool for traders.

Procedure to assess Pip Ranges

  1. Add the ATR indicator to your chart
  2. Set the period to 1
  3. Add a 200-period SMA to this indicator
  4. Shrink the chart so you can assess a large time period
  5. Select your desired timeframe
  6. Measure the floor level and set this value as the min
  7. Measure the level of the 200-period SMA and set this as the average
  8. Measure the peak levels and set this as Max.

USD/BND Cost as a Percent of the Trading Range

The cost as a percent of the trading range is the representation of the cost variation in a trade for different volatilities are timeframes. This variation is represented as a percentage. The magnitude of these percentages depicts the highness and lowness of a trade.

ECN Model Account

Spread = 5 | Slippage = 3 |Trading fee = 3

Total cost = Slippage + Spread + Trading Fee = 3 + 5 + 3 = 11

STP Model Account

Spread = 8 | Slippage = 3 | Trading fee = 0

Total cost = Slippage + Spread + Trading Fee = 3 + 8 + 0 = 11

The Ideal way to trade the USD/BND

Trading the USD/BND is simple. This pair is not so volatile, like the other emerging pairs. Moreover, the spreads are low too.

From the above tables, we can see that the percentage values are pretty high in the minimum column, and comparatively lower in the max column. This means that the costs are high for low volatile markets and low for high volatile markets. So, traders who need high volatility may enjoy low costs. And trades who want to minimize their risk and trade low volatile markets will have to bear higher costs. Finally, traders who need a balance between the two may trade when the volatility of the market is around the average values. This will ensure the equilibrium between volatility and costs.

Moreover, there is a way through which you can cut off the slippage on your trade. Placing orders as limit orders instead of market orders will take away the slippage and bring down the total cost on the trade. So, in our example, the total cost would reduce by three pips.

We hope this article will change the way you trade this currency pair. Happy trading!

Categories
Forex Assets

Trading The USD/HRK Forex Currency Pair

Introduction

USDHRK is the abbreviation for the United States Dollar against the Croatian Kuna. Thw USDHRK is an emerging currency pair. Unlike the major/minor currency pair, this pair has high volatility and low liquidity. The volume is less too. Here, USD is the base currency, and HRK is the quote currency.

Understanding USD/HRK

The value of this pair determines the value of HRK equivalent to one USD. It is simply quoted as 1 USD per X HRK. For example, if the value of this pair is 6.6123, then 6.6123 Kuna is required to buy one US Dollar.

Spread

Spread is the way through which retail brokers make money from their clients. And it is through the difference between the bid price and the ask price in the market. This value is set by the brokers and varies from the type of execution model they use.

ECN: 25 pips | STP: 30 pips

Fees

A fee is basically the commission that you are liable to pay one each trade you make. This is similar to the one that is levied by stockbrokers. However, the fee is charged only by ECN brokers. There is no fee as such in STP accounts.

Slippage

In market orders, when you execute a trade, you don’t get the exact executed price. The actual executed price is different. This difference between the prices is what is known as slippage. Market volatility and the broker’s execution speed are two factors that affect the slippage on the trade.

Trading Range in USD/HRK

The minimum, average, and maximum volatility can be used to determine the risk of a trade. The profit/loss can be simply calculated by multiplying the volatility value with the pip value (per standard lot).

Procedure to assess Pip Ranges

  1. Add the ATR indicator to your chart
  2. Set the period to 1
  3. Add a 200-period SMA to this indicator
  4. Shrink the chart so you can assess a large time period
  5. Select your desired timeframe
  6. Measure the floor level and set this value as the min
  7. Measure the level of the 200-period SMA and set this as the average
  8. Measure the peak levels and set this as Max.

USD/HRK Cost as a Percent of the Trading Range

The total cost of the trade can be found as the sum of spread, slippage, and trading fee. This total cost is variable and is dependent on the volatility of the market. Below is the representation of the variation in the costs for different volatilities and timeframes.

ECN Model Account

Spread = 25 | Slippage = 3 |Trading fee = 3

Total cost = Slippage + Spread + Trading Fee = 3 + 25 + 3 = 31

STP Model Account

Spread = 30 | Slippage = 3 | Trading fee = 0

Total cost = Slippage + Spread + Trading Fee = 3 + 30 + 0 = 33

The Ideal way to trade the USD/HRK

The percentages in the above tables depict how the cost varies on the trade. The higher the value, the higher is the cost of the trade. Similarly, the smaller the percentages, the lower is the costs.

From the above tables, it can be ascertained that the costs are high for low volatilities, as the percentage values are high in the min column. And the costs are lower for high volatilities. So, the ideal way to trade this pair is dependent on the type of trader you are. For instance, a trader who is particular about costs may trade when the volatility of the currency pair is high. The traders who wish to keep a balance between the two may trade during those times when the volatility is around the average values.

Moreover, one may reduce their costs by trading using limit or stop orders instead of market orders. This will cut off the slippage factor on the trade and bring down the total costs pretty much. An example of the same is given below.

Spread = 25 | Slippage = 0 |Trading fee = 3

Total cost = Slippage + Spread + Trading Fee = 0 + 25 + 3 = 28

Categories
Forex Assets

Understanding The USD/INR Forex Currency Pair

Introduction

USD/INR is the abbreviation for the US Dollar against the Indian Rupee. This Asian pair is classified as an emerging currency pair. Here, the US Dollar is the base currency, and the INR is the quote currency.

Understanding USD/INR

The price in the market determines how much the Indian Rupee worth with respect to the US Dollar is. It is quoted as 1 USD per X INR. So, if the market price of USDINR is 71.46, then around ₹71 is required to purchase $1.

Spread

Spread in foreign exchange, is the difference between the bid and the ask price of the currency pair. This is the primary way through which brokers generate revenue. Spread is typically decided by the brokers itself. And it varies based on the type of execution model implemented by the brokers.

ECN: 19 pips | STP: 20 pips

Fees

Out of the two types of execution models, there is a fee, only on ECN accounts. Typically, there is no fee on STP accounts. However, this is compensated by higher spreads.

Slippage

Slippage is the difference between the price demanded by the user and the price he received by the broker. There is always this difference when orders are executed by the market. There are a couple of reasons for its occurrence.

  • Broker’s execution speed
  • Market’s volatility

Trading Range in USD/INR

The minimum, average, and maximum volatility of the currency pair in different timeframes are represented in the below trading range table. These values help us calculate the profit or loss that can be made in a given amount of time. Hence, this table is a great risk management tool.

 Procedure to assess Pip Ranges

  1. Add the ATR indicator to your chart
  2. Set the period to 1
  3. Add a 200-period SMA to this indicator
  4. Shrink the chart so you can determine a significant period
  5. Select your desired timeframe
  6. Measure the floor level and set this value as the min
  7. Measure the level of the 200-period SMA and set this as the average
  8. Measure the peak levels and set this as Max.

USD/INR Cost as a Percent of the Trading Range

The costs as a percent of the trading range are the representation of the variation of the costs for different volatilities and timeframes. Understanding this cost variation helps in determining the ideal times of the day to trade this currency pair, which shall be discussed in the subsequent sections.

ECN Model Account

Spread = 19 | Slippage = 3 |Trading fee = 3

Total cost = Slippage + Spread + Trading Fee = 3 + 19 + 3 = 25

STP Model Account

Spread = 20 | Slippage = 3 | Trading fee = 0

Total cost = Slippage + Spread + Trading Fee = 3 + 20 + 0 = 23

The Ideal way to trade the USD/INR

Before getting into it, let’s first comprehend the below tables. The greater the values of the percentage, the greater is the cost of the trade. Similarly, the lower the values, the lesser is the total cost of the trade. Also, costs are inversely proportional to the volatility of the market.

From the above tables, we can ascertain that the values are higher in the min column, and gradually increases in the up to the max column. This means that the costs are high when the volatility of the market is low. The costs are neither too high nor too low for average volatility. Hence, if you are a trader who requires moderate volatility and low costs, then you may trade when the volatility of the market is around the average values.

Note: The current volatility of the market can be obtained from the ATR indicator.

There is another way through which one can considerably reduce their costs. By executing trades via limit/stop orders instead of market orders, the slippage on the trade will be waived off from the total costs. This brings down the costs significantly. For example, if the slippage on the trade is five pips, then five pips will be reduced in calculating the total costs on the trade.

Categories
Forex Assets

Analyzing the USD/CNH Forex Currency Pair

Introduction

USDCNH is the tick symbol for the US Dollar versus the Chinese Yuan. This Asian currency pair is classified as an emerging currency pair. Here, the US Dollar is the base currency, and the CNH is the quote currency.

Understanding USD/CNH

The price of this pair as a whole determines the value of CNH equivalent to one USD. It is quoted as 1 USD per X CNH. For example, if the price of this pair currently is 6.4728, then these many Yuans are required to buy one US Dollar.

Spread

The spread is the difference between the bid price and the ask price of a currency pair. Since the bid and ask price is set by the brokers, spread varies from broker to broker. The approximate spread on ECN and STP accounts is given below.

ECN: 23 pips | STP: 24 pips

Fees

A fee is nothing but the commission that is paid to the broker on each trade. This, too, is different from broker to broker. The fee on STP accounts is nil, while there are few pips of fee for ECN accounts.

Slippage

Slippage is another type of fee which is applied for market orders. It is a pip difference between the price requested by the trader to be executed and the price that is actually given to the trade. There is this difference due to the market’s volatility and the broker’s execution speed.

Trading Range in USD/CNH

With the table given below, one can assess their risk on each trade. This table represents the range of pip values from minimum to maximum for different timeframes. Multiplying this with the value per pip yields the amount one will be risking on their trade.

Procedure to assess Pip Ranges

  1. Add the ATR indicator to your chart
  2. Set the period to 1
  3. Add a 200-period SMA to this indicator
  4. Shrink the chart so you can determine a large period
  5. Select your desired timeframe
  6. Measure the floor level and set this value as the min
  7. Measure the level of the 200-period SMA and set this as the average
  8. Measure the peak levels and set this as Max.

USD/CNH Cost as a Percent of the Trading Range

The trading range values can be used to determine the variation in the costs of the trade for different volatilities as well. Below are two tables (for ECN and STP) that depict how the cost varies as the volatility and timeframes are changed.

ECN Model Account

Spread = 23 | Slippage = 3 |Trading fee = 3

Total cost = Slippage + Spread + Trading Fee = 3 + 23 + 3 = 29

STP Model Account

Spread = 24 | Slippage = 3 | Trading fee = 0

Total cost = Slippage + Spread + Trading Fee = 3 + 24 + 0 = 27

The Ideal way to trade the USD/CNH

This currency pair is a little, unlike the other emerging currency pairs. As in, it has pretty good liquidity and volatility. It is comparable to a cross-currency pair. So, it can be traded in a similar way how to cross currencies are traded.

From the table, we can ascertain that the magnitude of the percentages is higher for lower volatilities and comparatively lower for high volatilities. And the median costs lie in an average column.

If you are a trader who requires low costs, then you will have to bear with the high volatility. Or if you’re a trader who needs low volatility, then you must be able to bear with high costs. Finally, traders who wish to have a balance between the two, then they may trade during those times when the volatility is around the average values (in the trading range table).

Inculcating strategies that require limit order and not market orders can help reduce costs significantly. This is because limit orders do not consider the slippage factor in calculating the total costs. That is, in our example, the total cost of each trade would reduce by three pips.

Categories
Forex Assets

Analyzing The USD/EGP Exotic Forex Currency Pair

Introduction

USDEGP is the abbreviation for the US Dollar against the Egyptian Pound. The USDEGP is classified under the emerging currency pairs, and the volatility in these pairs is quite high. In this pair, the US Dollar is the base currency and the EGP the quote currency.

Understanding USD/EGP

The price of USDEGP specifies the value of EGP equivalent to one USD. It is quoted as 1 USD per X EGP. So, if the market price of this pair is 15.673, then 15.673 units of EGP are required to purchase one US Dollar.

Spread

The difference between the bid and ask price is referred to as the spread. This value varies from broker to broker as well as how they execute the trade. The approximate spread on ECN and STP accounts is shown below.

ECN: 20 pips | STP: 21 pips

Fees

The fee is a commission that is to be paid to the broker for each trade you execute on an ECN account. On STP accounts, the fee is nil.

Slippage 

The price you receive from the broker is usually different from the price when you executed. And the difference between these two prices is referred to as the slippage. The factors affecting slippage include,

  • Market’s volatility
  • Broker’s execution speed

Trading Range in USD/EGP

The trading range is a tabular representation of the pip movement in a currency pair for different timeframes. With it, one can assess their risk on the trade for each given timeframe.

Procedure to assess Pip Ranges

  1. Add the ATR indicator to your chart
  2. Set the period to 1
  3. Add a 200-period SMA to this indicator
  4. Shrink the chart so you can assess a large period
  5. Select your desired timeframe
  6. Measure the floor level and set this value as the min
  7. Measure the level of the 200-period SMA and set this as the average
  8. Measure the peak levels and set this as Max.

USD/EGP Cost as a Percent of the Trading Range

As the name pretty much suggests, this is a trading range table that represents cost variations (in terms of percentage) for different timeframes and volatilities. These values are useful in determining the ideal times of the day to trade this pair.

ECN Model Account

Spread = 20 | Slippage = 3 |Trading fee = 3

Total cost = Slippage + Spread + Trading Fee = 3 + 20 + 3 = 26

STP Model Account
Spread = 21 | Slippage = 3 | Trading fee = 0

Total cost = Slippage + Spread + Trading Fee = 3 + 21 + 0 = 24

The Ideal way to trade the USD/EGP

In emerging currencies, the volatility is high, and the traded volume is low. So is it not ideal to enter the market any time during the day. So, let’s interpret the above tables and find the best times of the day to trade this currency pair.

The magnitude of the percentage is directly proportional to the cost of the trade. And since the percentage is higher in the min column, we can conclude that as the volatility increases, the cost reduces. However, our main aim is not only to reduce costs but to have good volatility and trading volume as well. Hence, to ensure both, it is ideal to trade when the volatility is at/above the average values in the volatility table.

Moreover, one can bring their costs slightly lower by trading using limit orders instead of market orders. This will cut off the slippage on the total cost of the trade. An example of the same is given below.

Categories
Forex Assets

Learning The Costs Involved While Trading The USD/RUB Pair

Introduction

USD/RUB is the tick symbol for the US Dollar against the Russian Ruble. This emerging currency pair has high volatility and usually low volume. Here, the US Dollar is the base currency, and the RUB is the quote currency.

Understanding USD/RUB

The price of this pair determines the value of RUB that’s equivalent to one US Dollar. It is quoted as 1 USD per X RUB. For example, if the market price of this pair was 68.69, then these many Rubles are required to purchase one US Dollar.

Spread

It is the difference between the bid price and ask price in the exchange market. This value is set by the brokers and varies from each other. Also, it varies on the type of execution model.

ECN: 21 pips | STP: 23 pips

Fees

This fee is levied by stockbrokers as well. The fee on ECN and STP account is given below.

ECN: 3-10 pips | STP: 0 pips

Slippage

The difference between the investor’s intended price and the real price executed by the broker is called slippage. Slippage happens solely due to the changes in the market’s volatility and speed with which the broker executes a trade.

Trading Range in USD/RUB

The trading range is a tabular illustration of the minimum, average, and maximum volatility in a currency pair for a given timeframe. Using these values, traders can quickly assess their risk on the trade for any of the given timeframes.

Procedure to assess Pip Ranges

  1. Add the ATR indicator to your chart
  2. Set the period to 1
  3. Add a 200-period SMA to this indicator
  4. Shrink the chart so you can assess a substantial period
  5. Select your desired timeframe
  6. Measure the floor level and set this value as the min
  7. Measure the level of the 200-period SMA and set this as the average
  8. Measure the peak levels and set this as Max.

USD/RUB Cost as a Percent of the Trading Range

Total cost is the sum of the slippage, spread, and the trading fee. This varies based on the volatility of the market. And below is a table that represents the cost variation for different volatilities.

ECN Model Account

Spread = 21 | Slippage = 3 |Trading fee = 3

Total cost = Slippage + Spread + Trading Fee = 3 + 21 + 3 = 27

STP Model Account

Spread = 23 | Slippage = 3 | Trading fee = 0

Total cost = Slippage + Spread + Trading Fee = 3 + 23 + 0 = 26

The Ideal way to trade the USD/RUB

Note that, the larger the value of the percentages, the higher is the cost on the trade and vice versa. The table clearly says the costs are high for low volatilities as the magnitudes of costs are high in the min column. But, it is not really ideal to trade in these extreme regions. To ensure decent volatility with comparatively low costs, it is ideal to trade this pair when the Volatility is around the average value in the trading range table.

We can see that slippage is a pretty heavy variable in the total costs. However, it can be nullified simply by placing orders using limit/stop orders rather than market orders. The drop in the total costs on the trade is represented in the below table as follows.

We can see, also that there are substantial costs when trading the USDRUB pair, even ion a daily timframe. That means that you will need to be right on direction and extension of the movement to be profitable, because, on an average trading range it would require about 12 hours of positive price movement to cover the trading costs. Therefore it is recommended to trade this exotic pair on swings of more than a week, to reduce the percent of the movement that is absorbed by the trade cost.


Categories
Forex Assets

Understanding The USD/PLN Exotic Currency Pair

Introduction

USD/PLN is the abbreviation for the US dollar against the Polish Zloty. It is an emerging currency pair in the forex market. The volatility in this pair is high, and the trading volume is less compared to major and cross currencies. In this pair, USD is the base currency, and PLN is the quote currency.

Understanding USD/PLN

The value of this pair determines the value of PLN that is equal to one US dollar. It is quoted as 1 USD per X PLN. For example, if the value of this pair is 3.8146, then around 4 PLN is required to buy one USD.

Spread

In forex, one of the most used terms is the spread. Spread is the difference between the bid price and the ask price of the market. This value is decided by the broker and varies from the type of account model.

ECN: 18 pips | STP: 21 pips

Fees

There is some fee on every trade you execute. And this, too, varies from type of account model. For instance, there is no fee on the STP account and a few pips on ECN accounts.

Slippage

Slippage occurs only on market orders. By definition, it is the difference between the trader’s required price for execution and the actual price the order was executed. This value depends on the broker’s execution speed and the market’s volatility.

Trading Range in USD/PLN

Assessing the profit that you can make and the loss that you can incur is a vital risk management tool. And below is a table that represents the minimum, average, and maximum volatility in different timeframes, which will help determine profit/loss values.

Procedure to assess Pip Ranges

  1. Add the ATR indicator to your chart
  2. Set the period to 1
  3. Add a 200-period SMA to this indicator
  4. Shrink the chart so you can determine a large period
  5. Select your desired timeframe
  6. Measure the floor level and set this value as the min
  7. Measure the level of the 200-period SMA and set this as the average
  8. Measure the peak levels and set this as Max.

USD/PLN Cost as a Percent of the Trading Range

An excellent application to the above table is the cost as a Percent of the Trading Range. The below tables illustrate how the cost varies based on the volatility of the market. And these values will help us an idea on the best times of the day to enter into this currency pair.

ECN Model Account

Spread = 18 | Slippage = 3 |Trading fee = 3

Total cost = Slippage + Spread + Trading Fee = 3 + 18 + 3 = 24

STP Model Account

Spread = 21 | Slippage = 3 | Trading fee = 0

Total cost = Slippage + Spread + Trading Fee = 3 + 21 + 0 = 24

The Ideal way to trade the USD/PLN

Before getting right into it, let us comprehend what the tables actually mean. The higher the value of the percentage, the higher is the cost of the trade and vice versa. From the table, we can clearly ascertain that the percentages are high in the first (min) column, indicating that the costs are high when the market volatility is low.

Now, talking the ideal time to trade this currency pair, you may trade this pair during those times when the volatility is above the average values. In doing so, you will be assured with sufficient volatility and low costs as well.

Furthermore, if you wish to reduce your costs much more, you may place orders using the limit/stop instead of the market. This will completely nullify the slippage on the trade and will, in turn, bring down the total costs significantly. As an example, the above table, when the slippage is made, is nil is illustrated below.

Categories
Forex Assets

Analyzing The USD/NOK Exotic Forex Currency Pair

Introduction

USD/NOK is the abbreviation for the US Dollar against the Norwegian Krone. This pair comes under the classification of exotic currency pairs. In this pair, USD is the base, and NOK is the quote currency.

Understanding USD/NOK

The value of USDNOK determines the value of NOK that is equivalent to one US Dollar. It is quoted as 1 USD per X NOK. So, if the market value of this pair is 9.2913, then these many units of Norwegian Krone are required to buy one US Dollar.

Spread

Spread is the difference between the bid price and the ask price in the market. This difference is the revenue for the brokers. Spread typically varies on how the broker executes the trades. The approximate spread on ECN and STP accounts is given below.

ECN: 13 pips | STP: 15 pips

Fees

The commission that a broker charges their clients is referred to as the fee. This is not constant and varies from broker to broker. The fee on ECN accounts is around 5-10 pips, and on STP accounts, it is nil.

Slippage

Slippage is the difference between the trader’s demanded price and the actual executed price. Market volatility and the broker’s execution speed are the reasons for slippage to occur.

Trading Range in USD/NOK

A trading range is the tabular representation of the minimum, average, and maximum pip movement in a currency pair. Below are the values of USDNOK that help us assess the profit/loss one can incur in a trade.

Procedure to assess Pip Ranges

  1. Add the ATR indicator to your chart
  2. Set the period to 1
  3. Add a 200-period SMA to this indicator
  4. Shrink the chart so you can determine a large time period
  5. Select your desired timeframe
  6. Measure the floor level and set this value as the min
  7. Measure the level of the 200-period SMA and set this as the average
  8. Measure the peak levels and set this as Max.

USD/NOK Cost as a Percent of the Trading Range

Here we take the ratio of the total cost on the trade and the volatility values and represent them in percentages. These percentages are then used to determine the cost variation in trade in different timeframes.

ECN Model Account

Spread = 13 | Slippage = 3 |Trading fee = 3

Total cost = Slippage + Spread + Trading Fee = 3 + 13 + 3 = 19

STP Model Account

Spread = 15 | Slippage = 3 | Trading fee = 0

Total cost = Slippage + Spread + Trading Fee = 3 + 15 + 0 = 18

The Ideal way to trade the USD/NOK

In this section, we interpret what the above percentages actually mean and how to make use of it.

The magnitude of the percentages represents how high or low are the costs of trade. So the higher the values, the higher is the cost and vice versa. From the table, it can be ascertained that the costs are pretty on the higher in the min column. This means that the costs are high when the market’s volatility is low. But it is not ideal to trade during these times due to high costs.

To have an equilibrium on costs as well as volatility, it is perfect for entering during those times when the volatility of the current market is around the average values.

Now, if you still wish to reduce your costs, you may trade using limit orders instead of market orders. This will completely nullify the slippage on the trade and hence bring down the total cost as well.

Categories
Forex Assets

Everything About The USD/MXN Forex Currency Pair

Introduction

USDMXN is the abbreviation for the US Dollar against the Mexican Peso. It is classified as an exotic currency pair that usually has high volatility and low trading volume. Here, the US Dollar (on the left) is the base currency, and the MXN (on the right) is the quote currency.

Understanding USD/MXN

The market price of USDMXN represents the value of MXN that are required to purchase to one US Dollar. It is quoted as 1 USD per X MXN. So, if the market price of this pair is 18.7615, then this amount of MXN is required to buy one USD.

Spread

The difference between the bid and the ask price is referred to as the spread. Its value varies from the type of execution model of the broker.

ECN: 16 pips | STP: 17 pips

Fees

For every position a client takes from the broker, he must pay some fee on each. Note that there is no fee on STP accounts. However, there are few pips of fees on ECN accounts.

Slippage

The difference between the price requested by the client and the price that was given by the broker is referred to as the slippage. Its value depends on the volatility of the market and the broker’s execution.

Trading Range in USD/MXN

Assessing the amount of money you will win and lose beforehand, in a particular timeframe is critical in trading. Below is a volatility table through which one can determine the minimum, average, and maximum profit/loss they can encounter in a specified timeframe.

Procedure to assess Pip Ranges

  1. Add the ATR indicator to your chart
  2. Set the period to 1
  3. Add a 200-period SMA to this indicator
  4. Shrink the chart so you can assess a large time period
  5. Select your desired timeframe
  6. Measure the floor level and set this value as the min
  7. Measure the level of the 200-period SMA and set this as the average
  8. Measure the peak levels and set this as Max.

USD/MXN Cost as a Percent of the Trading Range

By applying the total cost to the above table, we can even determine the cost variation in a trade. The ratio between the two expressed in percentage will help us determine the ideal times of the day to trade the currency pair.

ECN Model Account

Spread = 16 | Slippage = 3 |Trading fee = 3

Total cost = Slippage + Spread + Trading Fee = 3 + 16 + 3 = 22

STP Model Account

Spread = 17 | Slippage = 3 | Trading fee = 0

Total cost = Slippage + Spread + Trading Fee = 3 + 17 + 0 = 20

The Ideal way to trade the USD/MXN

Comprehending the above tables is simple. The percentage values are directly proportional to the total cost of the trade. It is seen that the percentages are comparatively high on the min column and vice versa. Now, coming to the ideal time to enter the market, it would be when the volatility of USDMXN is somewhere around the average pip movement. Trading in such moments will ensure low costs as well as lower liquidity.

Furthermore, you reduce costs by placing orders using limit/pending orders instead of market orders. This will significantly bring down the total costs as the slippage will be zero at this point in time. I hope this article will help you trade this pair in a much efficient way. Cheers!

Categories
Forex Assets

Understanding The USD/HKD Exotic Forex Pair

introduction

USDHKD is the abbreviation for the US dollar and the Hong Kong dollar. The USDHKD is an exotic currency pair. Exotics are pairs that are thinly traded in the foreign exchange markets and are not widely used in the global markets. One can expect high volatility and low volumes on this pair. Here, USD is referred to as base currency and HKD as the quote currency.

Understanding USD/HKD

The value of USDHKD represents the value of the Hong Kong dollar that is equivalent to one US dollar. It is quoted as 1USD per X HKD. For example, if the market price of USDHKD is 7.7684, then these many units of HKD are required to purchase one USD.

Spread

Spread is the difference between the bid price and the ask price of a currency pair. This value is set by the brokers, and it varies from different brokers. The type of execution model brings a variation in the spreads.

ECN: 5 | STP: 9

Fees

When you execute any trade through your brokers, there is a fee that has to be paid. The fee differs from brokers to brokers, as well as their execution type. Typically, there is no fee on STP accounts.

Slippage

Slippage is the difference between the trader’s intended price to execute a trade and the price he actually received from the broker. There is always this difference due to the volatility of the market and the broker’s execution speed. As a matter of fact, slippage is pretty high on exotic pairs.

Trading Range in USD/HKD

The trading range is the depiction of the minimum, average, and maximum pip movement of a currency pair. And these values help in assessing one’s risk on a trade. By finding the product of the volatility value with the pip valueyou can determine the profit or loss that can be incurred in a specified timeframe.

Procedure to assess Pip Ranges

  1. Add the ATR indicator to your chart
  2. Set the period to 1
  3. Add a 200-period SMA to this indicator
  4. Shrink the chart so you can determine a large time period
  5. Select your desired timeframe
  6. Measure the floor level and set this value as the min
  7. Measure the level of the 200-period SMA and set this as the average
  8. Measure the peak levels and set this as Max.

USD/HKD Cost as a Percent of the Trading Range

This calculation is an extremely helpful tool to analyze the cost variations in a trade. This table is basically a representation of the total cost variations in different timeframes and volatilities of the market. The costs are represented as a percentage of the range, and the magnitude of it depicts the cost of the trade.

ECN Model Account

Spread = 5 | Slippage = 5 |Trading fee = 1

Total cost = Slippage + Spread + Trading Fee = 5 + 5 + 1 = 11

STP Model Account

Spread = 9 | Slippage = 5 | Trading fee = 0

Total cost = Slippage + Spread + Trading Fee = 9 + 5 + 0 = 14

The Ideal way to trade the USD/HKD

Exotic pairs are expensive to trade when compared to major and minor currency pairs. However, it does not mean that one must completely avoid it. There are a few ways by which one can minimize the costs on the trade and take positions on it.

The higher the magnitude of the percentage, the higher is the cost of the trade. It is evident that the values are significant on the min column and comparatively small on the max column. Hence, costs are high for low volatilities markets and vice versa.

When it comes to picking the right time to enter the market, it is ideal to take positions when the volatility of the market is around the average values. From this, one can be guaranteed with affordable costs and decent volatility.

Slippage has a significant weight on the total cost of a trade. However, slippage can be wiped out. Trading using limit orders instead of market orders will take away the slippage on the trade. The next table displays the costs using limit orders.

Spread = 5 | Slippage = 0 |Trading fee = 1

Total cost = Slippage + Spread + Trading Fee = 5 + 0 + 1 = 6

Categories
Forex Assets

AUD/NZD – Everything About This Forex Currency Pair

Introduction

AUD/NZD is derived from the full-form of the currency pair, the Australian dollar, and the New Zealand dollar. It comes under the classification of cross currency pairs. In this pair, AUD is the base currency, and NZD is the quote currency.

Understanding AUD/NZD

The value of AUD/NZD depicts the value of NZD that is equivalent to AUD. It is simply quoted as 1 AUD per X NZD. For example, if the current value of this pair is 1.0405, then these many New Zealand dollars are needed to purchase one Australian dollar.

AUD/NZD Specification

Spread

Spreads are a typical way through which brokers make money. The pip difference between the bid price and the ask price is their profit margin, which is referred to as the spread. It varies from the type of account model.

ECN: 0.9 | STP: 1.8

Fees

The fee is basically the commission on a trade levied by the broker on each trade. Again, it varies from the type of account model.

Fee on STP = 0

Fee on ECN = 6 to 10 pips (starts from as low as one pip)

Slippage

The slippage is the difference between the broker’s executed price and the trader’s execution price. There is this variation as the order is executed using market execution. There are two reasons for slippage to take place.

  • Broker’s execution speed
  • Market’s volatility

Trading Range in AUD/NZD

Assessing the profit/risk is a great add-on to one’s trading analysis. With this, the trader can know how long he must before his trade performs. And below is the table that enables the analysis of it.

Procedure to assess Pip Ranges

  1. Add the ATR indicator to your chart
  2. Set the period to 1
  3. Add a 200-period SMA to this indicator
  4. Shrink the chart so you can assess a large time period
  5. Select your desired timeframe
  6. Measure the floor level and set this value as the min
  7. Measure the level of the 200-period SMA and set this as the average
  8. Measure the peak levels and set this as Max.

AUD/NZD Cost as a Percent of the Trading Range

This is one great application of the above table. By combining these values with the total cost of trade, one can determine variations in the costs by varying the parameters like volatility and timeframe.

ECN Model Account

Spread = 0.9 | Slippage = 2 |Trading fee = 1

Total cost = Slippage + Spread + Trading Fee = 2 + 0.9 + 1 = 3.9

STP Model Account

Spread = 1.8 | Slippage = 2 | Trading fee = 0

Total cost = Slippage + Spread + Trading Fee = 2 + 1.8 + 0 = 3.8

The Ideal way to trade the AUD/NZD

Before getting into finding the best way to trade this pair, let us comprehend what the above table has got to say.

The higher the magnitude of the percentages, the higher is the cost on the trade for that particular volatility and timeframe. The min column represents low volatility, and the max column represents high volatility.

It can clearly be ascertained from the table that the percentages are comparatively higher on the min column and lower on the max column. This means that the costs are high when volatility is low and vice versa.

But, it is not ideal to trade in neither of the two situations mentioned below.

When the volatility is high -> because of the risk involved
When the volatility is low -> because the costs are high

Now, to maintain a balance between all the parameters, it is best to trade when the pip movement is around the average values.

Furthermore, another simple way to reduce cost is by trading using a pending/limit order instead of market orders, as it will nullify the slippage on the trade. And this, in turn, will reduce the total cost of the trade as well.

Categories
Forex Assets

Asset Analysis – EUR/NZD Forex Currency Pair

Introduction

EURNZD is the abbreviation for the Euro area’s euro and the New Zealand dollar. It is classified under the minor/cross currency pairs. In EURNZD, EUR is the base currency pair, and NZD is the quote currency. As a matter of fact, in all currency pairs with euro in it, EUR is the base currency.

Understanding EUR/NZD

The value of this pair defines the New Zealand dollars required to purchase one euro. It is quoted as 1 EUR per X NZD. For example, if the value of value in the market is 1.6650, it implies that to buy one euro, the trader has to pay 1.6650 New Zealand dollars for it.

EUR/NZD Specification

Spread

Spread is a very popular term in the forex industry. This is the way through which the broker makes revenue. Spread is simply the difference between the bid price and the ask price. It differs from the type of account model. The spread on ECN and STP is given below.

ECN: 0.9 | STP: 1.7

Fees

For every position that a trader opens, there is some fee associated with it. And it depends on the type of account model. It is seen that there is no fee on STP accounts and a few pips on ECN accounts.

Slippage

Slippage is the difference between the price the trader had demanded and the actual price the trade was executed. Slippage happens when trades are taken using market orders. Slippage has a significant load on the total cost of the trade. More on this shall be discussed towards the end of this article.

Trading Range in EUR/NZD

A part of the analysis in trading is knowing the volatility of the market. Volatiltiy will give an close idea on the number of pips the currency pair will move in a given timeframe. The trading range depicts the minimum, average, and maximum pip movement in a specified time frame. Below are the values for EUNZD.

Procedure to assess Pip Ranges

  1. Add the ATR indicator to your chart
  2. Set the period to 1
  3. Add a 200-period SMA to this indicator
  4. Shrink the chart so you can assess a large time period
  5. Select your desired timeframe
  6. Measure the floor level and set this value as the min
  7. Measure the level of the 200-period SMA and set this as the average
  8. Measure the peak levels and set this as Max.

EUR/NZD Cost as a Percent of the Trading Range

Cost as a percent of the trading range represents the cost percentage that a trader is bearable for each trade they take. The percentage is obtained by finding the ratio between the total cost and volatility. With these percentage values, we come into the conclusion of the best time to enter and exit the market with minimal costs.

ECN Model Account 

Spread = 0.9 | Slippage = 2 | Trading fee = 1

Total cost = Slippage + Spread + Trading Fee = 2 + 0.9 + 1 = 3.9

STP Model Account

Spread = 1.7 | Slippage = 2 | Trading fee = 0

Total cost = Slippage + Spread + Trading Fee = 2 + 1.7 + 0 = 3.7

The Ideal way to trade the EUR/NZD

By analyzing the percentages obtained above, we can find ways to reduce risk and cost on every trade of EURNZD. Firstly, the percentage tells the cost variation for different volatilities in different timeframes. The values are large in the first (Min) column. Meaning, the costs are high in the min column. Also, since this column represents low volatility, it implies that costs are high when the volatility is low and vice versa. In the average column, the costs are neither too high nor too low. And the volatility is under balance as well. Hence, this turns out to be the ideal time to trade in the market.

Moreover, another feasible technique to reduce cost is by placing limit orders. By the use of limit orders, a trader will eradicate the existence of slippage on the trade, and, in turn, reduce the total cost on the trade considerably. An example of the same is given below.

Comparing this table with the previous table, it is evident that the percentages have almost halved. Hence, entering and exiting trades using limit orders can prove to be very advantageous to reduce costs on trade.