Introduction
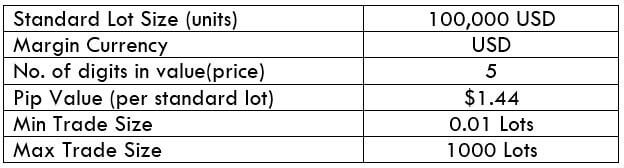
USDCNH is the tick symbol for the US Dollar versus the Chinese Yuan. This Asian currency pair is classified as an emerging currency pair. Here, the US Dollar is the base currency, and the CNH is the quote currency.

Understanding USD/CNH
The price of this pair as a whole determines the value of CNH equivalent to one USD. It is quoted as 1 USD per X CNH. For example, if the price of this pair currently is 6.4728, then these many Yuans are required to buy one US Dollar.
Spread
The spread is the difference between the bid price and the ask price of a currency pair. Since the bid and ask price is set by the brokers, spread varies from broker to broker. The approximate spread on ECN and STP accounts is given below.
ECN: 23 pips | STP: 24 pips
Fees
A fee is nothing but the commission that is paid to the broker on each trade. This, too, is different from broker to broker. The fee on STP accounts is nil, while there are few pips of fee for ECN accounts.
Slippage
Slippage is another type of fee which is applied for market orders. It is a pip difference between the price requested by the trader to be executed and the price that is actually given to the trade. There is this difference due to the market’s volatility and the broker’s execution speed.
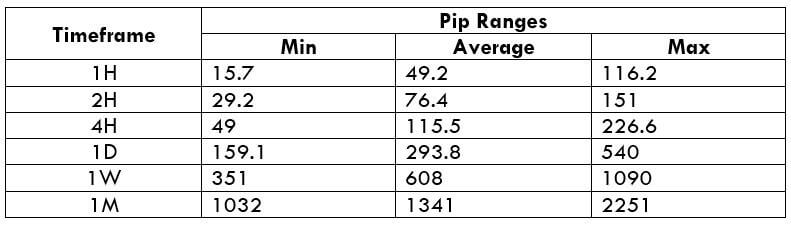
Trading Range in USD/CNH
With the table given below, one can assess their risk on each trade. This table represents the range of pip values from minimum to maximum for different timeframes. Multiplying this with the value per pip yields the amount one will be risking on their trade.
Procedure to assess Pip Ranges
- Add the ATR indicator to your chart
- Set the period to 1
- Add a 200-period SMA to this indicator
- Shrink the chart so you can determine a large period
- Select your desired timeframe
- Measure the floor level and set this value as the min
- Measure the level of the 200-period SMA and set this as the average
- Measure the peak levels and set this as Max.
USD/CNH Cost as a Percent of the Trading Range
The trading range values can be used to determine the variation in the costs of the trade for different volatilities as well. Below are two tables (for ECN and STP) that depict how the cost varies as the volatility and timeframes are changed.
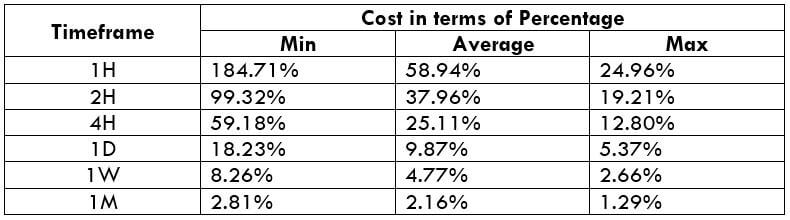
ECN Model Account
Spread = 23 | Slippage = 3 |Trading fee = 3
Total cost = Slippage + Spread + Trading Fee = 3 + 23 + 3 = 29
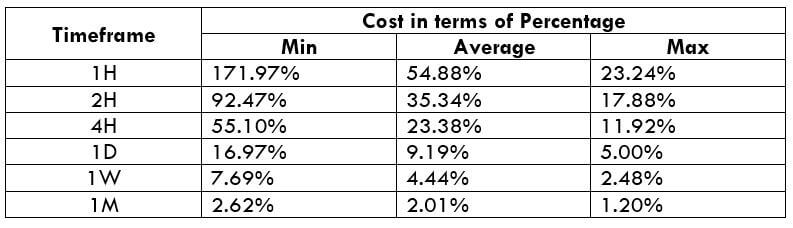
STP Model Account
Spread = 24 | Slippage = 3 | Trading fee = 0
Total cost = Slippage + Spread + Trading Fee = 3 + 24 + 0 = 27
The Ideal way to trade the USD/CNH
This currency pair is a little, unlike the other emerging currency pairs. As in, it has pretty good liquidity and volatility. It is comparable to a cross-currency pair. So, it can be traded in a similar way how to cross currencies are traded.
From the table, we can ascertain that the magnitude of the percentages is higher for lower volatilities and comparatively lower for high volatilities. And the median costs lie in an average column.
If you are a trader who requires low costs, then you will have to bear with the high volatility. Or if you’re a trader who needs low volatility, then you must be able to bear with high costs. Finally, traders who wish to have a balance between the two, then they may trade during those times when the volatility is around the average values (in the trading range table).
Inculcating strategies that require limit order and not market orders can help reduce costs significantly. This is because limit orders do not consider the slippage factor in calculating the total costs. That is, in our example, the total cost of each trade would reduce by three pips.