Introduction
USD/INR is the abbreviation for the US Dollar against the Indian Rupee. This Asian pair is classified as an emerging currency pair. Here, the US Dollar is the base currency, and the INR is the quote currency.

Understanding USD/INR
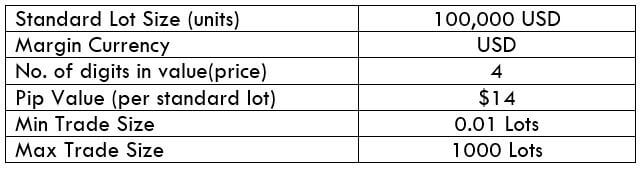
The price in the market determines how much the Indian Rupee worth with respect to the US Dollar is. It is quoted as 1 USD per X INR. So, if the market price of USDINR is 71.46, then around ₹71 is required to purchase $1.
Spread
Spread in foreign exchange, is the difference between the bid and the ask price of the currency pair. This is the primary way through which brokers generate revenue. Spread is typically decided by the brokers itself. And it varies based on the type of execution model implemented by the brokers.
ECN: 19 pips | STP: 20 pips
Fees
Out of the two types of execution models, there is a fee, only on ECN accounts. Typically, there is no fee on STP accounts. However, this is compensated by higher spreads.
Slippage
Slippage is the difference between the price demanded by the user and the price he received by the broker. There is always this difference when orders are executed by the market. There are a couple of reasons for its occurrence.
- Broker’s execution speed
- Market’s volatility
Trading Range in USD/INR
The minimum, average, and maximum volatility of the currency pair in different timeframes are represented in the below trading range table. These values help us calculate the profit or loss that can be made in a given amount of time. Hence, this table is a great risk management tool.
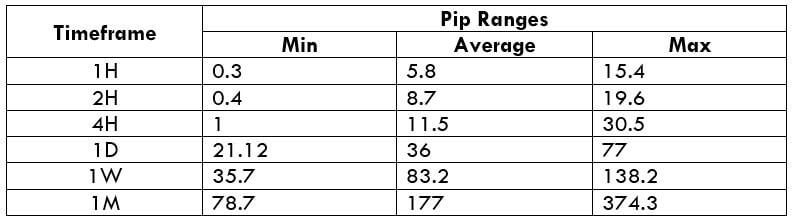
Procedure to assess Pip Ranges
- Add the ATR indicator to your chart
- Set the period to 1
- Add a 200-period SMA to this indicator
- Shrink the chart so you can determine a significant period
- Select your desired timeframe
- Measure the floor level and set this value as the min
- Measure the level of the 200-period SMA and set this as the average
- Measure the peak levels and set this as Max.
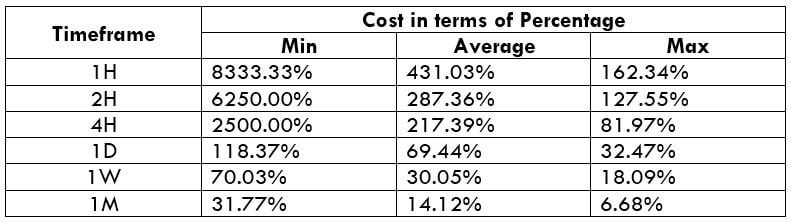
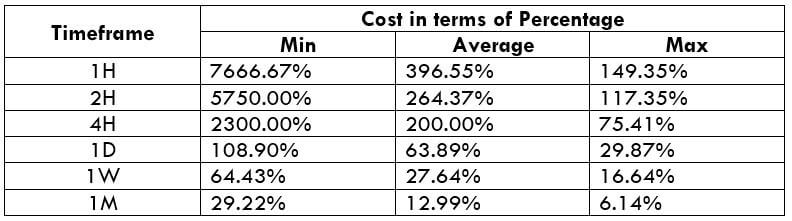
USD/INR Cost as a Percent of the Trading Range
The costs as a percent of the trading range are the representation of the variation of the costs for different volatilities and timeframes. Understanding this cost variation helps in determining the ideal times of the day to trade this currency pair, which shall be discussed in the subsequent sections.
ECN Model Account
Spread = 19 | Slippage = 3 |Trading fee = 3
Total cost = Slippage + Spread + Trading Fee = 3 + 19 + 3 = 25
STP Model Account
Spread = 20 | Slippage = 3 | Trading fee = 0
Total cost = Slippage + Spread + Trading Fee = 3 + 20 + 0 = 23
The Ideal way to trade the USD/INR
Before getting into it, let’s first comprehend the below tables. The greater the values of the percentage, the greater is the cost of the trade. Similarly, the lower the values, the lesser is the total cost of the trade. Also, costs are inversely proportional to the volatility of the market.
From the above tables, we can ascertain that the values are higher in the min column, and gradually increases in the up to the max column. This means that the costs are high when the volatility of the market is low. The costs are neither too high nor too low for average volatility. Hence, if you are a trader who requires moderate volatility and low costs, then you may trade when the volatility of the market is around the average values.
Note: The current volatility of the market can be obtained from the ATR indicator.
There is another way through which one can considerably reduce their costs. By executing trades via limit/stop orders instead of market orders, the slippage on the trade will be waived off from the total costs. This brings down the costs significantly. For example, if the slippage on the trade is five pips, then five pips will be reduced in calculating the total costs on the trade.