Introduction
The CAD/INR pair is considered an exotic currency pair where CAD is the Canadian Dollar, while the INR is the Indian Rupee. This article will cover the basic elements of the CAD/INR pair that you should know before you start trading the pair.
In this pair, the CAD is the base currency, while the INR is the quote currency. Therefore, the price attached to the CAD/INR pair is the amount of INR that can be bought by 1 CAD. For example, if the price of CAD/INR is 55.059, it means that for every 1 CAD, you can get 55.059 INR.
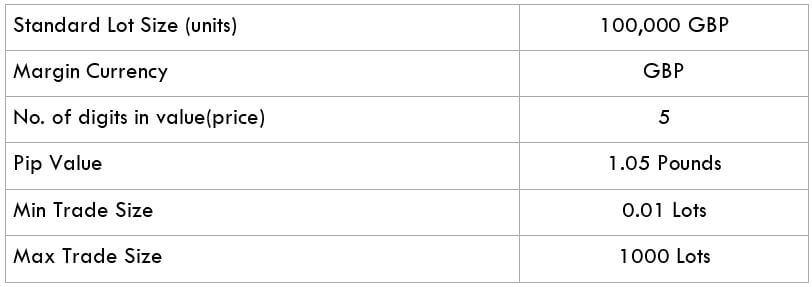
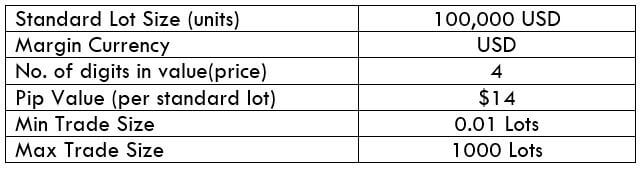
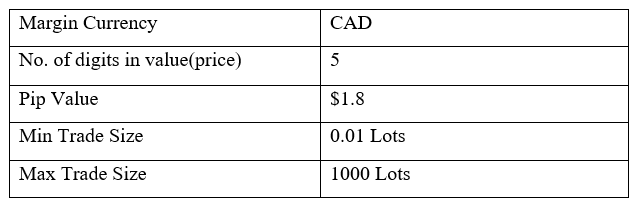
CAD/INR Specification
Spread
The price at which you can buy a currency pair is different from the price at which you can sell the same pair. This difference is the spread. The spread is considered a source of revenue for brokers and a trading cost for forex traders. The spread for the CAD/INR pair is as follows.
ECN: 39 pips | STP: 44 pips
Fees
The trading fee is the commission you pay your forex broker for every trade you make. STP accounts usually have no trading fees, while the fees charged on ECN accounts vary from broker to broker.
Slippage
Slippage represents the difference between the price at which you place a trade and the price at which your broker will execute the trade. Market volatility and the broker’s efficiency determine the amount of slippage.
Trading Range in the CAD/INR Pair
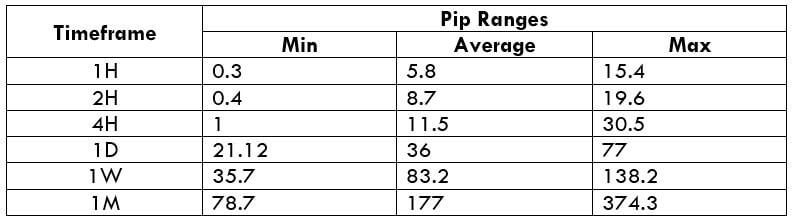
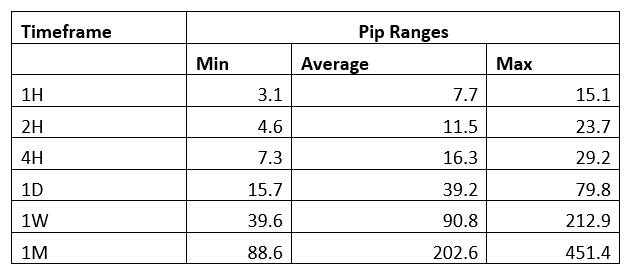
The trading range in forex helps a trader analyze the extent of a currency pair’s fluctuation during a specific timeframe. As measured in pips, this fluctuation can help determine the volatility of the pair and the expected gains or losses. For example, if in the 4-hour timeframe the CAD/INR pair has a volatility of 30 pips, a trader can expect to either gain or lose $54 since the value of 1 pip is $1.8
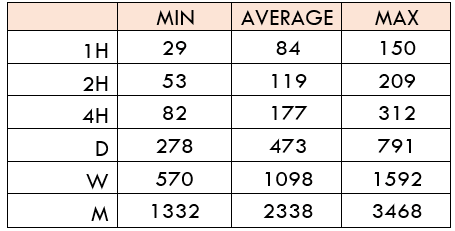
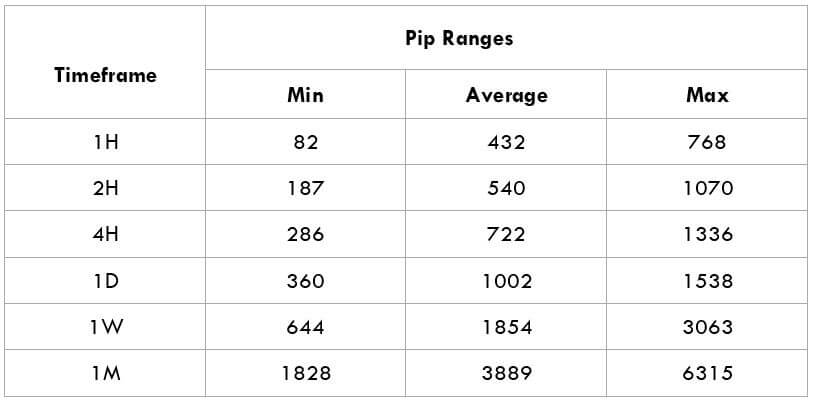
The table below shows the minimum, average, and maximum volatility of CAD/INR across different timeframes.
The Procedure to assess Pip Ranges
- Add the ATR indicator to your chart
- Set the period to 1
- Add a 200-period SMA to this indicator
- Shrink the chart so you can determine a larger period
- Select your desired timeframe
- Measure the floor level and set this value as the min
- Measure the level of the 200-period SMA and set this as the average
- Measure the peak levels and set this as Max.
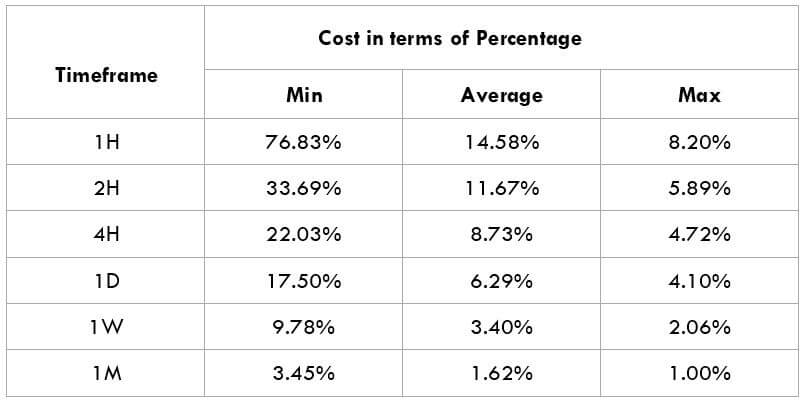
CAD/INR Cost as a Percentage of the Trading Range
The knowledge of the potential costs when trading helps determine the trading strategies to be used. Cost as a percentage of the trading range will help us understand how trading costs vary with volatility under different timeframes.
Total cost = Slippage + Spread + Trading Fee
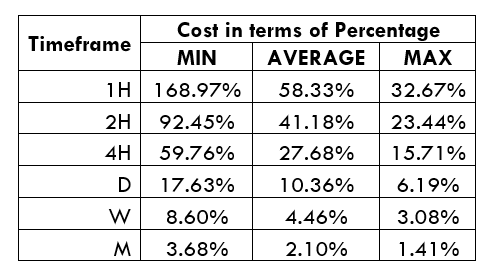
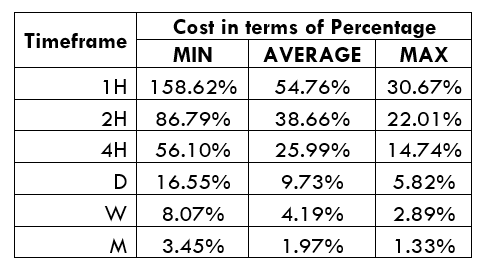
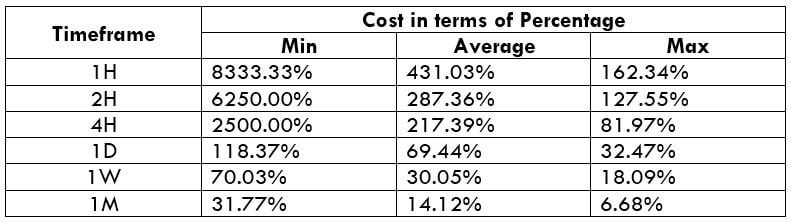
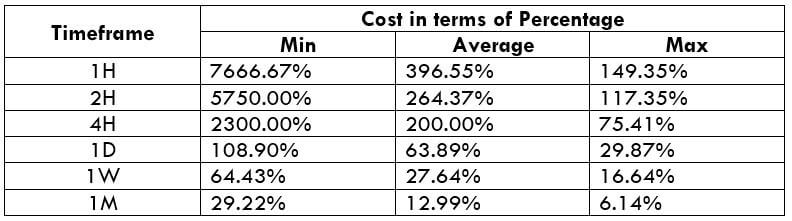
The tables below show the analyses of percentage costs in both ECN and STP accounts.
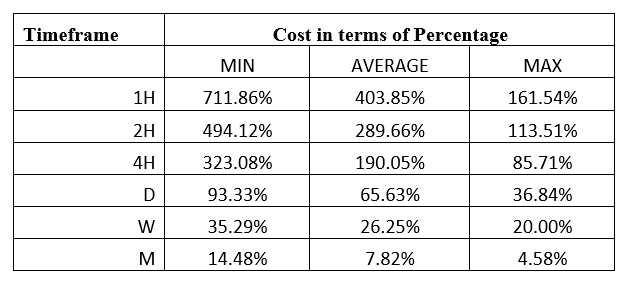
ECN Model Account
Spread = 39 | Slippage = 2 | Trading fee = 1
Total cost = 42
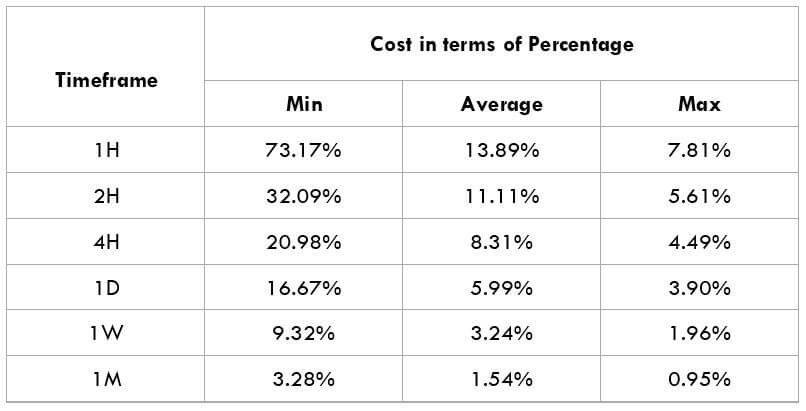
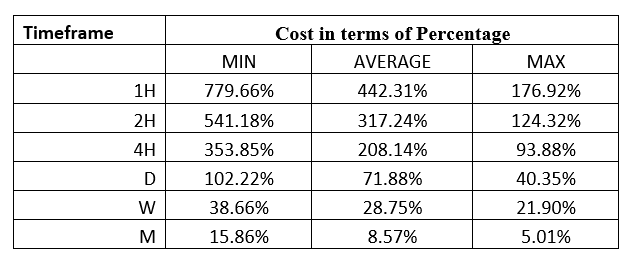
STP Model Account
Spread = 44 | Slippage = 2 | Trading fee = 0
Total cost = 46
The Ideal Timeframe to Trade CAD/INR
Depending on your forex trading style, you can use the above analysis to coincide with your trade of the CAD/INR pair with moments of lower trading costs. The 1-hour timeframe for the STP and the ECN accounts has the highest trading costs of 779.66% and 711.86% of the trading range, respectively. Also, notice that the highest costs coincide with the lowest volatility of 3.1 pips.
Trading longer timeframes like the 1-week and the 1-month timeframes are associated with lower costs. However, trading when the CAD/INR pair’s volatility is above average has a lower cost. Another way of reducing trading costs is by using the limit order types, which eliminates the slippage costs. Here’s how it works.
Total cost = Slippage + Spread + Trading fee
= 0 + 39 + 1 = 40

When limit orders are used, the slippage cost becomes zero. Consequently, the trading costs are significantly reduced, with the highest trading cost dropping from 711.86% to 677.97% of the trading range.