Introduction
GBP Pound sterling, also known as the pound, is the official currency of the United Kingdom. It is very well known, and in fact, it is the fourth most-traded currency in the Forex market. INR (Indian rupee) is the official currency of India. This currency is controlled and managed by the Reserve Bank of India.
GBP/INR
In the Forex market, one currency is always quoted against the other as the currencies are trades in pairs. GBP/INR represents the trading of the Pound sterling against the Indian rupee. In this case, the first currency (GBP) is the base, and the second (INR) is the quote currency. The GBP/INR is classified as exotic-cross currency pair.
Understanding GBP/INR
To find out the relative value of one currency, we need another currency to compare. If the value of the base currency goes down, the value of the quote currency goes up and vice versa.
The market value of GBPINR determines the strength of INR against the GBP. This can be easily understood as 1GBP is equal to how much INR. So if the exchange rate for the pair GBP/INR is 94.034, it means 1GBP is equal to 94.034 INR.
Spread
Forex brokers have two different prices for currency pairs: the bid and ask price. The bid price is the selling price, and ask is the buy price. The difference between the ask and the bid price is called the spread. The spread is how brokers make their money. Below are the spreads for GBP/INR currency pair in both ECN & STP brokers.
ECN: 55 pips | STP: 57 pips
Fees
A Fee is simply the commission we pay to the broker each time we execute a position. There is no fee on STP account models, but a few pips on ECN accounts.
Slippage
Slippage refers to the difference between the trader’s expected price and the actual price at which the trade is executed. It can occur at any time but mostly happens when the market is fast-moving and volatile. Also, sometimes slippage occurs when we place a large number of orders at the same time.
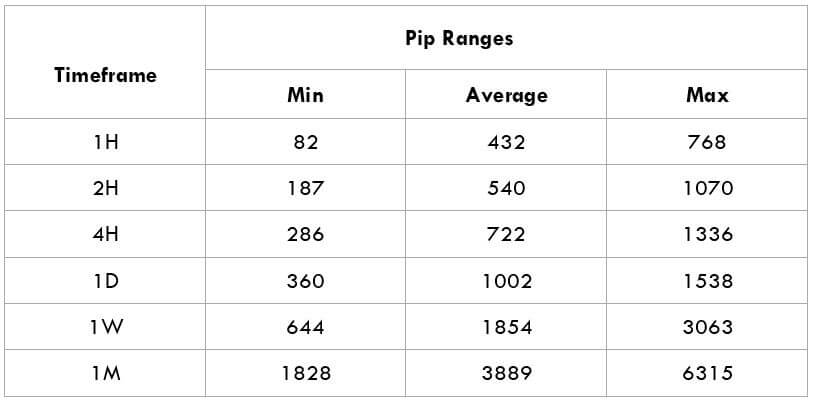
Trading Range in GBP/INR
The amount of money we will win or lose in a given amount of time can be assessed using the trading range table. It is a representation of the minimum, average, and maximum pip movement in a currency pair. This can be evaluated simply by using the ART indicator combined with 200-period SMA.
Procedure to assess Pip Ranges
- Add the ATR indicator to your chart
- Set the period to 1
- Add a 200-period SMA to this indicator
- Shrink the chart so you can assess a significant period
- Select your desired timeframe
- Measure the floor level and set this value as the min
- Measure the level of the 200-period SMA and set this as the average
- Measure the peak levels and set this as Max.
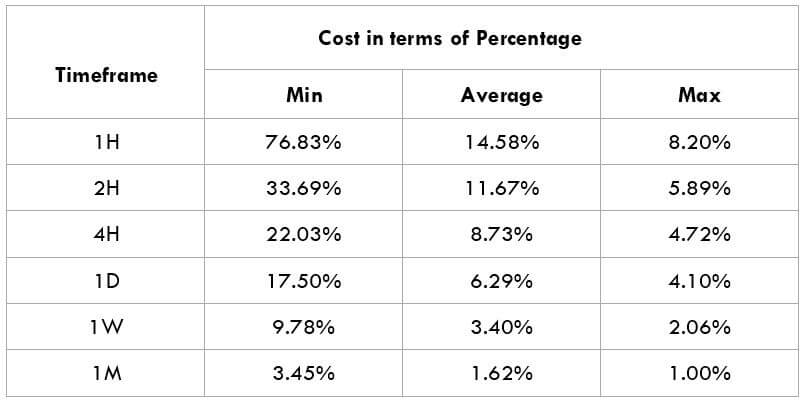
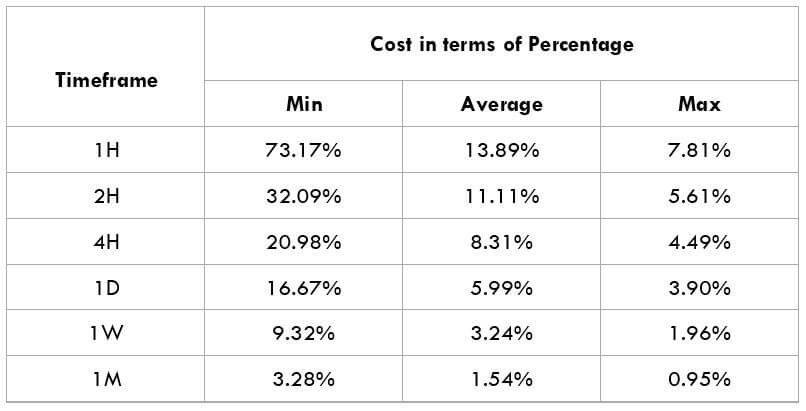
GBP/INR Cost as a Percent of the Trading Range
The cost of trade mostly depends on the broker and varies based on the volatility of the market. This is because the total cost involves slippage and spreads apart from the trading fee. Below is the representation of the cost variation in terms of percentages. The comprehension of it is discussed in the following sections.
ECN Model Account
Spread = 55 | Slippage = 3 |Trading fee = 5
Total cost = Slippage + Spread + Trading Fee = 3 + 55 + 5 = 63
STP Model Account
Spread = 57 | Slippage = 3 | Trading fee = 0
Total cost = Slippage + Spread + Trading Fee = 3 + 57 + 0 = 60
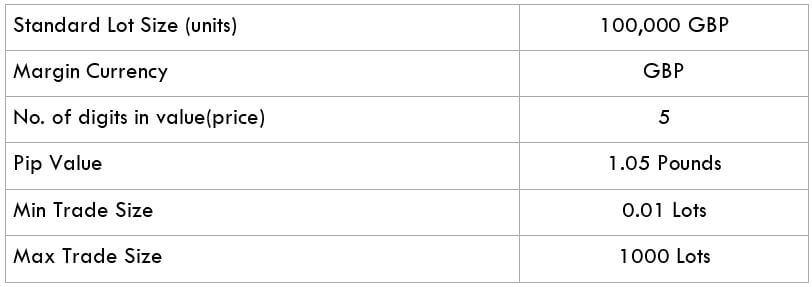
Trading the GBP/INR Exotic pair
The GBP/INR is an exotic-cross currency pair and is volatile in nature. For instance, the average pip movement on the 1H timeframe of this pair is about 432 pips. From the above tables, it is clear that the higher the volatility, the lower is the cost of the trade. However, this is not an advantage as it is risky to trade when the markets are highly volatile.
While reading the above tables, if the percentages are larger, higher are the costs on the trade. Likewise, if the percentages are small, lower are the costs. So, this can be interpreted as the trading costs are higher for low volatile markets and lower for high volatile markets.
It is always recommended to trade when the volatility is around the minimum values. Because at min values, the volatility is low, and the costs are a little high compared to the average and maximum values. But, if your priority is towards reducing costs, you may trade when the volatility of the market is around the average values. Cheers!