Introduction
AUD/INR is an exotic currency pair in the forex market, with the AUD representing the Australian Dollar and the INR representing the Indian Rupee. Here, the AUD is the base currency, and the INR is the quote currency. That means that the AUD/INR price represents the amount of INR which 1AUD can buy. For example, let’s say that the price of the AUD/INR is 52.2654. It means that 1 AUD can buy 52.2654 INR.
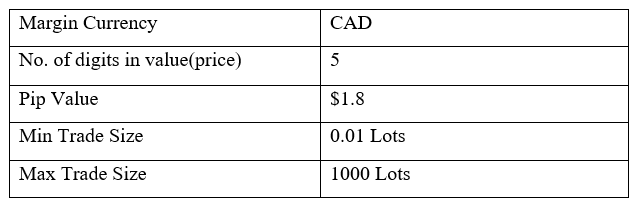
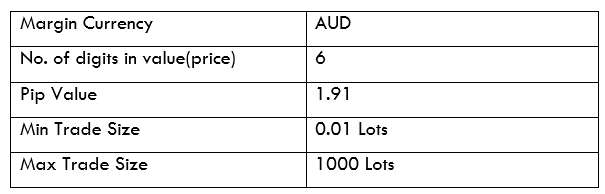
AUD/INR Specification
Spread
When you go long in forex trading, you have to buy the currency pair from your forex broker. Now, if you decide to sell back the pair to the broker, they will buy it at a lower price than they sold to you. The difference between these two prices – also known as “bid” and “ask” – is the spread.
The spread for the AUD/INR pair is:
ECN: 20 pips | STP: 25 pips
Fees
Some brokers charge a commission for positions opened using ECN accounts. They vary depending on the size of the trade. STP accounts are rarely charged any trading fees.
Slippage
Slippage in Forex is the difference between the execution price of a market order and the price at which that order was placed. The slippage comes about due to increased market volatility or inefficiency on the part of your broker.
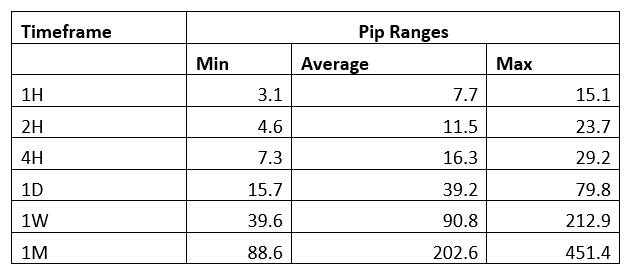
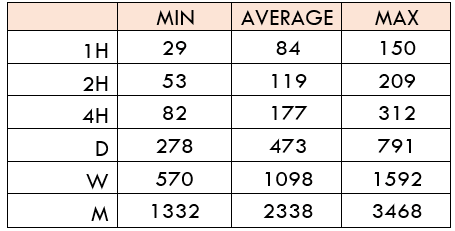
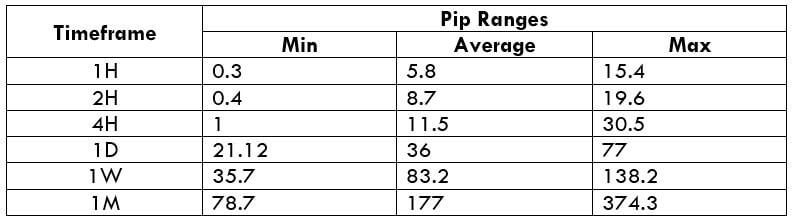
Trading Range in the AUD/INR Pair
When a currency pair fluctuates, its volatility varies across different timeframes. The analysis of this volatility in different timeframes is done using the trading range. It can help the trader identify the most suitable timeframes for a particular currency pair.
The trading range is expressed in pips. It shows the value of pips you stand to gain or lose on various timeframes.
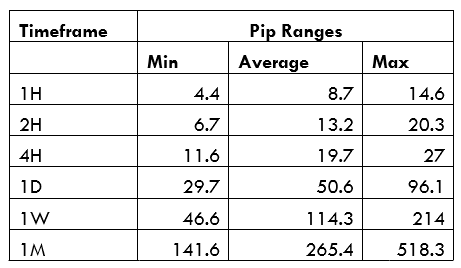
The Procedure to assess Pip Ranges
- Add the ATR indicator to your chart.
- Set the period to 1
- Add a 200-period SMA to this indicator
- Shrink the chart so you can determine a larger period
- Select your desired timeframe
- Measure the floor level and set this value as the min
- Measure the level of the 200-period SMA and set this as the average
- Measure the peak levels and set this as Max.
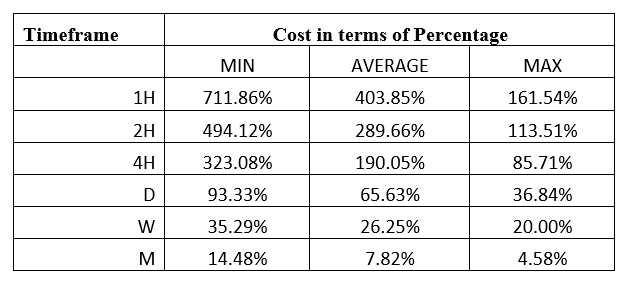
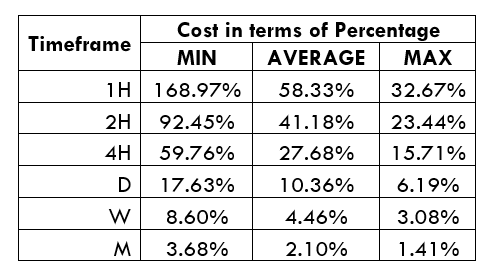
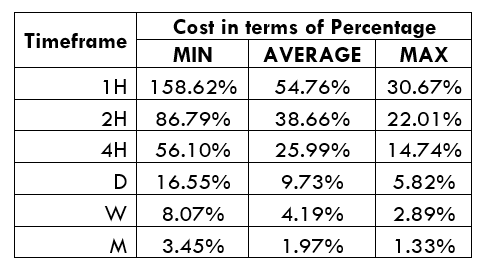
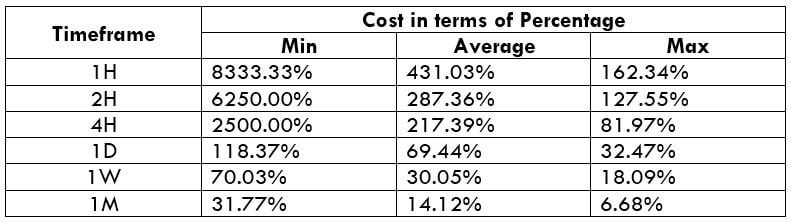
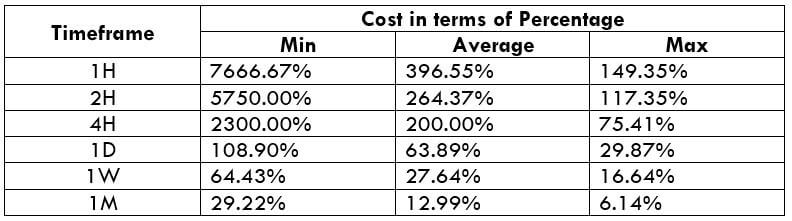
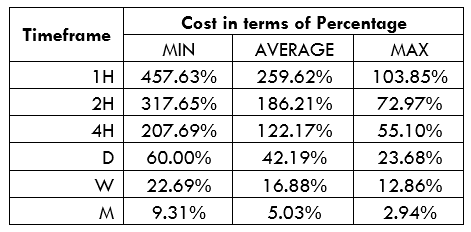
AUD/INR Cost as a Percentage of the Trading Range
Expressing the total trading costs of a currency pair as a percentage of the trading range helps to understand the trading costs that pair on multiple timeframes. It shows how the trading costs change with volatility.
Below are the trading costs for the AUD/INR pair on ECN and STP accounts.
ECN Model Account Costs
Spread = 20 | Slippage = 2 | Trading fee = 1
Total cost = 23

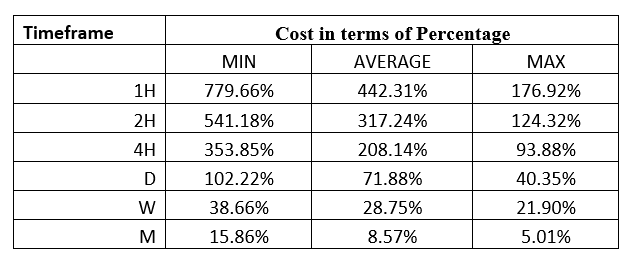
STP Model Account
Spread = 25 | Slippage = 2 | Trading fee = 0
Total cost = 27
The Ideal Timeframe to Trade AUD/INR Pair
From the above analyses, we can observe that the lowest trading costs of the AUD/INR pair are on longer timeframes. The lowest trading costs for both the ECN and the STP accounts are when the AUD/INR volatility is at the highest – 518.3 pips. While the shorter timeframes have higher trading costs, intraday traders can take advantage of the maximum volatility periods during these timeframes.
Furthermore, traders can reduce the trading costs by implementing forex limit orders instead of market orders, which are prone to slippages. Here is an example of how the limit orders remove the slippage costs.
ECN Account Using Limit Model Account
Total cost = Slippage + Spread + Trading fee
= 0 + 20 + 1 = 21

You can notice that the forex limit orders lowers the overall costs by making the slippage cost 0. In this scenario, the highest trading cost has been reduced from 389.83% to 355.93%.