Categories
Forex Assets

Costs Involved While Trading The NZD/INR Forex Currency Pair

Introduction

The abbreviation of NZD/INR is the New Zealand Dollar paired with the Indian Rupee. Here, NZD is the official currency of New Zealand, and Indian Rupee is India’s currency. Like other currency pairs, NZD/INR provides some decent movement that allows traders to make money from the forex market.

Understanding NZD/INR

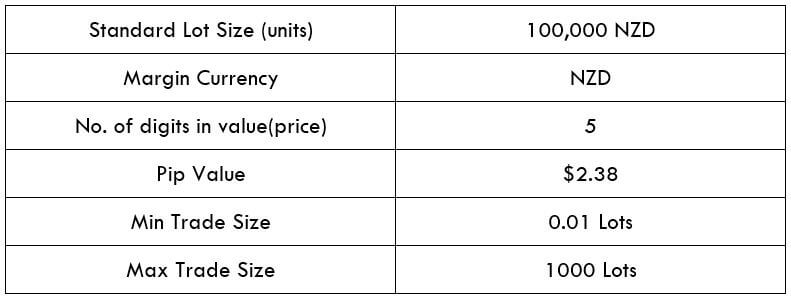
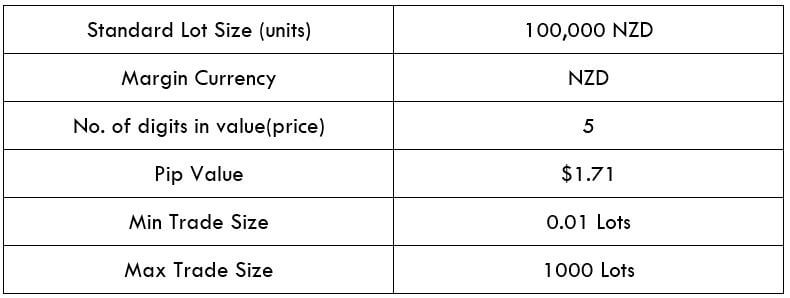
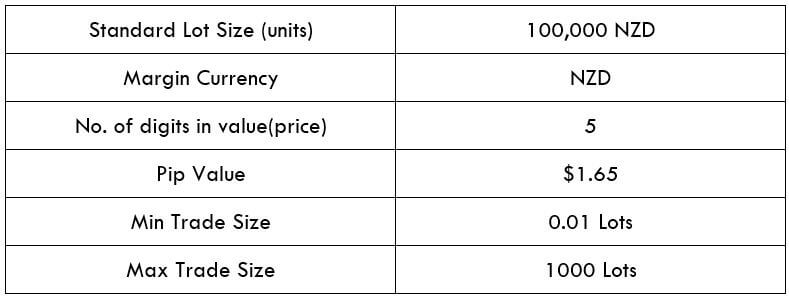
In NZD/INR currency pairs, NZD is the base currency (First Currency), and the INR is the quote currency (Second Currency). In a currency pair’s sell trade, we trade the base currency to buy the quote currency and vice versa. Therefore, if the NZD/INR pair is trading at 49.02, it means we should have 49.02 INR to buy 1 NZD.

Spread

As price and bid price is a common term in the forex market, most of the traders should know. The price represents the price in which we sell a currency pair. On the other hand, the bid price is the price at which we take a buy trade.

The difference between the asking price and the bid price is called the spread, usually a charge that the broker takes from a trader. Below are the spread values for the NZD/INR Forex pair.

ECN: 36 pips | STP: 41 pips

Fees

A Fee is a cost that traders pay to the broker as a charge to take a trade. This fee differs on the type of broker (ECN/STP) we use.

Slippage

In some cases, when we take a trade at a particular price, it might ignore the level and open the trade at another price, which is usually known as Slippage. The Slippage can occur at any price level and at any time, usually when the market remains volatile.

Trading Range in NZD/INR

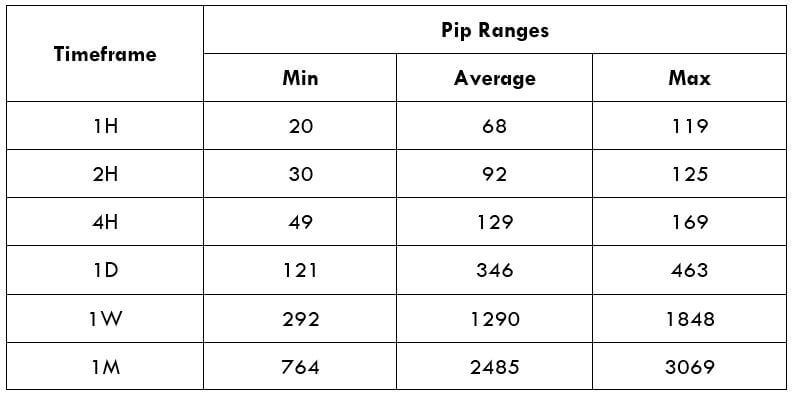
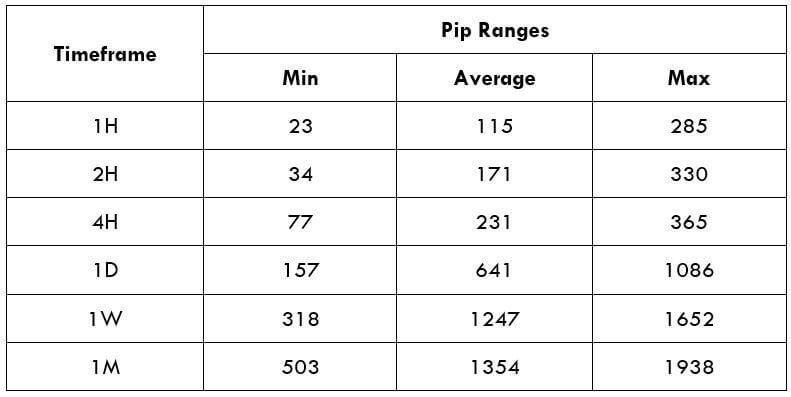
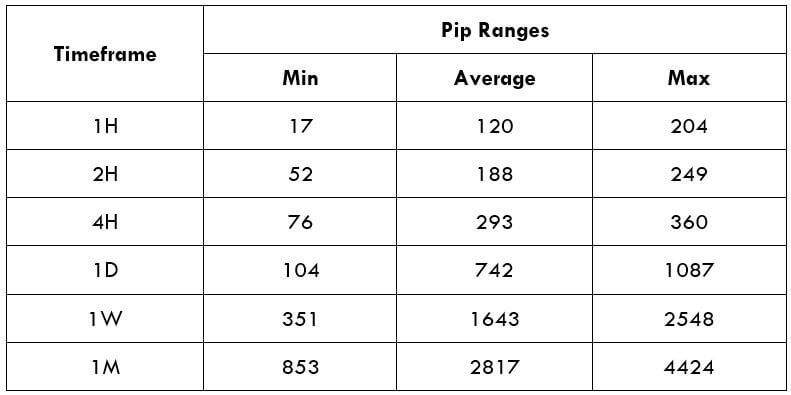
Our aim as a trader is to eliminate losses and minimize trading risks. The trading range here will indicate how much we will make as a profit or loss within a timeframe. To calculate the exact value, we will use ATR is a technical indicator that suggests the price movement in a currency pair. In the lower table, we interpret the minimum, average, and maximum pip movement in a currency pair. We will assess it merely by using the ATR indicator merged with 200-period SMA.

Procedure to assess Pip Ranges

  1. Add the ATR indicator to your chart
  2. Set the period to 1
  3. Add a 200-period SMA to this indicator
  4. Shrink the chart so you can assess a considerable time period
  5. Select your desired timeframe
  6. Measure the floor level and set this value as the min
  7. Measure the level of the 200-period SMA and set this as the average
  8. Measure the peak levels and set this as Max.
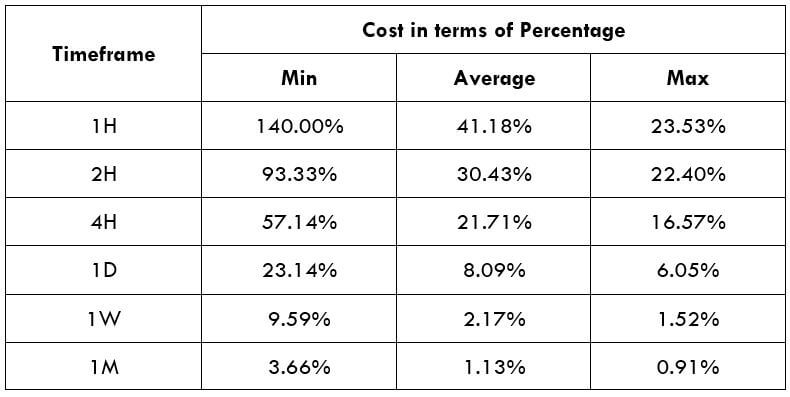
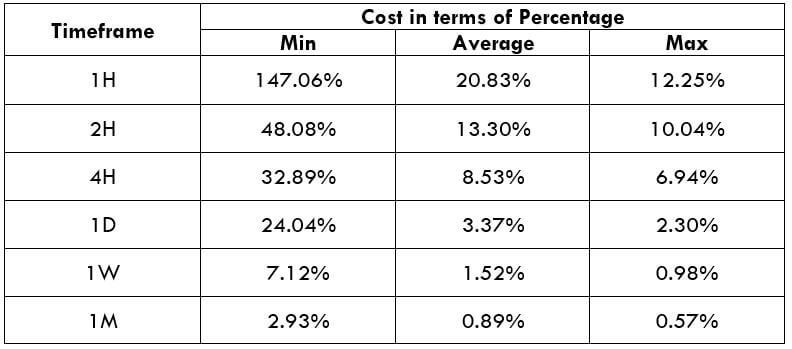
  9. NZD/INR Cost as a Percent of the Trading Range

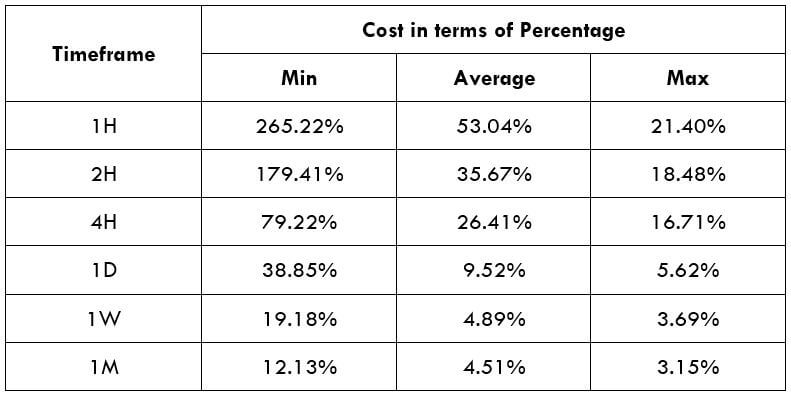
The price of trade differs on the type of brokers and varies based on the volatility of the market. The full cost of trade involves fees, spread, and sometimes Slippage if the volatility is higher.
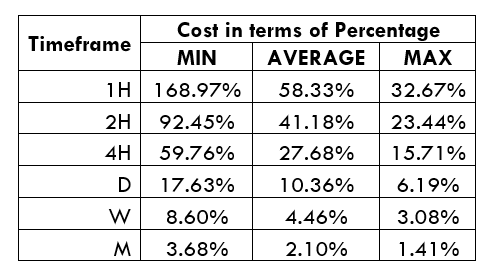
ECN Model Account

Spread = 36 | Slippage = 5 |Trading fee = 8

Total cost = Slippage + Spread + Trading Fee = 5 + 36 + 8 = 49
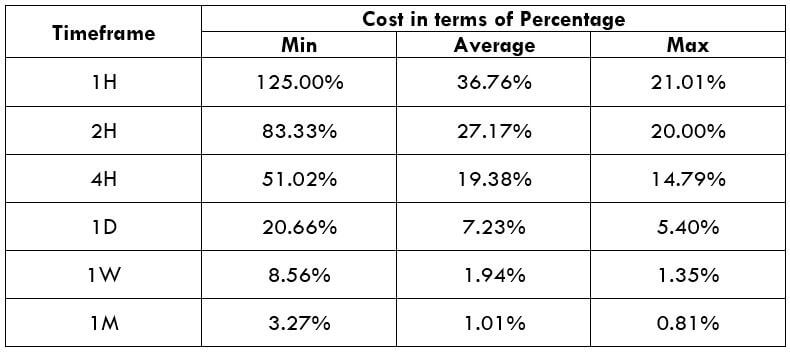
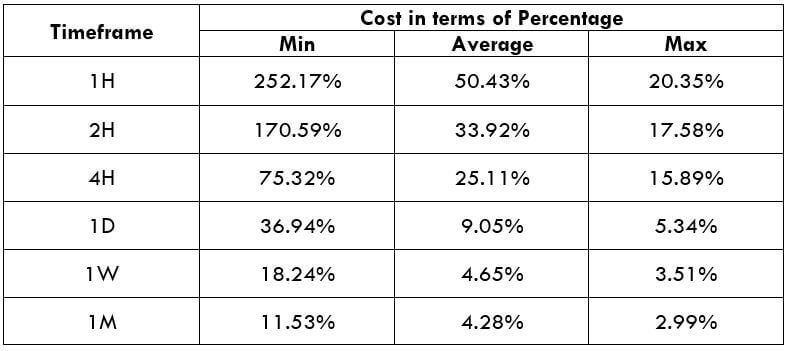
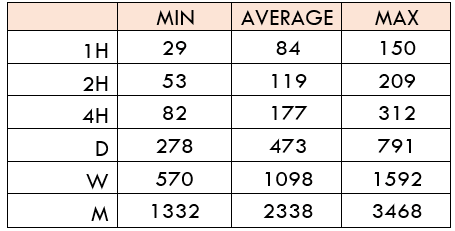
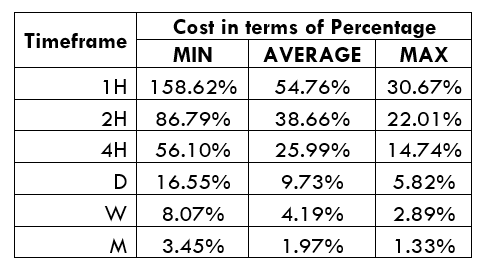
STP Model Account

Spread = 41 | Slippage = 5 | Trading fee = 0

Total cost = Slippage + Spread + Trading Fee = 5 + 41 + 0 = 46

The Ideal way to trade the NZD/INR

Considering the table, we should evaluate these two factors to make trading decisions in the NZD/INR pair. The trading cost and volatility are two critical factors that trade should contemplate when trading in the currency market.

In timeframes, we can see the price movement fluctuates from the minimum volatility and the average volatility. As a trader, we aim to make a profit from this pip movement and variation. However, it often becomes challenging to make a profit if there is no sufficient variant in the pip value. As per the price mentioned above, the NZD/INR pair is profitable in swing trading and day trading.

Categories
Forex Assets

How Expensive Is It To Trade The NZD/DKK Forex pair?

Introduction

NZD is the symbol of the New Zealand dollar, and it is the 10th most traded currency in the Foreign Exchange market. It is the official currency of New Zealand and some other countries like Cook Islands, Niue, the Ross Dependency. Whereas DKK stands for Danish Krone, and it is the official currency of Denmark, Greenland, and the Faroe Islands.

The currencies in the Foreign exchange market are traded in pairs. NZD/DKK is the acronym for the New Zealand dollar against the Danish Krone. In this case, the first currency (NZD) is the base currency, and the second (DKK) is the quote currency.

Understanding NZD/DKK

To find the comparative value of one currency in the Forex market, we need another currency to evaluate. If the value of the first(base) currency goes down, the value of the second (quote) currency moves up and vice versa. The market value of NZD/DKK determines the strength of DKK against the NZD. It can be clearly understood as 1 NZD is equal to how much of DKK. So if the exchange price for the pair NZD/DKK is 4.1943, it means we need 4.1943 DKK to buy 1 NZD.

Spread

Forex brokers have two different rates for currency pairs: the bid & ask price. Here the “bid” price at which we can OFFER the base currency, and The “ask” price is at which we can ACQUIRE the base currency. Therefore, the difference between the ask and the bid price is called the spread. Some brokers, instead of charging a split fee for trading, they already have the fees inherent in the spread. Below are the ECN and STP for the pair:

ECN: 15 pips | STP: 20 pips

Fees

When we place any trade, there is some payment/commission we need to pay to the broker. A Fee is simply that payment that we pay to the broker each time we open a position. The fee also fluctuates from the type of broker we use; for instance, there are no charges on STP account models, but a few pips on ECN accounts.

Slippage

The difference between the anticipated and executed price at which the trade is implemented can be termed as Slippage. It can appear at any time but mostly happens when the market is fast-phased and volatile.

Trading Range in NZD/DKK

The trading range is a tabular interpretation of the pip movement in a currency pair for separate timeframes. Using this, we can gauge the risk on a trade for each timeframe. A trading range effectively represents the minimum, average, and maximum pip movement in a currency pair. This can be assessed quickly by using the ATR indicator combined with 200-period SMA.

Procedure to assess Pip Ranges

  1. Add the ATR indicator to your chart
  2. Set the period to 1
  3. Add a 200-period SMA to this indicator
  4. Shrink the chart so you can assess a large time period
  5. Select your desired timeframe
  6. Measure the floor level and set this value as the min
  7. Measure the level of the 200-period SMA and set this as the average
  8. Measure the peak levels and set this as Max.

NZD/DKK Cost as a Percent of the Trading Range

The cost of trade primarily varies on the broker and fluctuates based on the volatility of the market. This is for the reason that the total cost includes Slippage and spreads apart after the trading fee. Following is the description of the cost variation in terms of percentages. The knowledge of it is discussed in the subsequent sections for ECN and STP accounts.

ECN Model Account

Spread = 15 | Slippage = 5 |Trading fee = 8

Total cost = Slippage + Spread + Trading Fee = 5 + 15 + 8 = 28

STP Model Account

Spread = 20 | Slippage = 5 | Trading fee = 0

Total cost = Slippage + Spread + Trading Fee = 5 + 20 + 0 = 25

The Ideal way to trade the NZD/DKK

The NZD/DKK is an exotic currency pair, and the volatility in this pair is moderate. As seen in the range table above, the average pip movement on the 1hour time frame is 68. We must know that the cost of trade declines as the volatility of the pair increases. But this should not be held as an advantage because it is unsafe to trade high volatile markets as the prices rise and fall swiftly.

For instance, in the 1-hour timeframe, the maximum pip range value in this pair is 119 pips, and the minimum pip range value is 20 pips. When we compare the fees for both the pip movements, we find that for 20 pip movement fees is 140.00%, and for a 119 pip movement, the fess is only 23.53%.

So, we can substantiate that the prices are more significant for low volatile markets and high for extremely volatile markets. Hence, we must constantly try to make our entries and exits when the volatility is minimum or average than to that of maximum values. But if your preference is certainly towards decreasing your trading costs, you can trade when the market’s volatility is near the maximum values with optimal risk management.

Categories
Forex Assets

Asset Analysis – Trading The NZD/SEK Exotic Cross Currency Pair

Introduction

NZD/SEK is the acronym for the currency pair New Zealand dollar versus the Swedish Krona. It is marked under the exotic cross-currency pair category. In this pair, NZD will be the base currency, and SEK will be the quote currency. In this article, we shall understand everything about trading this currency pair.

Understanding NZD/SEK

The price of this pair in the foreign exchange market determines the value of SEK comparable to one NZD. It is quoted as 1 NZD per X SEK. So, if the value of this pair is 5.8296, these many Swedish Kronor (SEK) are required to purchase one NZD.

Spread

Trading the Forex market usually does not involve spending a lot of fees like the Stock market. Here, Forex brokers make profits through spreads. It is nothing but the difference between Bid – Ask prices of an asset. Some broker has the cost inherent into the buy and sell prices of the currency pair; instead of charging a separate fee. Below are the spread values of ECN and STP brokers for the NZD/SEK pair.

ECN: 48 pips | STP: 53 pips

Fees

A Fee is the charges we pay to the stockbroker for executing a particular trade. The fee fluctuates from the type of broker we choose. For example, the fee on the STP accounts is zero, but we can expect a few additional pips on ECN accounts.

Slippage

Slippage is the contrast between the price expected by the trader for execution and the price at which the agent executed the price. There is this variation due to the high market volatility and more passive execution speed.

Trading Range in NZD/SEK

The trading range is used at this point; to measure the volatility of the NZD/SEK pair. The amount of money we will gain or lose in an allotted timeframe can be evaluated using the trading range table. The minimum, average, and maximum pip movement of the currency pair is exemplified in the trading range. This can be evaluated simply by using the ATR indicator combined with 200-period SMA.

Procedure to assess Pip Ranges

  1. Add the ATR indicator to your chart
  2. Set the period to 1
  3. Add a 200-period SMA to this indicator
  4. Shrink the chart so you can assess a large time period
  5. Select your desired timeframe
  6. Measure the floor level and set this value as the min
  7. Measure the level of the 200-period SMA and set this as the average
  8. Measure the peak levels and set this as Max.

NZD/SEK Cost as a Percent of the Trading Range

The rate of trade varies on the stockbroker and fluctuates according to the volatility of the market. This is because the trading cost includes fees, slippage, and the spread. The rate of variation in terms of percentage is given below.

ECN Model Account

Spread = 48 | Slippage = 5 |Trading fee = 8

Total cost = Slippage + Spread + Trading Fee = 5 + 48 + 8 = 61

STP Model Account

Spread = 53 | Slippage = 5 | Trading fee = 0

Total cost = Slippage + Spread + Trading Fee = 5 + 53 + 0 = 58

The Ideal way to trade the NZD/SEK

The NZD/SEK is termed as an exotic-cross currency pair and has a low volatile market. Looking at the pip range table, the average pip movement on the 1H timeframe is 115 pips, which implies high volatility. As we know, the higher the volatility, the smaller will be the cost to implement the trade. Nonetheless, this is not a benefit to trading in a volatile market; it involves higher risk.

For instance, in the 1M time frame, the Maximum pip range value is 1938, and the minimum is 503. When we evaluate the trading fees for both the pip movements, we notice that for 503 pip movement fees is 12.13%, and for the 1938 pip movement, fess is only 3.15%. Therefore, from the above instance, we can determine that trading the NZD/SEK currency pair will be on the expensive side.

Categories
Forex Assets

Asset Analysis – Comprehending The NZD/NOK Exotic Forex Pair

Introduction

NZD/NOK is the abbreviation for the currency pair New Zealand dollar versus the Norwegian Krone. It is referred to as an exotic cross-currency pair. In this case, NZD is the base currency, and NOK is the quote currency. In this article, we shall learn about everything you need to know about this currency.

Comprehending NZD/NOK

Understanding the value of a currency pair is simple. The value of NZD/NOK verifies the Norwegian Krone that must be paid to buy one New Zealand dollar. It quoted as 1 NZD per X NOK. For instance, if the current value of NZD/NOK is 6.0549, then 6.0549 NOK is required to buy one NZD.

Spread

Spread is the keyway through which stockbrokers make income. The selling price and buying price are different; the distinction between these prices is termed as the spread. It ranges from broker to broker and their implementation type. Below are the spreads for NZD/NOK currency pairs in both ECN & STP account models:

ECN: 20 pips | STP: 25 pips

Fees

For every execution, there is a cost levied by the broker. This cost is also indicated as the commission/fee on a trade. This fee/commission does not apply to STP accounts; however, a few additional pips are charged.

Slippage

Slippage is the difference in the price executed by you and the price you indeed received. It occurs on market orders. Slippage varies on two factors:

  • Market’s volatility
  • Broker’s execution speed

Trading Range in NZD/NOK

The trading range is a tabular description of the pip movement in a currency pair in a variety of timeframes. These values help in evaluating the risk-on trade as it defines the minimum, average, and maximum profit that can be made on a trade.

Procedure to assess Pip Ranges

  1. Add the ATR indicator to your chart
  2. Set the period to 1
  3. Add a 200-period SMA to this indicator
  4. Shrink the chart so you can assess a large time period
  5. Select your desired timeframe
  6. Measure the floor level and set this value as the min
  7. Measure the level of the 200-period SMA and set this as the average
  8. Measure the peak levels and set this as Max.

NZD/NOK Cost as a Percent of the Trading Range

The total cost of the trade shifts/changes based on the volatility of the market; hence we must figure out the instances when the costs are less to place ourselves in the market. The table below exhibits the variation in the costs based on the change in the market’s volatility.

Note: The ratio signifies the relative scale of costs and not the stable costs on the trade.

ECN Model Account

Spread = 20 | Slippage = 5 |Trading fee = 8

Total cost = Slippage + Spread + Trading Fee = 5 + 20 + 8 = 33 

STP Model Account

Spread = 25 | Slippage = 5 | Trading fee = 0

Total cost = Slippage + Spread + Trading Fee = 5 + 25 + 0 = 30

The Ideal way to trade the NZD/NOK

NZD/NOK is an exotic currency pair, and hence we can see, the average pip movement in 1hr timeframe is 120, which indicates higher volatility. The greater the volatility, the higher is the risk, and smaller is the cost of the trade and the other way around. Taking an instance, we can see from the trading range that when the pip movement is smaller, the charge is elevated, and when the pip movement is higher, the charge is lower.

To further decrease our costs of trade, we may place trades using limit orders as an alternative to the market orders. In the below table, we will see the interpretation of the cost percentages when limit orders are applied. As we can see, the slippage is zero. In doing so, the slippage will be excluded from the calculation from the total costs. And this will help us in lowering the trading cost by a sizeable margin. An example of the same is given below.

STP Model Account (Using Limit Orders)

Spread = 25 | Slippage = 0 | Trading fee = 0

Total cost = Slippage + Spread + Trading Fee = 0 + 25 + 0 = 25