Categories
Beginners Forex Education Forex Assets

Fundamentals of the British Pound

The British pound, whose use spans across more than 5000 years, is the oldest currency in the world. Originating from continental Europe under the Roman era, the official currency of the today’s United Kingdom was once also a unit of currency in Anglo-Saxon England, equivalent to 1 pound weight of silver, dating back to as early as 775 AD. Derived from the Latin word poundus which translates as weight, the name of the currency we use today is still in use. 

The symbol £ comes from an ornate L in Libra, whereas the ISO code under which it is recognized globally is GPB. Unlike other currencies, the GBP has endured such a vast portion of history and now tells a tale of how a currency once set the grounds for the future. In 928, the first King of England, Athelstan, adopted sterling as the first national currency, and one unit of the currency could actually buy off 15 heads of cattle. The name sterling, however, came to use only after the Norman Conquest, initially referring only to pennies and not pounds. This anterior name is of vague origin due to its connections to esterlin, a Norman word for little star, and lesterling, an Arab word meaning money

In the late 1600s, upon suffering naval defeat in the Battle of Beachy Head, King William III established the Bank of England to fund the war with France. As the first central bank ever created, the Bank of England and the British helped create laws and principles which are today considered essential for regulating currencies. In 1717, for the first time in history, the country defined the currency’s value in terms of gold rather than silver, and the gold price of £4.25 per fine ounce set by Sir Isaac Newton lasted throughout most of the following two hundred years. 

The country first adopted the gold standard in the 1800s, supporting the idea that the nation should back up its currency with an equivalent quantity of gold reserves. The United Kingdom briefly left the gold standard in 1914 to support itself during the war, yet the heavy borrowing led to high inflation that considerably devalued the pound. In 1925, Winston Churchill returned to the gold standard only to come off of it a few years later, in 1931, when the sterling once again underwent a significant drop. The 20th century gave birth to another nickname of the GDP, the cable, due to the creation of the first trans-Atlantic telecommunications cable used for stock exchanges between New York City and London. The term became part of today’s vernacular to the extent that the phrase what’s the quote on the cable is understood easily as the interest in knowing how many dollars are needed to buy pounds. 

Overall, the British pound holds so much history and truly embodies the qualities of an enduring currency. The British were the first to put together a stable government and currency, which remained a safe haven for hundreds of years. Nowadays, the GBP has lost its previous value and power as it stands approximately third in reserves, right behind the USD and the EUR. The 2016 Brexit led to one of the worst falls of the GBP in history and the attempts to foretell the future of this once great currency seem more challenging than ever before.

The Bank of England

Under the rule of King William and Queen Mary, upon the issuance of the 1694 Royal Charter, the Bank of England was founded in the hope of promoting stability and providing benefits to the people, which are still held as dominant values of the institution. As one of the longest central banks in its entire existence, created right after the Swedish Riksbank, the Bank of England (BoE) served as a model for other central banks around the world. Today the bank’s responsibilities include the issuance of banknotes, control of the country’s gold reserves, and setting the official interest rates. The BoE has a dual mandate consisting of two main objectives – monetary stability and economic stability. The former involves influencing interest rates so as to deliver the objectives of the Monetary Policy Committee (MPC), whereas the latter entails ensuring liquidity, together aimed at promoting growth and employment in the British economy. 

While the Bank of England bears the responsibility for printing money, it only includes the territory of the United Kingdom, while Ireland, which uses the EUR, is exempt from its authority. What is more, the BoE issues notes in both England and Wales, but Scotland and Northern Ireland can also do the same through several other banks. Coins are, however, manufactured by the Royal Mint, an export mint located in Llantrisant, South Wales. Since its opening by the Queen in 1968, the Royal Mint has been in charge of making and distributing the United Kingdom coins and supplying blanks and official medals. This government-owned institution now makes coins and medals for approximately 60 countries a year. 

Another important segment of the bank involves the Monetary Policy Committee (MPC) that consists of nine members – the Governor, the three Deputy Governors for Monetary Policy, Financial Stability and Markets and Banking, the Chief Economist, and four external members appointed directly by the Chancellor. These members are selected based on their expert knowledge of economics and monetary policy in order to decide on the best monetary policy action for the Bank of England to keep inflation low and stable. As of March 16, 2020, Andrew Bailey is the Governor, replacing Mark Carney. The new Governor was said to be the favorite choice in a number of media due to his extensive experience in the field of banking and, in particular, previous responsibilities and successes at the Bank of England. 

Some say that the BoE has been the main pillar of support of the United Kingdom during the past crises. The country’s economy is believed to fall into crisis approximately every 70 years and some past events, such as the Great Fire of London or the aftermath of the tea hegemony collapse, can support this viewpoint. It appears that every time the economy collapses the Bank of England steps in to provide support and safeguard the country and the currency against complete destruction. The Bank of England now has another task of helping the UK’s economy withstand the outcomes of Brexit-related decisions, which will be discussed later in the text, as one of the strongest factors impacting the country in the past few years.

UK Economic Reports

  • GDP Report

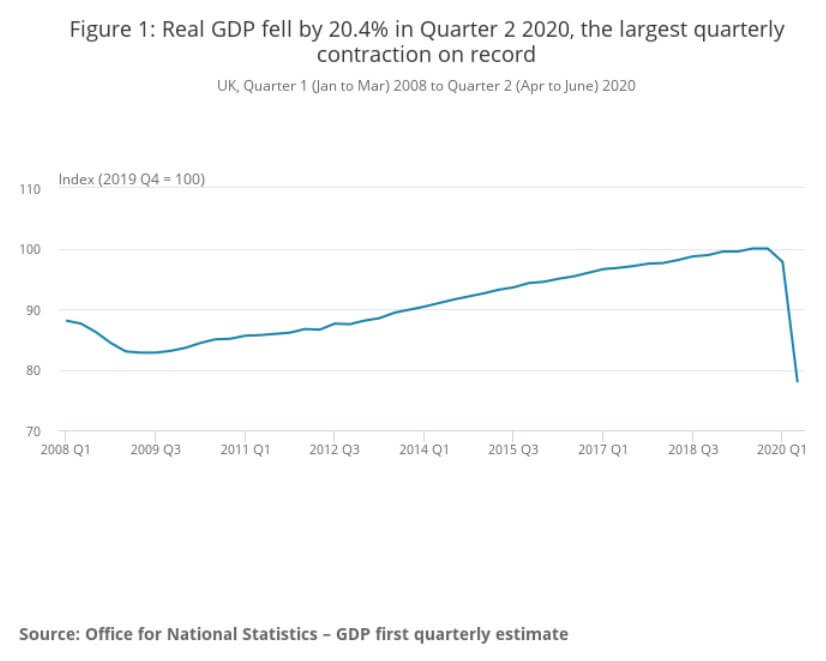
The GDP reports come out in three stages: the initial, the actual, and the final. Similar to the US GDP reports, the preliminary estimate is the most relevant piece of information as it first produces insight into the country’s economy. At the same time, this initial GDP report is also the least accurate, which is why the data is then revised in the following two reports. The current data shows how GDP is estimated to have fallen by a record of 20.4% in Quarter 2 (April to June), which was the second quarterly decline in a row after falling by 2.2% in the first quarter (January to March) this year. Despite the poor performance in the second quarter, the UK’s economy did see some improvement in June upon the easing of governmental decisions on lockdown (see the chart below). Currently seen as the worst in all G-7 states, the country’s GDP is estimated to fall by 8.3% in 2020, with a 6% annual growth rate anticipated in 2021. The UK’s economy is believed to rely heavily on social outdoor activities and the implications of the pandemic and related decisions can already be felt, as seen from the latest GDP report.
  • Claimant Count Change

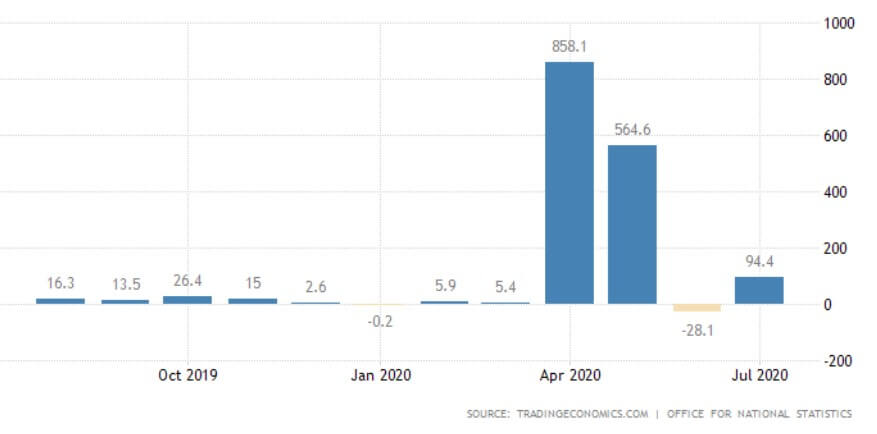
Claimant Count Change is a monthly report that provides information on the employment changes upon measuring the number of unemployed people in the UK during the reported month. It is interesting to note how the Claimant Count Change averaged 3.70 thousand between 1971 and 2020, reaching an all-time high of 858.10 thousand in April of this year. The last report issued on August 11, 2020, signaled weakness in the labor market, with the number of people claiming unemployment benefits having gone up by 94.4 thousand to 2.7 million in the previous month.
  • Inflation/Monetary Policy Reports

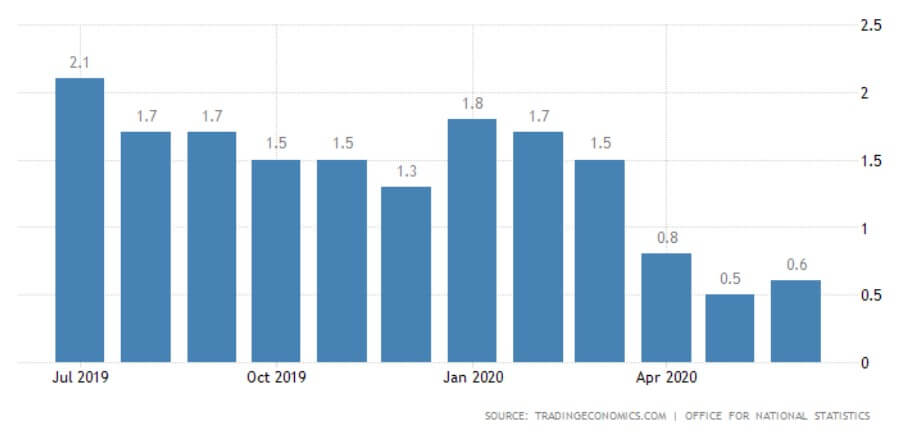
The quarterly Inflation Reports comprise the Monetary Policy Committee’s economic analyses and inflation forecasts that are further utilized in making interest rate decisions. As of November 2019, the Inflation Report is called the Monetary Policy Report, yet its purpose has remained the same. The last Monetary Policy Report that came out on August 6, 2020, reported the impact of the COVID-19 pandemic on reducing jobs and incomes in the country. The report includes information on the assistance provided by the Bank of England to UK citizens. Moreover, the Monetary Policy Report states where the economy is in comparison to the overall monetary policy of the BoE. The Bank of England has already put effort into returning inflation to the 2% target which aligns with its 1989—2020 average of 2.53%. Inflation is considered as one of the key indicators used in trading in the spot forex market. Traders are generally advised to keep informed in order to understand the situation in the country at the time for trading.
  • Retail Sales

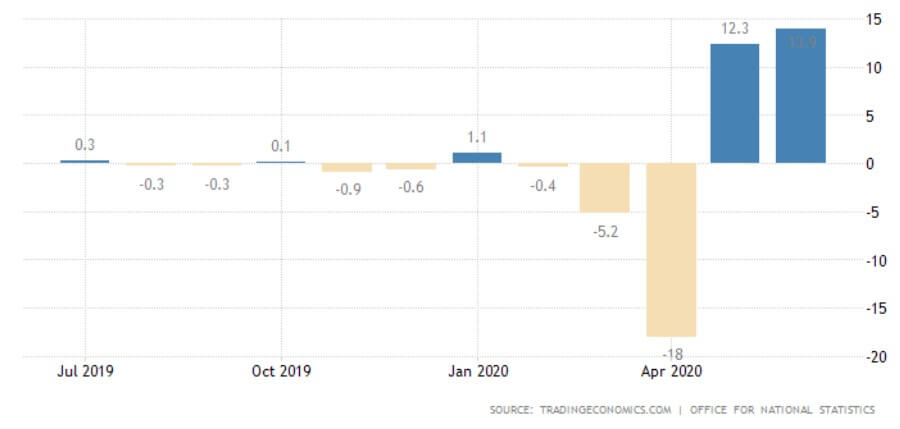
The Retail Sales report is an in-depth analysis of the latest macroeconomic and consumer trends affecting the UK retail industry. The last report issued in June 2020 indicated a 13.9% retail sales increase, which marks the second monthly increase in a row, resulting from the early economy recovery stages from the effects of the pandemic. Quite interestingly, while the United Kingdom’s retail sales averaged 0.23% between 1996 and 2020, they reached their all-time high of 13.90% in June 2020 and a record low of -18% in April of the same year. The next release of the report will be issued on August 21, which should give more information on whether the previous two-month increases will continue, further maintaining total sales to the pre-pandemic levels.
  • Manufacturing Report

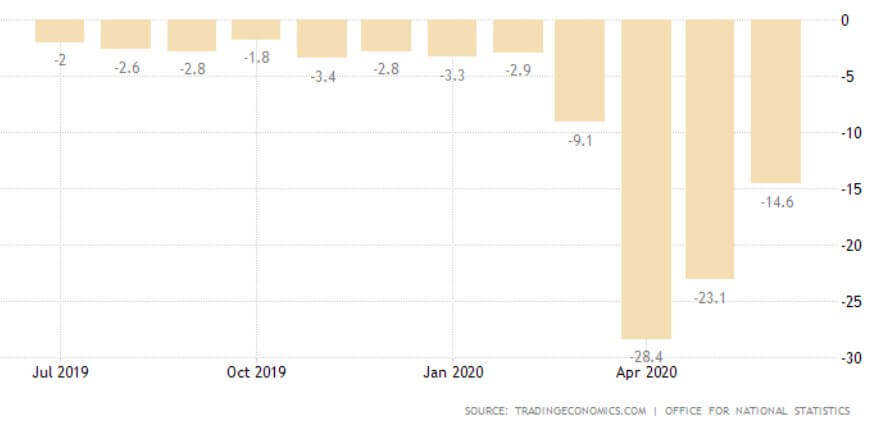
Deemed the most vital indicator for the UK manufacturing industry, the Manufacturing Report reveals the manufacturers’ contribution to the country’s regions with regards to past 12-month output, jobs, investment, and business confidence and export. Over the last year, the UK has been largely affected by the attempts to leave the European Union and the impact of the COVID-19 pandemic, which have caused prolonged industry volatility. UK manufacturing production’s 1969—2020 average of 0.42% was exceeded by far in April of this year with an all-time low of -28.40%. The last statistics in June indicate a fall of 14.6% in comparison to the previous year, but the forecasts seem to be more positive for the following 12-month period.
The Most Traded Pairs

  • GBP/USD

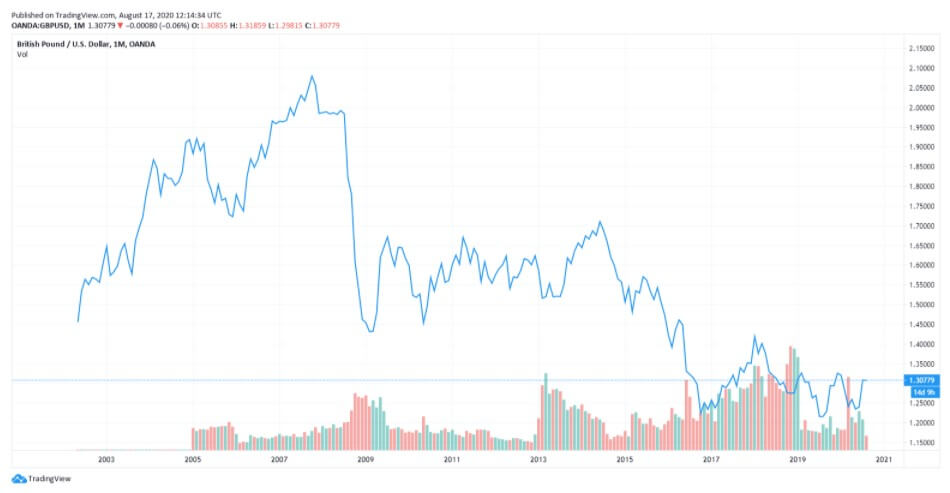
GDP/USD or the cable is probably the most frequent currency pair traded that, like EUR/GBP, has a lot of volume with an estimated 15% of the total daily volume of forex transactions. As it comprises two of the most traded currencies in the world, the focus of attention is often pointed towards this particular cross. This week’s economic calendar is rather quiet and the chart below reveals a continuation of a bullish pattern. Nonetheless, with the Brexit talks ever-present, the pair could overall entail slightly more volatility than usual.
  • GBP/EUR

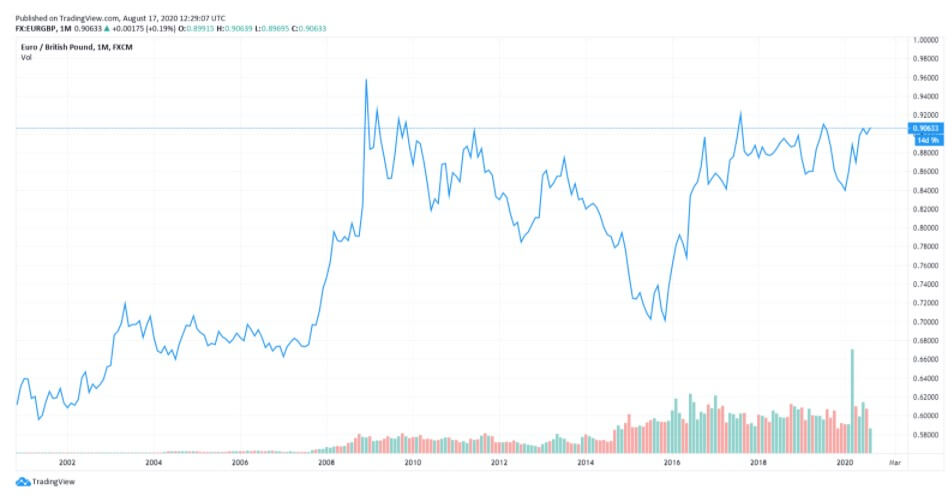
These two major currencies rank as one of the top eight most frequently traded currencies in the world. From the perspective of daily forex volume, the EUR is second only to the USD, with a market share of 39.1%, whereas the GBP ranks fourth with a 12.9% market share. This currency pair is said to be significantly less volatile than other EUR- or GBP-based crosses due to the economic closeness and interdependence between them. Nonetheless, the (ongoing) changes in monetary policy between the central banks of the UK and Europe can make this pair highly sensitive. 
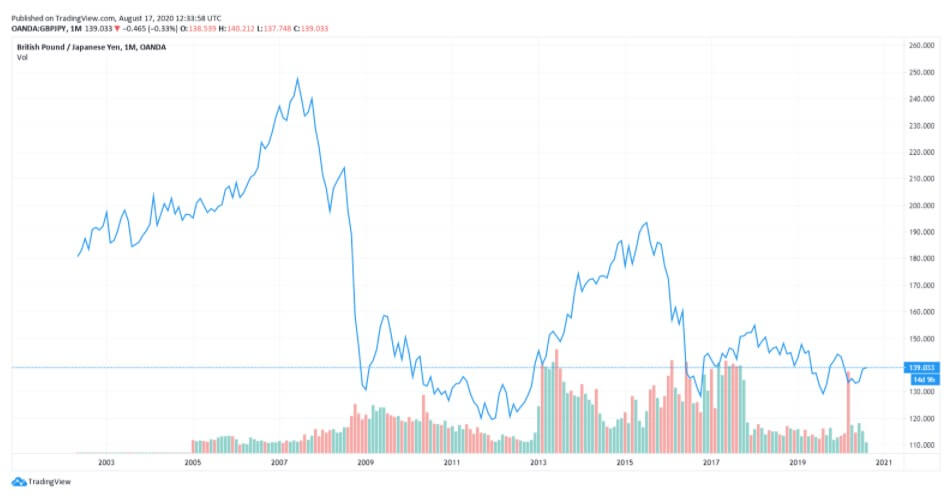
  • GBP/JPY

The GBP/JPY currency pair is said to be quite a volatile pair. As a low yielding currency, the JPY is commonly used as a funding currency of trade. Therefore, since the GBP belongs to one of the biggest economies in EUT, this particular pair can reveal the state of the global economy. It also reveals risk-off moves in the market resulting in the development of strong trends exceeding thousands of pips.
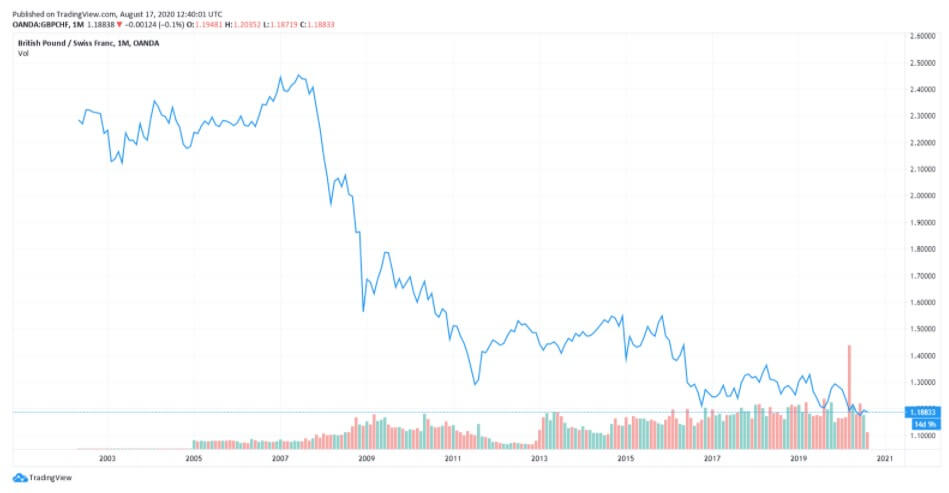
The lower volatility of the pair is said to originate from the economic and geographic proximity of the two nations with both the GBP and CHF used as reserve currencies around the globe. This pair along with the ones mentioned above fall under the more liquid group of pairs, whereas outside this particular set, one can find some more exotic crosses.
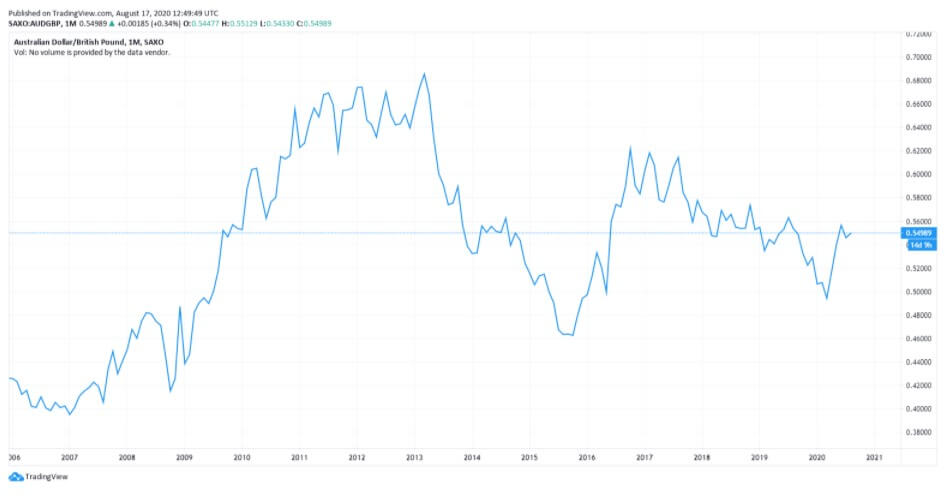
  • GPB/AUD

This currency pair reveals a lot of big moves that signal a much lower value of 100 pips than in pairs such as NZD.JPY for example, where 100 pips would equal a 1.3% move. In this currency pair, however, the same number of pips would turn out to be only a 0.5% move up or down. The percentage return will demonstrate the amount that a trader can expect to get. A number of GBP crosses typically entail many pip moves and, whenever the GBP is traded, smaller position sizes are to be expected owing to the fact that the base currency is as high. 
Interest Rates

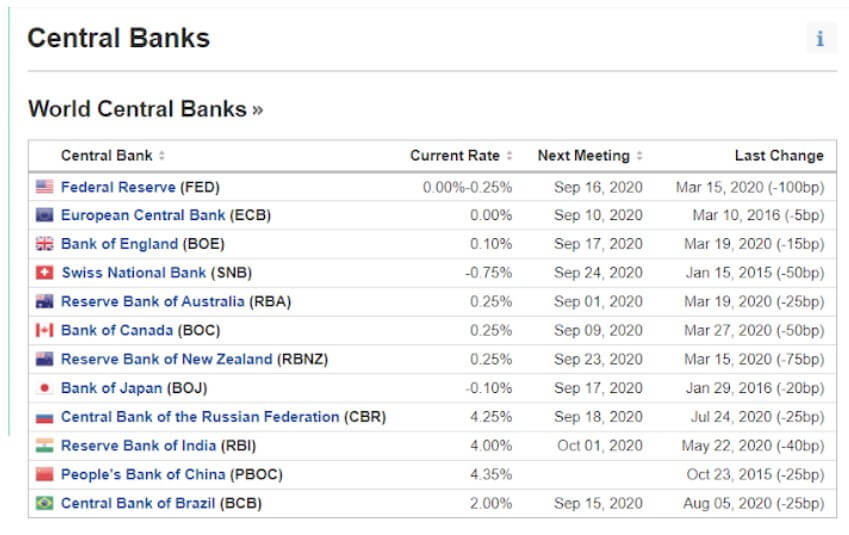
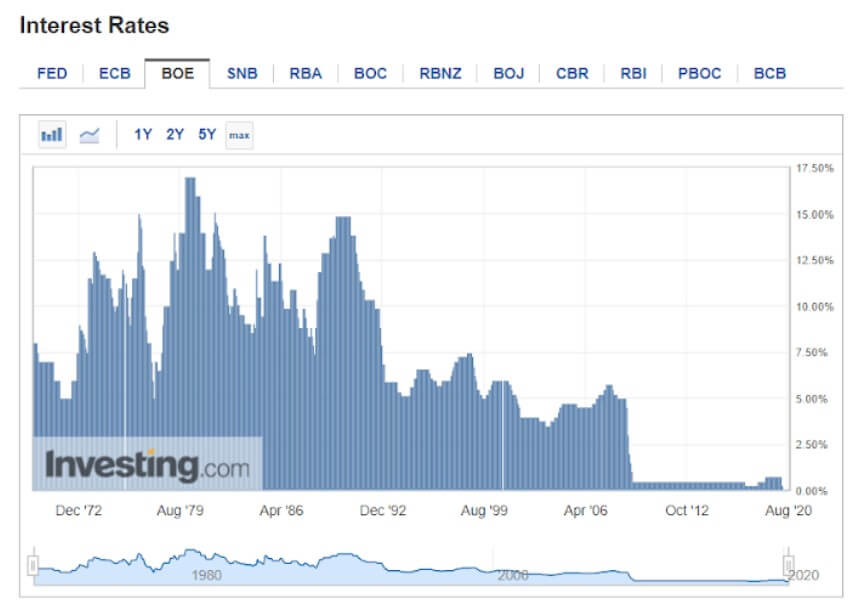
The GBP is generally believed to be doing better than the USD or JPY similar to other risk-on European currencies. Compared to other central banks, the Bank of England’s current 0.10% does reveal it to be one of the lower interest rates on the spectrum. At the same time, the current interest rate of the United Kingdom poses as a record low in the 1971—2020 average of 7.36%.
Trade Deficit

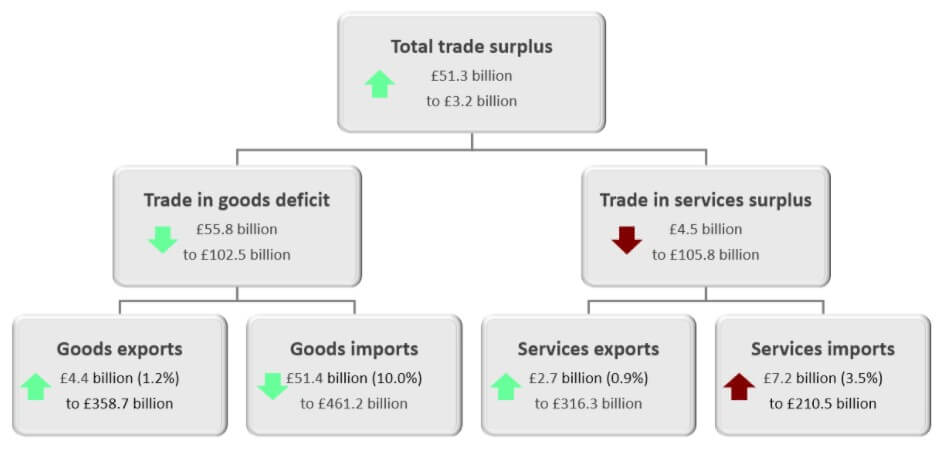
Like the US, the UK imports more than it exports which leads to large trade deficits with foreign countries.  In April of 2020, the total trade deficit of goods and services, without non-monetary gold and other precious metals, dropped down to 7.4 billion GBP in the past 12 months, with imports falling by 34.6 billion GBP and exports falling by 7.8 billion GBP. The total trade deficit for March 2020 was revised up by £2.7 billion to £4.0 billion, driven by a £2.2 billion downwards revision to services imports. These revisions also include the impact of the adjustments of GDP balancing applied to component series (including trade) to improve the alignment of the quarterly GDP position. The overall changes in the trade of the United Kingdom are presented in the image below and were certainly impacted by the strained relations with the EU and the overall state of the global trade under COVID-19.
Economic Activity

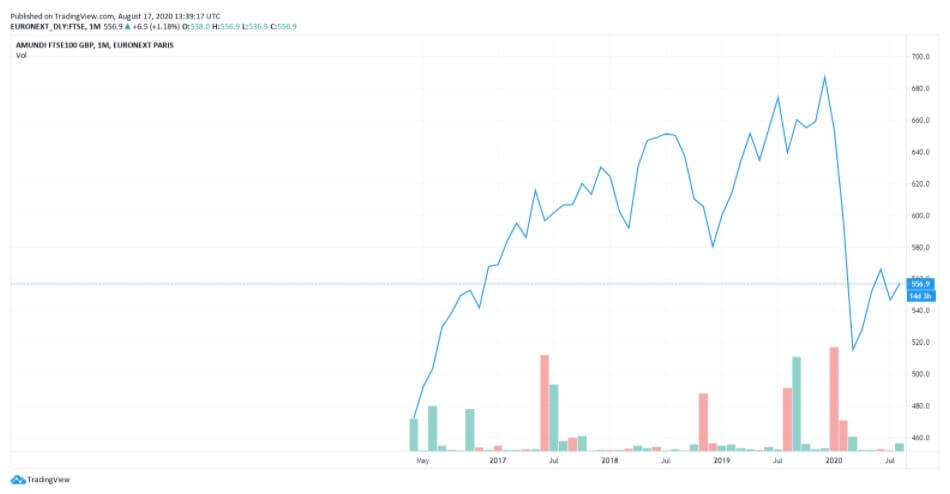
In order to understand the general state of the economy of the United Kingdom, one should look into the previously discussed GDP reports as well as FTSE (Financial Times Stock Exchange). FTSE 100 is the index of the 100 companies listed on the London Stock Exchange that will generate insight into the UK’s stock market. The chart below is an example of how the set of indices can provide market participants with information on the performance of the UK equity market. The current situation seems to have improved since the major drop in March of this year, but the likelihood of the return to the pre-pandemic state is still questionable.
Brexit

When Britain voted to leave the European Union in 2016, its currency plunged on world markets and 2020 still offers no actual resolution. The UK has officially rejected the notion of extending the transition period until December 31, 2020. After the video conference between UK PM Boris Johnson, European Commission President Ursula von der Leyen, and European Council President Charles Michel, both the UK and the EU came to terms with having more negotiations in the summer months so as to come to an agreement ahead of the EU summit on October of the same year. With both sides showing a willingness to mitigate the tension, the EUR/GBP currency pair seems to be caught in between the risk sentiment and Brexit. GBP improves along with the improvement of risk sentiment, yet the lack of Brexit progress drags the currency in the other direction.

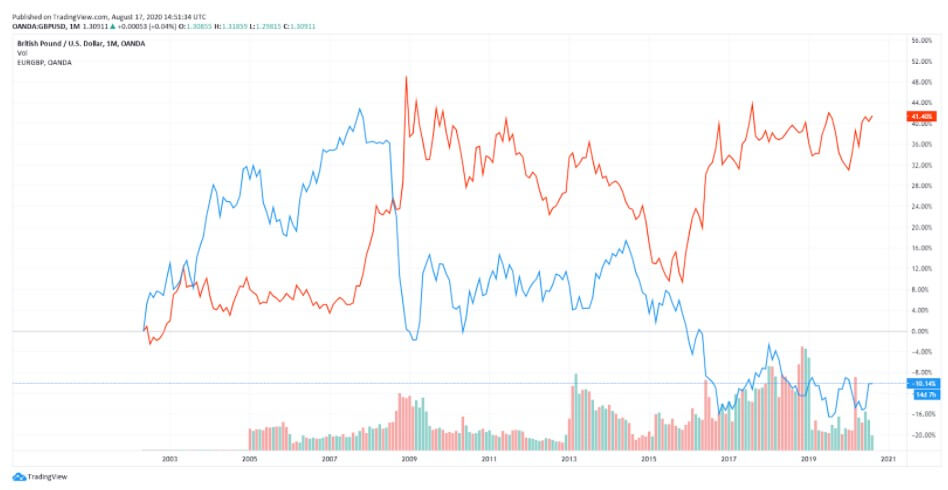
The various currency pair charts above reveal the progression of the GDP across the years. It appears that the UK’s official currency has suffered quite a lot in the past few years. Upon the 2016 referendum, the GBP fell 8% against the USD and 6% against the EUR. The initial hopes of a weaker currency to increase exports and raise demand for the UK goods/services did come through to a certain degree, but the trade deficit is still very much present. The exports have been increased by the weaker GBP and the unexpected increase in import prices has led to a reduction in pay and, therefore, a drop in consumer demand. Some predictions of the future of the British pound are quite gloomy as some economists believe that the GBP could drop to the 1.10—1.19 USD range should the UK leave the EU without a deal.

Furthermore, without the trade agreement, the economy could shrink by 8%, which would lead to an employment crisis. The overall implications of the unresolved relationship challenges between the UK and the EU are already vivid; for example, after the Brexit referendum, the Dow Jones decreased 600 points, removing $2 trillion from the global markets. A sharp increase in the USD versus a weakened GBP and EUR could obstruct US exports, causing difficulty in the US manufacturing sector, already encumbered by the trade war with China. Apart from the US, the JPY was also feared to experience a major surge in value due to investors’ tendency to flock to domestic currency.

The past December election in the UK was believed to be able to bring some relief, yet 2020 witnessed more negotiations and equally unresolved questions. The possibility of coming to a mutually beneficial deal (termed soft-Brexit in the media) may help the GBP surge in the following months. The currency market is expected to remain unpredictable until the resolution of current matters and the economy was publicly described as high risk by Governor Andrew Bailey himself. The long-term consequences of the UK leaving the EU are largely unknown, very much like the realization of the Brexit supporters’ hopes of economic growth and the pound’s appreciation.

The UK appears to be putting extra efforts in maintaining and preserving the economy, especially with the support of 300 billion GBP of quantitative easing. Combined with the COVID-19 pandemic, the UK’s Brexit struggles seem to be magnified despite the country’s attempts to keep the economy under control.

2007 Financial Crisis

The British economy was said to have been booming with UK tourists visiting the US and the financial sector enjoying the golden days before the financial crisis of 2007. The GBP soared from 2002’s 1.40 up to 2.10 USD in October of 2007, when it decreased by 35% to 1.40 USD at the beginning of 2009. The United Kingdom is believed to have been affected by the crisis more than other countries due to several factors: without a big manufacturing base, the economy depended on financial services, real estate, and retail sales for development. The growth was not based on strong grounds and it heavily relied on credit borrowing/lending.

The bubble burst in 2007 and once the housing prices dropped and credit sources dried up, the economy of the United Kingdom was left in dire straits. The impact of the 2007 crisis would remain long-felt with numerous consequences. The moment the big banks understood what was happening, bank-to-bank lending was reduced immediately.

The number of financial institutions that would still borrow discovered that the interbank lending interest rate doubled and the credit ensuring costs increased as well. Once the lending ceased, the effects were already felt across all sectors and especially in the housing industry. The FTSE 100 dropped by 5.5% in January 2008, which was perceived as the greatest loss since the crash of 2001. Soon people found it difficult to pay mortgages, resulting in fewer retail sales. Cutbacks in housing and retail sales were followed by a number of redundancies and unemployment was staggeringly high.

All of the events further aggravated the already weekend UK economy. With such a vast number of people unemployed, there was a decrease in tax revenue and the downturn continued with the fourth consecutive quarterly drop of GDP at the end of 2008.
In the hope of jump-starting the economy, the UK government reduced the VAT rate, but the effects of the crises were already too severe. The 31.3% FTSE decrease in 2009 was the biggest annual drop since 1984 and the economy just kept shrinking. The financial crisis caused a global recession with many assuming that it resulted from the recklessness of bankers.

The UK’s GDP fell more during the 1930s’ Great Depression and the GBP overall experienced elevated volatility during the entire period of the crisis. The GBP/USD hit a 26-year high in 2007 and the pound kept revealing difficulties in equities and the banking industry. Soon after, in January of 2009, the GBP market hit a 24-year low against the USD, repeating a similar scenario to the one with the EUR in 2008.
Conclusion

With the virus spreading across China in December and January, most UK businesses seemed to be preoccupied with Brexit. The ramifications of these external factors are yet to be seen, but one may see the current GBP struggles as part of its long-lived pattern. The Bank of England has once again stepped in to help the troubled economy and the benefits of those steps are already noticeable. The pound has indeed lost its safety position, placed somewhat in the middle. The currency tends to appreciate more during an economic expansion, so we have yet to see some major moves as the UK’s economy further stabilizes. 

The negative impact of Brexit on the GBP has been extensively documented over the past years, but considering the current selloff, one cannot but recall a previous episode of intense Sterling selling: the financial crisis. Investors seem to be fearful of the GBP difficulties and history seems to be repeating. The UK’s deficit is masked by a secure flow of investor capital, which in turn maintains the value of GBP above where it would be if it only reflected imports/exports. The pound largely struggled towards the beginning of the month of August, with the number of virus-inflicted patients rising across the country. 

The global economy also went through a difficult period, but the GBP experienced some bigger moves against the USD, returning to 1.30. Looking throughout August, the final resolution of Brexit is still far ahead and the expectations of a new trade deal between the UK and the EU keep the tension up.  Aside from the Brexit-related challenges, the virus pandemic also affected the currency market, making it even more unpredictable. August is witnessing the release of several important reports (GBP already came out a few days ago) and traders should pay attention to market volatility and adjust position sizing accordingly. At 1.31 USD, the GBP stands firm ahead of new Brexit negotiations.

Policymakers are said to be meeting soon to discuss the relationship between London’s financial sector and the EU market. The past weekend economy was predicted to be soon seeing a rapid recovery from the impact of the virus on consumer spending. Last, the British pound is estimated to be trading at 1.30 by the end of this quarter and at 1.28 in the upcoming 12 months.

Categories
Beginners Forex Education Forex Assets

Fundamentals of the United States Dollar (USD)

The safe-haven currency, the United States dollar, known under the ISO symbol of USD or nicknames such as dollar and greenback, has enjoyed a prestigious position as the leading global currency for many years now. Although now the most traded currency worldwide, the USD only took over the throne from the GBP in the late 1800s, that is the early 1900s, which compared with the country’s inception on July 4, 1776, is in fact a rather short period. The USD has experienced times of crisis in the past, and especially now, amid the COVID-19 pandemic, the questions regarding the currency’s strength arise. Surrounded by a plethora of news, which keeps coming out daily, and the US institutions issuing statements in lieu of the current state of affairs, the USD once again defends its long-held unique status among the world currencies.

History of USD 

Before the late 1800s, the British conquest of half of the world helped establish their dominance, rendering the GBP the strongest currency for a period spanning a couple of hundred years. The recognition of the new standard, that is the view of the USD as the new currency of value, resulted primarily from the country’s strong economy and functioning government. Consequently, this new market became also the biggest market in the world with the USD growing to be the most desired currency worldwide.

Now bearing the title of the world’s reserve currency, the USD is the currency of choice whenever foreign governments desire to hold onto their money. As they prefer not to keep these funds in their own currencies, they rely on such diversification mostly due to the need to increase the level of safety. The need for such an approach is most prominent in a small country with an unstable government experiencing numerous ups and downs. If a country keeps all the wealth in their own currency, they risk endangering their financial stability in times of instability or crises, which is why other countries’ safe currencies are employed.

History keeps records of such cases where a country put practically all their eggs into one basket, in a manner of speaking, leaving the country in utter chaos. The notorious example of Zimbabwe, which kept printing more money to the point where it became entirely worthless, should serve as a 30-year-old example of why countries prefer to keep their reserves in more stable currencies such as the USD. The United States’ currency is the standard nowadays which is why many countries across the globe prefer this currency over the others.

The many stories discussing, for example, China buying the US government’s debt are actually the stories of how foreign money is invested in the USD. Even the currency’s value decline due to China’s massive spending involving hundreds of billions of dollars upon their preparations for the Olympics could not shake the USD’s long-term stability. Amid the booming of the world economy, feeling afraid of how this prolonged decline of the USD could impact their reserves, other countries finally decided against keeping their wealth in this currency. The news started to circulate, the tension just kept building up, and the financial collapse hit in the middle of these speculations. Nonetheless, all other currencies except for the USD and JPY fell in value. The event proves the point that the USD is an exceptional currency with the best track record and a strong economy to back it up.

Each time other countries, aside from the United States, have some additional reserves, they often choose to buy the USD, which is generally bullish for this currency. However, whenever countries undergo challenging periods, they may typically decide to sell a portion of their USD holdings which has a negative impact on the currency. Generally looking at the connection between the USD and other currencies, most currencies have historically been pegged to the dollar at some point, especially around WWII and after.

Another important fact concerning the USD is that almost all commodities are generally traded in this currency. Should you, therefore, wish to purchase oil, you would have to do it in the USD. In case you have some other currency at your disposal, such as the EUR, you would then exchange it into the USD to proceed with the purchase. This connection is really significant which is why this topic will be thoroughly discussed later in the text.

With regard to US institutions governing the matters vis-à-vis the USD, the US Treasury Department, which is part of the US government, bears the responsibility for the supply of the money, while the Federal Open Market Committee (FOMC), a partly government agency, handles the related policies. These are two main bodies that control the money in the United States and whose responsibilities will be further discussed in another section below.

The Gold Standard

The US government was the first one to leave the gold standard back in the 1930s, which basically refers to the idea that a country had to have a hard asset to back up the money it wanted to print. Prior to the onset of the new dollar era, the United States would print the gold, silver, and bronze dollars. Back in the days where this monetary system was followed, the value of the dollar derived from the commodity, not the government. This further means that the same quantity of gold had an equal price across different countries, so the money had equal value worldwide regardless of the printing design.

With the shift toward the use of paper money in the late 1600s, the US government still followed the same principle of hard assets providing the money’s value, which gave birth to the above-mentioned gold and silver notes. While these old notes are still available for online purchase nowadays, we cannot now go into any bank and exchange such a gold note of 100 dollars for the equal worth of gold as was possible before. The price of the USD was, hence, entirely attached to the price of the hard assets, and this is how worthless paper actually acquired the value of real gold and silver.

The previously mentioned FOMC was formed in 1933 when some of the United States’ best bankers gathered in private at which point the country decided upon letting go of the rule that prohibited countries from printing as much money as they wanted. Although this country was the first to move towards another monetary policy, which caused great turmoil around the world, all other countries moved along with applying the same changes. By the late 60s, the entire world had already adopted the same strategy.

The new system implied that countries no longer had to store all the gold and the silver, i.e. the hard assets, in order for them to be able to print money, called the money supply. The money supply is basically the total amount of one country’s money in circulation. This however does not only refer to the printed money as only 6% of the entire USD has been printed on bills. The remainder actually pertains to digital numbers, such as the money in an individual’s bank account. The phenomenon is similar to that of cryptocurrencies, and some companies may even allow you to exchange these numbers in a ledger for the USD. As money is generally digital, if the bank does have enough money at the time of the desired withdrawal, you will not be able to take out the money, or the bills, that you requested.

The US Agencies 

As discussed before, the US Treasury is tasked with deciding on how much money is going to be printed, controlling the money supply. The FOMC, on the other hand, is responsible for monetary policy, which further implies that they control interest rates, bailouts, and other important segments related to the country’s finances.

The United States comprises 12 sections governed by 12 different bank presidents charged with submitting individual reports concerning their districts. The reports are shared and discussed upon meeting with other committee members going through the information prior to making a vote. The voting is conducted so that it allows only five regional bank presidents to get a vote, rotating the votes in a manner that prevents the past year’s vote from coming up again. Out of the 12 members, the 7 remaining ones actually come from the FOMC. They alternate meetings between six and eight weeks apart, and the head of the committee that is the Chair of the Federal Reserve (the Fed) has the tie-breaking vote. 

FOMC Procedures

The current Chair of the Federal Reserve of the United States is Jerome Powell, who spent most of his time in the Banking Industry. Due to his banking background, he differs from the previous scholars and economists who used to perform this function in the past. The current Chair’s aforementioned experiences make him appear to truly understand more about banks than the previously chosen individuals, who are appointed every four-six years. 

Every other meeting involves the Chair holding a press conference, where he reads a prepared statement and conducts the Q&A session. In these meetings, the Chairs would typically share a lot of important information, which has historically been likely to usurp the market’s stability. The market would suddenly become quite volatile and traders would react to these events. The former Chair of the Federal Reserve of the United States, Alan Greenspan, was famous for the statement about the market he gave in the 90s that resulted in quite a turmoil. The market went down by 10% the same day only to go up and double after that, making the market even more unstable. These figures appear to exercise more control in their public statements nowadays, although these events have been said to still have an effect on traders and the market.

Key US Reports

The key documents providing the greatest insight into the state of the USD and related matters include the following five reports: GDP, employment, producer and consumer price index, retail sales, and trade deficit reports. 

The GDP or the Gross Domestic Product report provides information on this important economic indicator that signals the condition of the overall economy of the United States. Providing insight into the country’s productivity, the quarterly report is said to have a particular impact on traders and their decision-making. The United States, in fact, issues three such GDP reports: the initial report that comes out approximately three weeks upon the end of the quarter (e.g. if the quarter ends toward the second part of the month, the initial report will probably come out around the 20th of the following month); the second report issued a month later that will contain some actual numbers based on the revision of the previous data; and, the final number that comes out three months upon the quarter ending. Among the three, the least attention will be directed towards the final reports, which appear to only hold relevance for the record books, whereas the first one will generate the most interest. As the initial report of the quarter, it gives important clues to traders, which is why, for example, every January 20, April 20, July 20, etc. will be important dates that should be part of the traders’ calendars. 

Non-farm Payroll measures employment or the number of people employed in the previous month and many traders rely on this information due to its relevance. The report typically comes out the first Friday each month and entails an extremely important indicator of consumer spending. Should the Friday fall on the first of the month, the issuance will be postponed to the following Friday of the month. When the results exceed expectations or predictions, they are considered to be positive (bullish) for the USD, while the opposite scenario is considered as negative (bearish) for the currency in question. Some currency traders claim that the Non-farm Payroll report is one of the best reports to trade.

The monthly producer and consumer price index (PPI and CPI) are important indicators measuring the economy’s performance. PPI is an important piece of data that signals future expected inflation, any positive change in this index entails the rise of prices as well as the possibility to save money and earn interest. The PPI is said to have little effect on the USD per se, but its correlation with the CPI is found to be extremely important by some astute forex traders. The CPI, unlike the PPI, provides insight into current growth and inflation levels. What traders can generate from this information is an understanding of the impact of inflation on the USD. For example, the first half of 2018 recorded a rise in inflation which correlated with the increase in the US Dollar Index (DXY).

The retail sales report notes the changes in sales as an important indicator of consumer spending, which is said to account for approximately 70% of economic growth in general. Traders keen on trading the news find this information important, especially in the light of the recent pandemic. Similar to the Non-farm Payroll report, a positive retail sales reading generally proves to be bullish for the USD, whereas a low reading is seen as bearish.

The trade deficit, the last report, is considered important due to the fact that during such deficits, the USD is generally noted to weaken. As currencies are susceptible to change because of a number of factors (e.g. economic growth, interest rates, inflation, and government policies), trade deficit should be perceived as one of the determinants. Generally, the trade deficit is considered to have a negative impact on the USD although the currency’s appreciation could stem from other reasons.

Major Currency Pairs

The following seven currency pairs are said to have the greatest volume: EUR/USD, USD/JPY, GBP/USD, USD/CHF, USD/CAD, AUD/USD, and NZD/USD. The EUR/USD pair is said to hold 37% of all trading volume in the world. While this number can oscillate up and down, this currency pair is in fact the most liquid pair among the seven major ones and is generally considered one of the safer pairs to trade. Traders who are invested in trading big news events are the ones that should be particularly drawn towards the most liquid currency pairs since these entail tighter spreads and less slippage. What is more, traders interested in trading the Non-farm Payrolls report are advised to give this currency pair a try because, while it cannot grant 100% success, it does alleviate some of the challenges concerning trading currencies. 

With a total of 10% of the entire trading volume, USD/JPY accompanies the previously discussed currency pair to hold almost half of the world’s trading, making these two a focus of many traders’ attention. As the USD is the most popular currency in the world, every trade involving this currency should entail great trading volume even with pairs such as NZD/USD.

USD/Gold Correlation

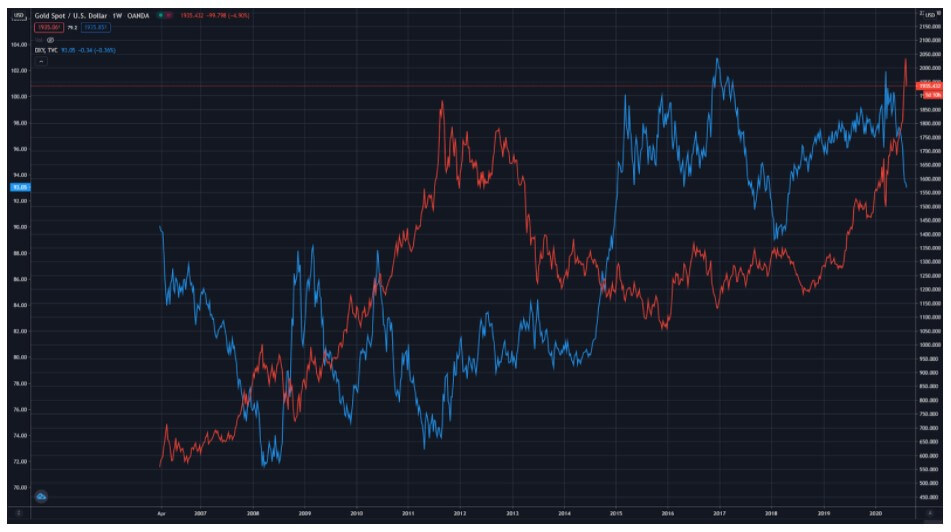
The negative correlation between the USD and gold is considered as one of the most important topics regarding this currency. These correlations can at times increase or decrease in strength, but from the perspective of history, the USD has an 80% negative correlation with the price of gold. This further implies that once the price of the USD appreciates, the gold’s price should plummet, and vice versa, which can be seen from the chart below (spot gold is red while DXY is blue). Although at one point both prices started moving in the same direction, these occurrences are very short-lived because the standard negative USD-gold correlation is of a long-term nature and eventually everything goes back to its place. The strongest correlation, and the most prominent one, is the one that the USD has with the price of gold. It is an indicator that as soon as the price of one goes up, the price of the other will start moving in the opposite direction. Naturally, traders can find exceptions and this cannot be perceived as a guarantee, but this correlation has been present for many years.

Trading USD

As one of the most liquid currencies worldwide, the USD allows for traders peace of mind when trading the related currency pairs. The only exception to this rule is when trading big news events or if traders are expecting some important move in the market. The USD is generally perceived as the safest currency to trend with the tightest spreads and the least amount of slippage, although some traders avoid it due to the big banks’ attention, involvement, and impact on this currency and, hence, traders.

Upon the economic crisis of 2008, the FOMC was the first central bank to raise interest rates, and years passed until others started to do the same. The USD is certainly not the currency with the highest interest rates in the world at the moment, but we have witnessed how they kept soaring at a dramatic pace at a few points in the past. The reason why this happens lies in the central bankers’ desire to keep inflation under control. Therefore, whenever the economy is improving, the interest rates are increasing.

The currency market implies the flight to safety on one hand and the flight to risk on the other, which is why we have money flowing either in or out of the country. Therefore we can conclude that the reason behind the FOMC’s aggressive rise in interest rates is the strength of the US economy. As it is the largest economy in the world, it does impact the rest of the world. Hence, when the US economy is doing well, so are the other countries.

Whenever money is on the lookout for investment, it will direct itself towards risk, which entails locations such as China, Vietnam, and South America, heading towards the places where the greatest return on money can be found. The FOMC kept increasing the interest rates, but this did not always entail a strong US dollar since the rest of the world was in fact doing better at the time. Inflation was kept under control since 2008 and the world seemed stable until the onset of the COVID-19 pandemic.

An important fact regarding the USD concerns trade deficits owing to the fact that the United States imports increasingly more than it exports, in particular with countries such as China and Japan. These trade deficits are a long-term negative for the currency because the individuals living in the United States and buying foreign goods keep seeding the money out of the country, and it is these other countries where this money is reinvested. The opposite scenario, where the United States could do more exports and the money would come into the country, as a result, would create a trade surplus. The country’s age-old tendency has been one of the popular topics highlighted by US politicians as a long-term negative on the currency.

Economic activities always affect the USD price, so if the United States is undergoing a challenging period unlike other countries, the US economy can be expected to keep struggling. On the contrary, should the rest of the world be experiencing economic struggles, the US economy would probably be doing well. Nevertheless, in order to trade the USD successfully, traders are always advised to do extensive research and monitor the external factors surrounding the currency market. 

Impact of COVID-19

The pandemic has taken the entire world by surprise, also shaking the United States economy, leaving 22 million Americans unemployed. The worldwide economic shock has revealed a silver lining for the USD as it has led to a number of investors selling riskier assets (e.g. stocks and bonds) and taking cash as a form of safety. The currencies which were highly exposed to global trade suffered depreciation as they typically sell-off in the face of economic deterioration, but the US dollar again emerged as the currency of choice in times of crisis. As investors always flee to safe-haven currencies in such unpredictable times and as the COVID-19 pandemic is driving the global economy into recession, the demand for the USD rose to the extent that the US Federal Reserve has to set up new swap lines in order to be able to lend money to the central banks of other currencies. The USD is currently seen as the strongest currency probably due to the country’s stable and safe economy. However, such strong demand can even exacerbate the current situation which pushed the Federal Reserve to protect the currency from shortages. 

Although the USD did not appreciate more than in 2007, the currency’s index value did approach near record highs. So far, the USD has slightly leveled, still maintaining an edge similar to many major currencies (e.g. EUR or JPY). Nonetheless, the current preference of the USD and its strength seem to be calling for an increase in international collaboration. Now, as the Federal Reserve is yet again pumping the currency into the world market, the trend may have serious implications for other economies. For example, after the 2008 crisis, the cost of export created by a soaring JPY left Japan worse off than some countries directly affected by the financial tumult, starting with the United States itself.

Business owners across the world understand that should the pandemic continue, they will require significant capital reserves to withstand the blows of the economic contraction. The spread of the virus certainly motivated some large currency moves as well and, although similar tendencies have been recorded in the past, the pandemic does make this situation one of a kind. The quick-paced forex dynamics and capital outflows from emerging markets appear to be much more prominent.

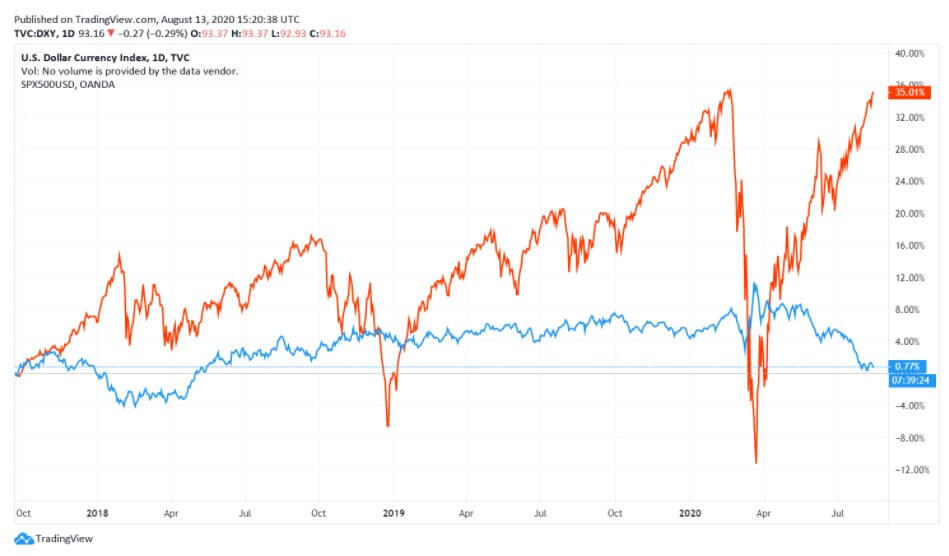
The state of equities at the moment is certainly interesting as we can see from the chart below. The same contrasting behavior between DXY and SPX500 was noticeable before as well as during the financial crash of 2007. March was another time in history when a significant drop in equities was quite prominent only to go up recently.

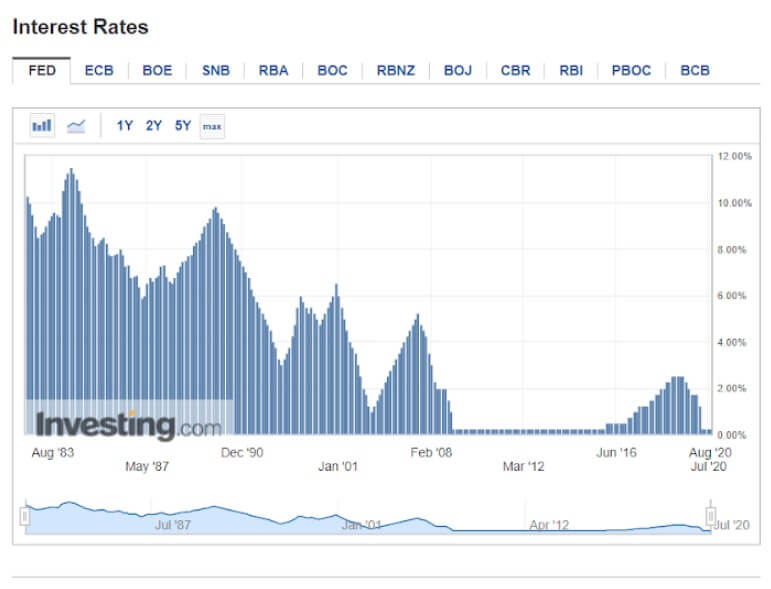
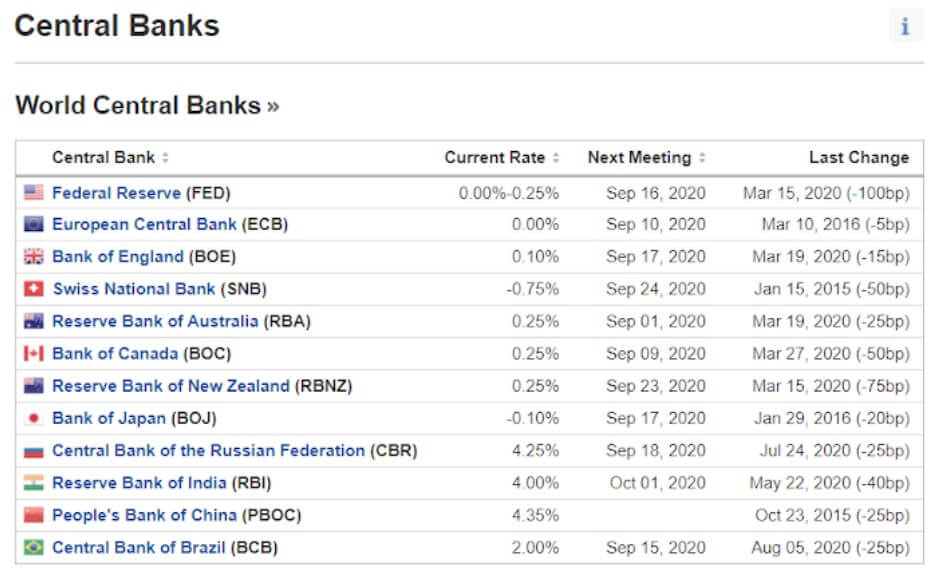
Interest rates in the United States of America have leveled after the brief increase in the past year and as of March equal 0.25%, unlike the values proposed by some other central banks of the world. The current interest rate is practically the same as it was in the post-crisis period of 2008, where it maintained the same 0.25% until the beginning of 2015. Interest rates across the world mimic the same decline as that of the FOMC. However, some other central banks, e.g. the Central Bank of the Russian Federation (CBR) and People’s Bank of China (PBOC) keep their interest rates above 4%.

China’s and Russia’s attitude towards the USD has kept economy-related media and various markets’ participants quite entertained in the past few years, especially in relation to gold and surrounding events. The so-called de-dollarization appears to be backed up by previous political altercations between China and Russia on one hand and the United States on the other. These long-term geopolitical rivals were found in the middle of a currency war where the two countries appear to be fighting against the global hegemony of the USD. 

Despite countries leaving the gold rule, this pre-pandemic gold spree appeared strange in this digital era. However, the central bank of Russia suspended buying of gold on the domestic market which has been explained by the attempt to strengthen the local currency aligning with lower oil prices and the spread of COVID-19. Quite interestingly, Russia is claimed to have exported more gold than gas in the second quarter of the current year for the first time in approximately the past 30 years. Analysts explain the entire situation as a mechanism that stops Russia’s purchases of foreign currency and gold when the prices of oil fall below $42 a barrel. With gold prices reaching all-time highs beginning of August 2020, many major Chinese banks have already taken measures to stop customers from purchasing gold and other precious metal-related products through them.

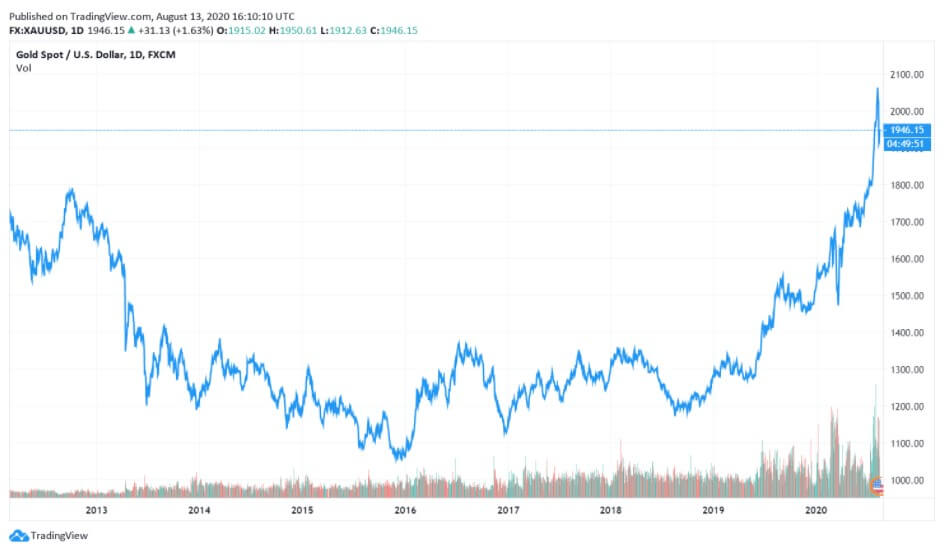
Gold prices have gone up and down in the past, so the increase from the beginning of 2020 can be attributed to the onset of the COVID-19 pandemic as well as part of its natural longer upward trend. The current price exceeds that of the financial crisis of 2007 by far and the precious metals appear to be moving even higher, supporting the expectations of the US inflation increase. 

The FOMC maintains a positive outlook on the future, assessing the May employment rise in a number of sectors, employees’ return to work, and the reopening of many businesses. Some analysts even look back at the times of the previous financial crisis where many feared inflation, highlighting the importance of preserving a more enthusiastic perspective of the future of the USD and the US market.

The USD has once again been proved to be the reserve currency of most countries across the world with more than $1.8 trillion of Federal Reserve notes in circulation. This de facto global currency appears to be positioned well for future trades despite the severity of the global viral threat. The United States’ official currency is currently largely outside the country’s borders, yet it may be difficult to foresee any other currency taking over the USD prominence in the near future.

Categories
Beginners Forex Education Forex Assets

The Fundamentals of the Euro (EUR)

The euro (symbol: €/code: EUR) is said to be used by approximately 341 million individuals each day, thus making it the second most-used currency in the world. The currency’s name was formally adopted in 1995 in Madrid upon then President of the European Commission, Jacques Santer, receiving a letter by Belgian Esperantist Germain Pirlot offering the suggestion. Like other currencies, the EUR used to be a commodity currency before becoming a fiat currency in the 1900s.

The idea of creating the EUR commenced in 1992 when certain documents were signed to initiate the process. Years passed and in 1998 a number of countries officially decided to gather around the same currency and adopt the EUR. Before this happened, each European country used a different currency: Germany – German Mark, France – French Franc, Italy – Italian Lira, Span – Peso, etc. These old currency notes were after 1998 exchanged over the new currency we now know under the name euro. This change allowed for easier migrations, travels, and commerce within the continent where an hour or two can get you from one country to several others.

Having a central currency helped the member states overcome and bypass many of the barriers that had previously existed. The EUR unites 19 of the 27 European Union member states in a monetary union called the eurozone or euro area. Many countries in the European territory have decided against using the currency, such as the majority of the Scandinavian countries and the United Kingdom, among others. The following Euro area member countries use the EUR: Austria, Belgium, Cyprus, Estonia, Finland, France, Germany, Greece, Ireland, Italy, Latvia, Lithuania, Luxembourg, Malta, the Netherlands, Portugal, Slovakia, Slovenia, and Spain.

Some countries are part of the EU but have yet to meet certain conditions to be able to adopt the EUR: Bulgaria, Croatia, the Czech Republic, Hungary, Poland, Romania, and Sweden. The following European microstates also use this currency: the British Overseas Territory of Akrotiri and Dhekelia, Montenegro, and Kosovo. The EUR is used outside Europe as well, in special territories of EU members, further complemented by other currencies pegged to the EUR. Countries can join the euro area through fulfilling convergence criteria that are binding economic and legal conditions stipulated by the 1992 Maastricht Treaty. The European Commission and the European Central Bank together decide on a country’s candidacy preparedness to adopt the EUR.

After the publishing of the reports stating their joint conclusion, the ECOFIN Council can rectify this decision upon consulting with the European Parliament and Heads of State, formally allowing the adoption process to start. A country’s readiness for euro adoption, the preparedness for the eurozone accession, or the member status may still not grant the full benefits of being a part of such monetary union due to the existence of certain individual financial irresponsibility which causes other countries to suffer. History has shown us how the more responsible member states had to step in in order to help the other struggling countries, and the period between 2008 and 2010 truly pointed to some concern whether the EUR could endure any longer. Greece, Spain, Ireland, and Italy, for example, were debated upon with regards to the question of keeping the membership status or discontinuing the use of the EUR.

Cyprus is another example of a country that would have collapsed a long time ago were it not for the European Central Bank’s approval of emergency funding. The future still has several questions to find answers to – can so many countries with different cultures, ethics, history, economies, and overall individual differences maintain this union, and can the currency survive the continual struggles it undergoes? While the future alone holds these answers, the idea behind so many countries united under the same currency still prevails even in the EUR banknotes ranging in denomination from €5 to €500. The seven colorful bills, Austrian artist Robert Kalina’s work of art, do not display famous national figures but feature Europe’s map, the EU’s flag, and arches, bridges, gateways, and windows, symbolizing the unity of Europe.

European Central Bank (ECB)

European Central Bank (ECB) is one of the seven institutions of the European Union and the governing body responsible for the 19 EU countries which have adopted the EUR. Headquartered in Frankfurt, Germany, the ECB employs more than 3,500 individuals coming from different parts of Europe and collaborates with the national central banks within the euro area (Eurosystem). Unlike the government of the United States, which in contrast only needs to consider its personal interests, the ECB must create monetary policies in a way that would best benefit all countries connected by the EUR. Although directly governed by European law, this institution resembles a corporation due to its structure of three decision-making bodies: the Governing Council, the Executive Board, and the General Counsel.

The ECB is a single-mandate institution tasked with setting the interest rates for the eurozone, managing the eurozone’s foreign currency reserves, ensuring the supervision of financial markets and institutions and the functioning of the payment system, authorizing eurozone countries’ production of the EUR banknotes, monitoring price trends, and most importantly assessing price stability (inflation). Unlike other central banks, the ECB is not responsible for promoting employment or growth; however, this approach appears to be slowly changing, realizing the need to foster economic development. With regards to decision-making, the main body within the ECB responsible for this task is the Governing Council and all decisions are based on the majority of the votes of the body’s members. It consists of the six members of the Executive Board, accompanied by the governors of the national central banks of the 19 eurozone countries.
The Governing Council typically meets twice a month at the premises of the ECB, yet the monetary policy will be announced in only one of these meetings. The current President of the ECB, Christine Lagarde, who was born in Paris, France, has been performing this task since November 2019. The ECB President, who has the tie-breaking vote, bears a variety of responsibilities: heading the executive board, governing different bodies within the ECB, and representing the bank abroad.

Key Economic Reports

Eurozone’s economic reports differ greatly from the ones of other countries outside Europe. Australia, for example, creates a report that only concerns the country in question. When it comes to the Eurosystem, there are as many reports as there are member countries. Nonetheless, only the reports of France and Germany are said to be of importance for forex traders, as the former holds 40% and the latter holds 20% of the eurozone’s GDP, making the two countries 60% holders of the entire GDP of the Eurosystem. Therefore, due to the previously mentioned percentage, the occurrences within Germany and France should carry more meaning than those in smaller countries.

The main reports traders should be concerned with are then the GDP and employment reports of France and Germany. Moreover, apart from these independent reports, traders should also look into the Eurozone’s employment reports, providing information for the entire Eurosystem. Last, French, German, and eurozone inflation reports (CPI and PPI), are also vitally important as the ECB’s main goal is to combat inflation and its monetary policy will cover all territories governed by the EUR. As the eurozone tends to be growing, the reports in question will cover more and more territories, and traders should keep up with the relevant information in order to be on top of the events pertaining to the EUR.

The Most Traded Pairs

The most traded pairs involving the EUR are EUR/USD, EUR/JPY, EUR/CHF, EUR/GBP, EUR/CAD, and EUR/AUD. As the most traded pair in the world, EUR/USD 36% of all trading volume in the world, which is almost half of all transactions worldwide. As traders interested in news events primarily define liquidity, such great interest in this currency pair probably originates from the fact that it has the most liquidity. The second currency pair in line, EUR/JPY, is said to have the most liquidity, alike EUR/CHF which rounds up the three most traded currency pairs that overall do the most business. The other crosses, EUR/CAD and EUR/AUD appear to be quite popular in the currency market due to their overall good movement and predictable patterns, but the liquidity is not as good as with the first three pairs. Unlike EUR/USD, EUR/JPY, and EUR/CHF, these two currency pairs are increasingly more prone to slippage and volatility. Finally, EUR/GBP is believed to be less volatile than other EUR- or GBP-based crosses owing to the economic closeness and mutual dependence, but changes in the currencies’ respective central banks’ monetary policies could render this pair highly sensitive.

EUR Correlations

  • EUR/GBP

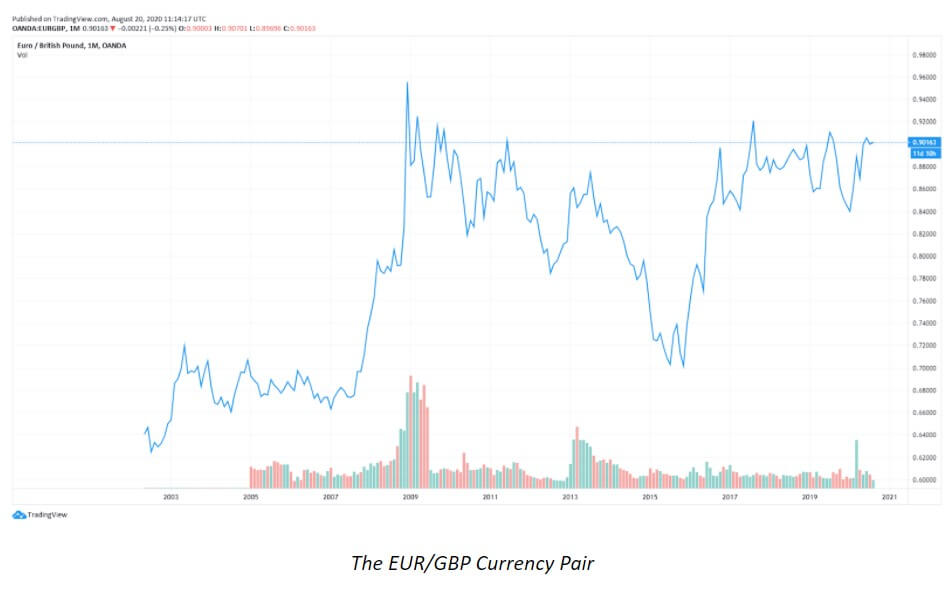
A vast quantity of trade the United Kingdom does is with Europe and vice versa, which is what brought on this prominent correlation in the first place in addition to the two both belonging to the eurozone. Despite them using two different currencies, we can with almost absolute certainty predict that if Europe is struggling at a specific point in time, the UK will most likely follow. In the past few years, this correlation has been impacted by various events that took place across Europe. The 2007/2008 financial crisis affected the entire world, but the UK managed to quickly take action to preserve its economy and currency. The UK’s official currency did plummet and the British economy was on the path of collapsing when in late 2008 the GBP reached its all-time low of €1.02. However, they considered revising their monetary policy and offering quantitative easing which eventually helped the country stabilize the economy.

Europe, on the other hand, took more time to come to terms with what had happened and, in the first two years after the crisis had occurred, Europe created the laws that would later prevent them from enacting bailout plans. Changes had to be made and soon after, between 2013 and 2015, Europe would face the emergence of great debt problems in Portugal, Greece, Spain, and Italy. With the announcement of Brexit in June 2016, the GBP suffered the greatest one-day fall of 6.02% against the EUR. Before the COVID-19 pandemic, the GBP was slowly getting back on its feet, but the current ongoing viral threat and the expectation of a new trade deal between the EU and the UK still make the EUR/GBP imitate the strained relationship between the two. The currency pair even went from its worst (1 EUR equaled 0.8301 GBP in February 2020) to its best exchange rate (1 EUR equaled 0.9427 GBP in March 2020) in one month. 

  • EUR/CHF

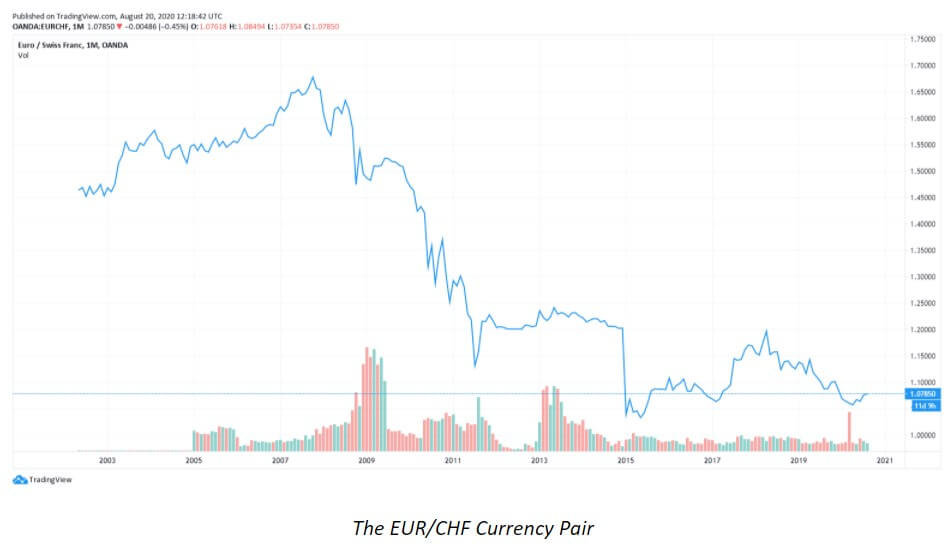
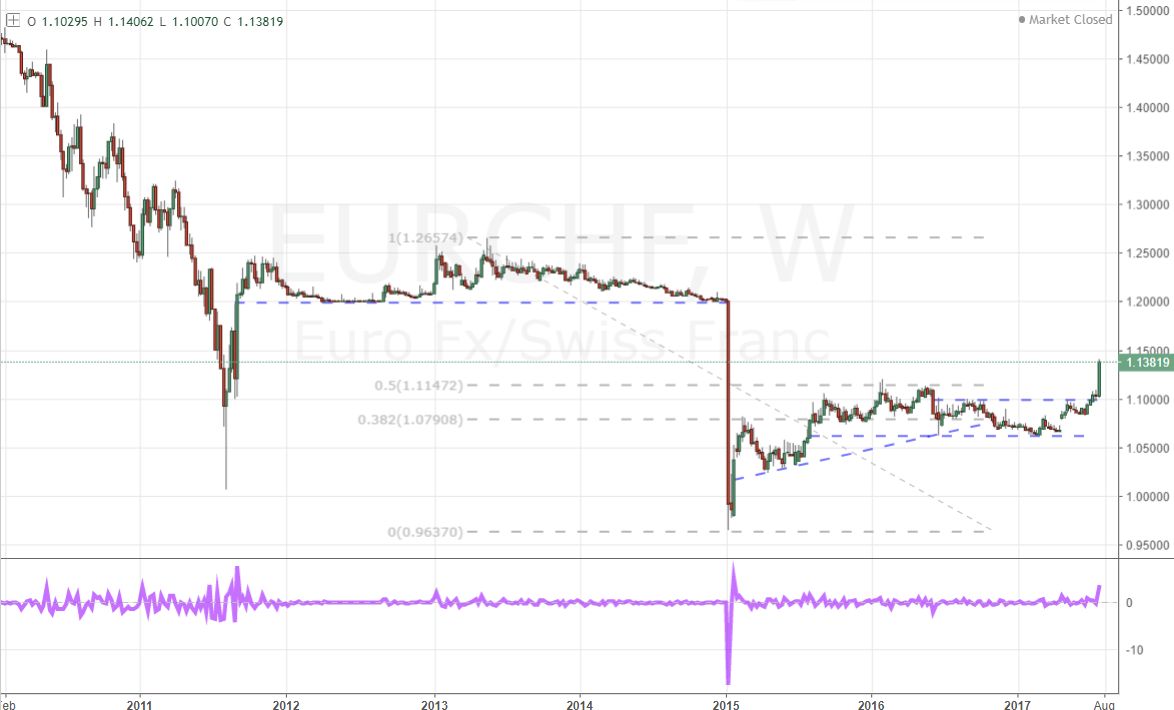
The correlations between the two currencies have been said to near 100% in particular due to the Swiss policies that have tied the CHF to the EUR. In the times of the EUR crisis, when the currency was plummeting, a great amount of money was directed to Switzerland. The Swiss banks are said to be some of the strongest ones in Europe and their neutral government was believed to be extremely stable, which is why many decided to send their euros in that direction. Owing to this great sell the EUR-buy the CHF movement was reflected in the currency pairs huge moves. At the peak of the crises, the pair would move from 1.40 to 1.05 in a matter of a few months. The moment this happened, the Swiss National Bank (SNB) decided to take action, particularly because their currency was that strong at the time. They put a peg at 1.20 and the chart moved 1500 pips up in approximately one hour. The correlation is still quite high and this generally indicates that the currency pair in question is not the best pair to trade. The EUR/CHF is currently believed not to be the pair from which traders can earn the most because if the EUR moves up, so will the CHF and vice versa. These simultaneous moves will often be of the same amounts and the opportunities to make money are thus limited with this currency pair. Instead of trading this pair, some professional traders believe that one should simply choose to trade other EUR-based pairs due to the greater liquidity of the currency.

Trading the EUR

Country Stability

The JPY and the USD are believed to be the safe-haven currencies, yet the USD may at times exhibit some unfavorable behavior. Traders would in such cases naturally divert to the other currencies with the greatest liquidity, i.e. the JPY and the EUR. The USD generally performs well in times of crisis, while in times of economic prosperity these currency pairs such as AUD/USD or USD/JPY seem to be too small liquidity pools. Naturally, the EUR is a favored alternative due to its high liquidity.

Interest Rates

The interest rates within the eurozone averaged 1.84 percent between 1998 until 2020, with an all-time high of 4.75% reached in October 2000 and a record low of 0% in March of 2016. Currently, the ECB’s interest rate is still set at 0%, last confirmed in July this year. The EUR is typically expected to be in the middle compared to other central banks’ rates (available below) and according to some econometric models the Euro area’s interest rate is projected to trend around 0.00 percent in 2021 as well.

Inflation

The topic of inflation is the European Central Bank’s most important aspect and is, thus, an extremely important indicator to which traders should be attentive when looking into Europe’s reports. Each European country has its individual CPI and PPI, but the same of the eurozone is also extremely important and informative. If inflation is below 2%, the ECB is likely to ease the monetary policy, while the approach may change towards the other end of the spectrum should it exceed 3.5%. 

Trade Deficits

Unlike the GBP or the USD, the EUR generally does not suffer from trade deficits, as this has traditionally not been a cause of concern in trading with foreign countries with regard to this currency.

Economic Activity

In terms of the overall economic activity within the Eurosystem, traders should look into GDP reports discussed earlier in the text and, in particular, Germany as the largest European economy and the biggest driver.

Market Analysis

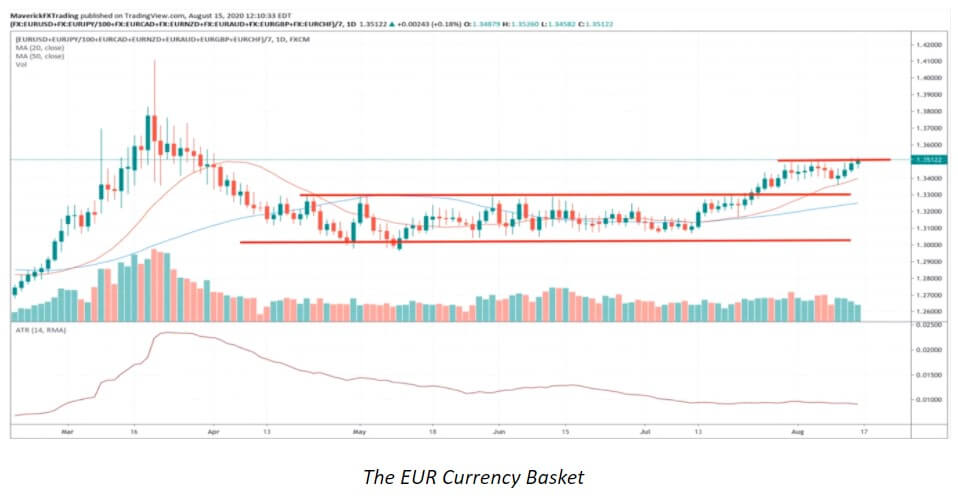
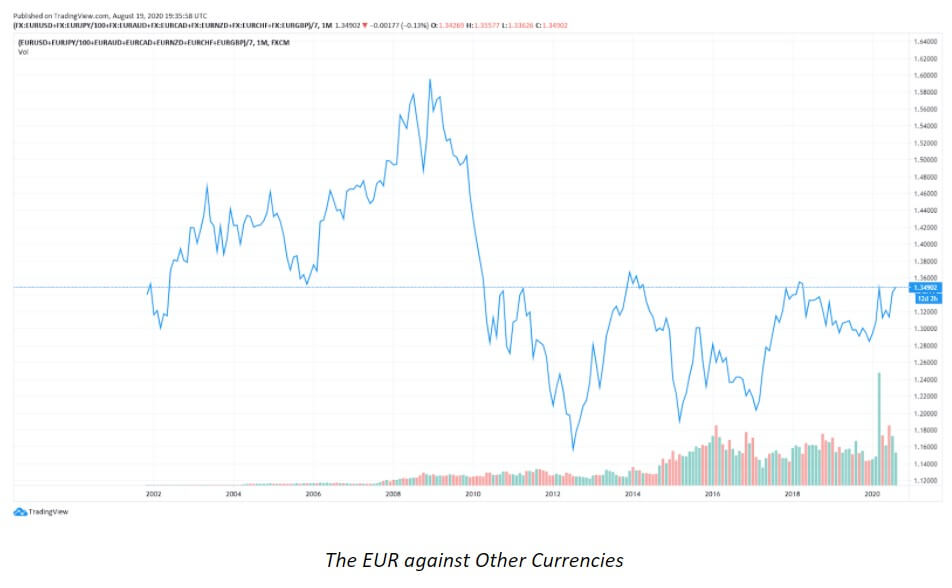
Currently, we are witnessing a decline in overall market volatility with an impactful momentum building up across the markets. As the market keeps moving up, the volatility appears to be further declining. The pattern we are witnessing now, forming towards the end of the chart below, shows how the price broke out and pulled back only to change direction upwards. The EUR crosses rarely appear to be short of such interesting patterns and they seem to be preferred to the upside.

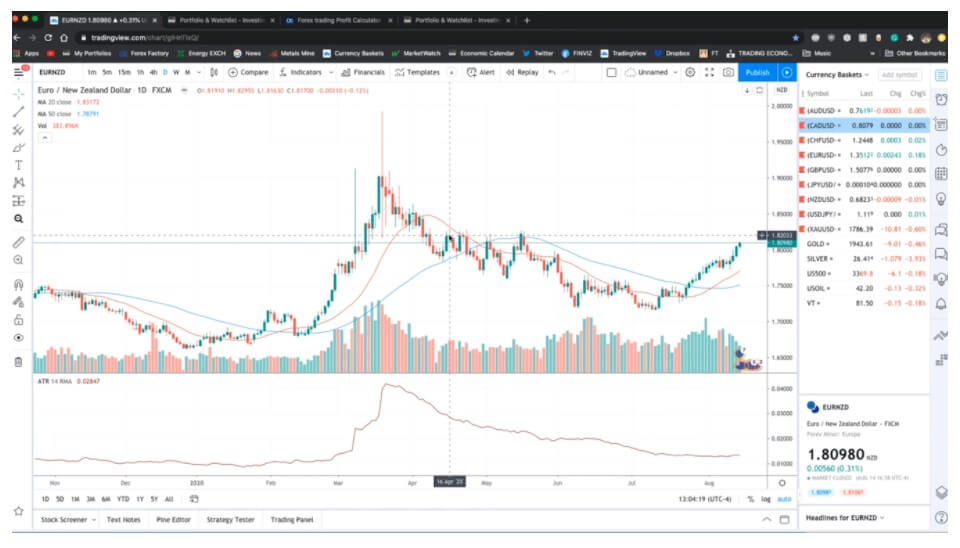
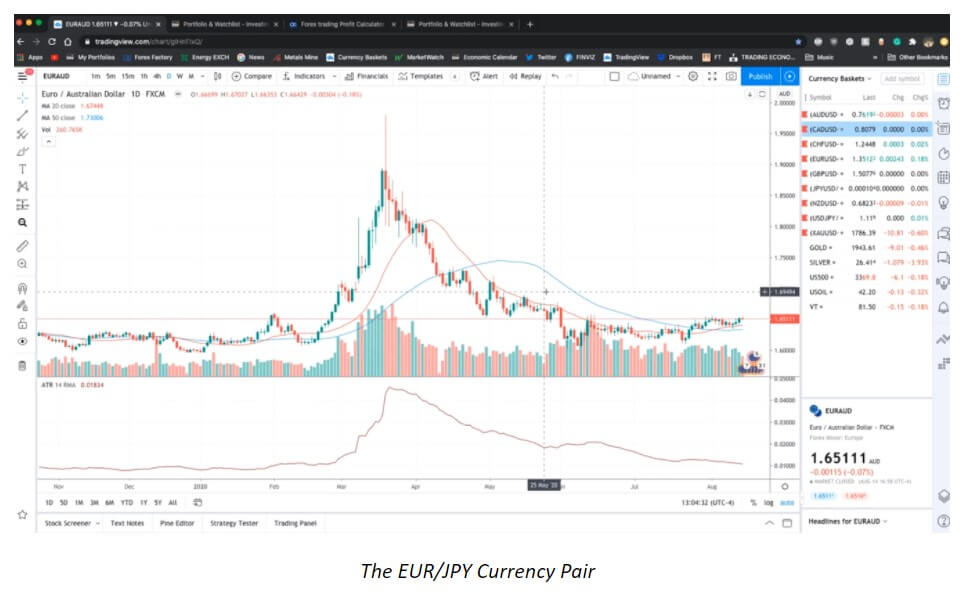
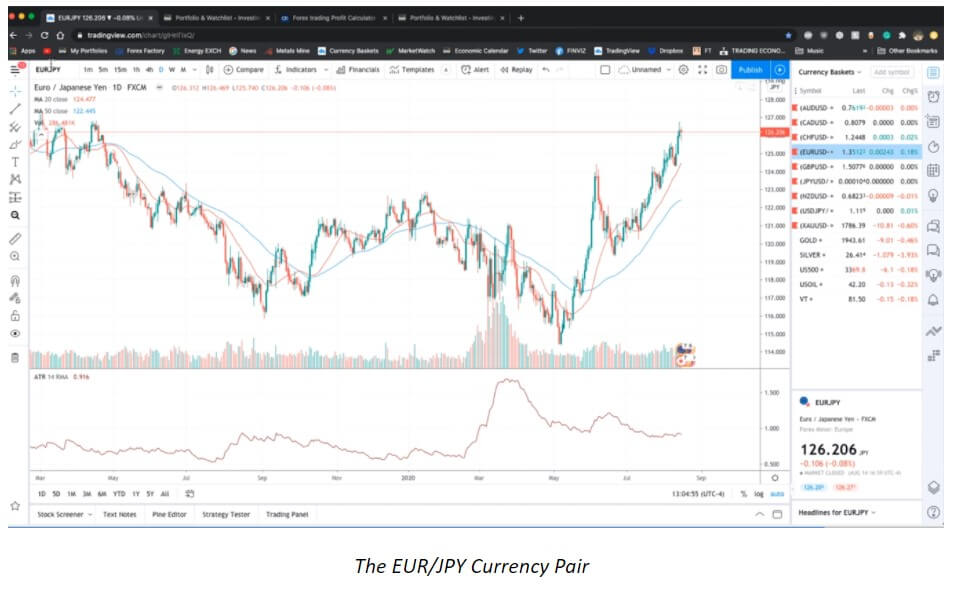
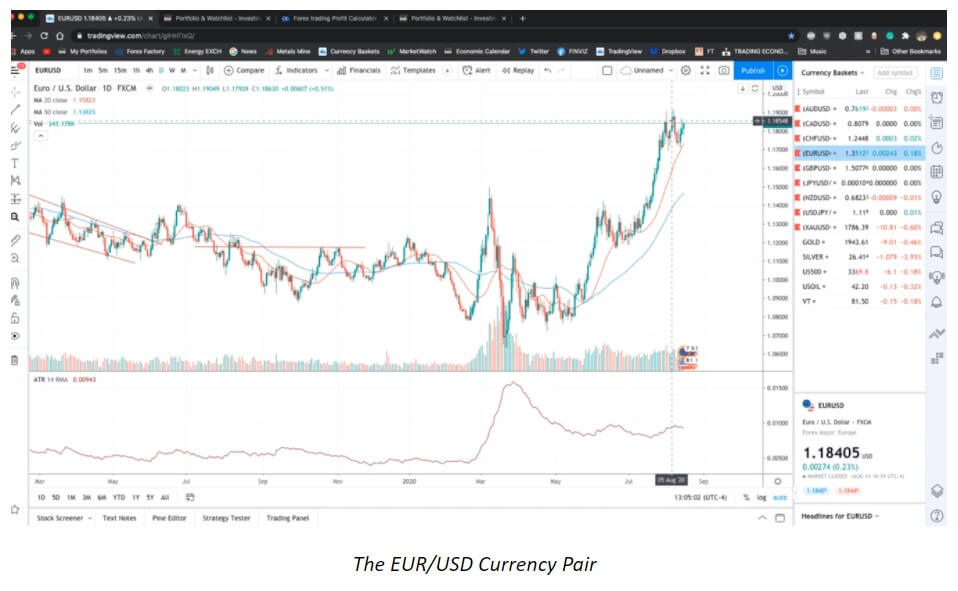
The EUR crosses seem to be developing really well and the EUR/NZD chart, for example, reveals some moving average crosses towards the end of the chart (see all charts below). The EUR/AUD pair also demonstrates this positive development, although we could potentially see a turn of events should the AUD weaken. The EUR/JPY is revealing a momentum taking place, especially when assessing a wider time frame. The EUR/USD activity is unfolding slowly and should it break at some point soon, the price could potentially exceed 1.20. Generally looking at the EUR basket, there seems to be a great possibility for a breakout very soon.

The market has not been showing a great deal of action in the previous few weeks, thus not pushing traders to enter new trades each day. As the final week of August is about to complete the month, we are looking into September expecting more volatility to break the previous consolation and calm periods. Traders interested in trading news events may need to patiently wait out this quiet period, awaiting new rounds of important reports to come out. The EUR currency pairs are doing well during this period, as it seems from the charts above. Nonetheless, for the time being, it is quite difficult to completely interpret the long-term effects the COVID-19 is going to have on the currency.

The EUR has already undergone crises in the past and yet it has lived to become an even stronger currency. The monetary policy of the ECB seems to be slowly adapting and Europe appears to be working hard to promote the currency and ensure its autonomy. The EUR has never challenged the USD and the EUR’s share in international is significantly lower. Still, the media shows an interest in the development of the EUR in these times of crisis, highlighting the belief that the currency’s potential has not been fully reached on a global scale. The EUR has certainly struggled in the past, in particular when the stronger countries had to step in and provide assistance to the weaker ones.

Despite the global viral threat and the history of this unusual currency, the ECB maintains a positive outlook with regard to the EUR, hoping to further promote the currency through a series of vital steps as well as fiscal and monetary policy changes. Currently, we are looking into the future where the EUR is directed towards stabilizing the monetary union, increasing the currency’s influence, and granting more benefits to the eurozone’s member states.

Categories
Beginners Forex Education Forex Assets

How to Choose a Currency Pair for Trading in Forex

Two mistakes that a lot of new traders make is to simply select a random currency pair to trade or to try and trade too many different pairs at once. An important thing to do when first starting out is to decide which currency pair you want to trade with, you can, of course, change this decision in the future or to pick up multiple other currencies once you have a bit of experience. However, that initial first currency pair can make a big impact on your trading. This is why we are going to be looking at how you can choose that first currency pair that you are going to trade.

Before we select the pair that we are going to be trading, we need to actually understand what a currency pair is. The currency pair is what it sounds like, it is simply a quote of two different currencies. There is the base currency which is the first currency listed so in the EURUSD pair, it would be the EUR, the quote currency pair is the second currency, so again for the EURUSD pair, it will be USD. The quoted figure is the current exchange rate of the base currency for the quote currency. For example, for the EURUSD it may be 1.11 which would mean that you get 1.11 USD for each Euro traded.

When first starting out with trading, it is recommended that you select one of the major currency pairs. This is for the simple reason that the amount of volatility is lower and the amount of liquidity is higher, this offers a much safer trading environment with less violent price movements than some of the minor or exotic currencies. Some of the major currency pairs to think about have been listed below along with some of their main characteristics, to give you an idea of what is involved in them and how they may behave.

EUR/USD

This is the world’s most traded currency, this currency pair has the highest level of liquidity out of any of the available currency pairs. Due to this, it is also one of the most stable. While it does have a lot of large trends, moving large distances, it does this at a slower pace, never jumping too far with a single tick. Many describe this pair as one of the safest pairs to trade due to it having the lowest spreads of all currency pairs. This pair is most active during the European and American sessions and can have some added volatility when there is news within the Eurozone and the United States.

USD/CHF

The US Dollar against the Swiss Franc, this pair often moves the other way to EURUSD, it has smaller movements with very few large jumps and often has a small spread making it one of the safer currencies to trade. The Swiss Franc is a safe haven currency which means that when there is a crisis or economic drop, it can also go down in value, this pair is active during both the American and European sessions.

GBP/USD

This used to be quite a safe pair to trade, but now with Brexit happening it is a little less predictable. There is still hope that once the Brexit saga is over that it will return to its old steady self. It is still incredibly popular for traders due to its increase in volatility and profit potential. It can have slime huge movements which are perfect for trend traders but also have a lot of breakouts as well as false breakouts which can catch people out. This pair reacts a lot to events in Britain and is most traded during he European and American sessions.

Other pairs include things like the USDJPY, USDCAD, AUDUSD, and NZDUSD, those are the other major pairs. Generally, they will have lower levels of volatility than the minor pairs but can still react quite a lot to major news events. They are often good for trend trading as they can have long drawn out movements rather than large and quick jumps.

The minor pairs include things like EURJPY, GBPJPY, EURGBP, EURCHF, GBPCHF, EURCAD, and GBPCAD, these pairs can have some added volatility to them and so are often not recommended for new traders. Instead, stick to the major pairs to start. The Exotic pairs include things like USDZAR, USDMXN, USDTRY, and USDRUB. The liquidity on these pairs are lower so you cannot make as larger trades at once and they can also jump about a lot which can make them very profitable, but also very dangerous which is why they are not recommended for beginners.

We mentioned above that it is recommended that you only trade with a single currency pair to begin with, this allows you to concentrate fully on that one pair. It also means that you are able to learn more about the way that the currency pair moves, allowing you to better analyze and trade it. You can branch out afterward, but we recommend learning all that you can about one before you try looking at another. You do not want to get confused and to mix up the characteristics of different pairs as this can lead to a series of losses.

In order to select the pair that you want to trade, you will need to look at a few things. The first is the strategy that you are going to be using. Some pairs are better for longer-term trading and others for the short term. If you are a scalper then you want a pair that has more volatility. If you are a trend trader, then you want one that goes on larger and longer movements over time. You also need to consider the time that the pair is most active. If you are from the Uk, then there is no point in trading a currency pair that is most active in the middle of the night, instead of one that works for the time that you will be up and that you will be free. 

You should also consider the spreads. Different pairs have different spreads. If you are looking for short-term trades or to scalp, then we would not recommend getting a currency pair with a larger spread. This will make it very difficult for you to make a profit, so instead, you would need to go for one with a small spread. This doesn’t matter quite as much for trend traders, but it is still worth considering the impact of the cost of a currency pair when looking at your potential profits.

So those are some of the things that you should think about when you are selecting a currency pair to trade. Think about your strategy, the costs, and when you are available to trade, then think about the characteristics of the different pairs. Work on one pair at a time until you have a good understanding of it and then move on to your next one. Don’t try to do too much at once and you should get on just fine.

Categories
Beginners Forex Education Forex Assets

The World’s Top Forex Currencies

Many Forex traders make the mistake of not thinking about what they are trading beyond price fluctuations on a screen. While it is true in trading that the price is king and also that prices are never too high or low not to be able to rise or fall any more, over time it will work better if it understands what makes the currencies it negotiates unique. Understanding Forex’s major global currencies will make you a better trader, more focused, and more profitable.

What are the World’s Leading Forex Currencies?

There are eight currencies that are the most important in the Forex universe. These are the most important, more or less, according to the consensus:

  • USD (U.S. dollar)
  • EUR (Euro)
  • JPY (Japanese Yen)
  • GBP (British Pound)
  • CAD (Canadian Dollar)
  • CHF (Swiss Franc)
  • AUD (Australian Dollar)
  • NZD (New Zealand Dollar)

In addition, the Chinese yuan (CNY) is becoming increasingly important, although it is not yet fully convertible. There is an onshore Yuan and an offshore Yuan, the last of which is offered for trading by many Forex brokers.

The ranking shown above was not simply ordered by relative GDP or any other economic indicator. Instead, the level of importance given to individual currencies takes into account convertibility, its use as a global reserve, and its correlation with important raw materials. For example, there are several countries, such as India, which have economies much larger than Switzerland or Australia. However, Australia is a major producer of gold and several other raw materials used in manufacturing, while Swiss banks hold a large share of global private capital and especially of gold, which gives their respective currencies a weight that goes beyond the national economies they represent. You must think beyond the plain economic factors to succeed in understanding the major global forex currencies.

Currencies Are National Debt

All modern currencies are backed on paper by nothing more than the nation’s central bank’s promise to meet the obligation. Currencies are 100% debt.

The USD Is The King

The first thing that the trader must take into account in order to understand the main world currencies of Forex is that the USD is of paramount importance. All other currencies are first valued on the basis of their value against the USD. Therefore, you can trade in Forex markets much more easily by simply focusing on the other 7 currencies paired with the USD instead of worrying about every possible crossing, although there are some exceptions.

The importance of the USD is due not only to the large size of the US economy, which is larger than that of any other nation and almost as large as that of the entire eurozone. It is also due to the unique position of the United States as the architect of the global financial system and the world’s only superpower. The dollar is the world’s largest reserve currency, and there is still more cash wealth in USD than in any other currency.

This means that the USD will generally be the main driver of currency market movements. If people around the world want to keep the USD, it will go up and that will tend to weigh in most other currencies and vice versa. In the last 15 years, the USD has had a more predictable and strong trend than any other Forex world currency, which is something that helps to understand the main Forex world currencies.

“Security” and “Risk” Currencies

For various reasons, the market tends to view the following currencies as safe havens, so their relative value tends to increase when there is market turbulence that is caused by fears about global economic prospects: USD, JPY and EUR. The CHF used to be the main security currency, but its role as a safe haven is now considered to be lower due to some unbridled revaluations by the Swiss National Bank and also due to its very high negative interest rate of -0.75%.

Other currencies tend to perform well when there are good prospects for global economic growth. An appreciation of the appetite for risk in the face of risk aversion is a great help in understanding Forex’s major global currencies.

Currencies Related to Commodities

Certain currencies are highly correlated positively with the prices of various raw materials, as these countries are large producers of these raw materials in question. The most important examples are the CAD, which correlates positively with the price of crude oil, and the AUD, which correlates positively with the price of gold. NZD tends to perform well when there is a growing demand for dairy and lamb products.

Liquidity

Most traders will notice that different currency pairs have different “personalities”: some are very volatile and move quickly (a good example is GBP/JPY), while others tend to move in “2 steps forward, 1 step back” mode (the perfect example is the EUR/USD pair). This is due to the liquidity of the respective currencies. There are more euros and dollars than any other currency and this is why their prices tend to move quite slowly. However, when you look at currencies like GBP, JPY, and CHF, there are much smaller amounts involved and, when they are heavily in or out of demand, a liquidity constraint can cause the price to move very quickly.

Time of the Day

In general, currency prices move more during trading hours in London and New York, but also during your local business hours. This means, for example, that the GBP tends to be rather flat during the first part of the Tokyo session, while at that session there will tend to be more activity in Australian and New Zealand dollars, except during before the opening of London and later New York, which overlap to some extent with “domestic” business hours. This is partly due to the fact that currency exchange rates are often moved by economic data publications and central bank publications which, of course, are scheduled during domestic business hours.

While the factors discussed in this article are neither the first nor the only ones that traders will think about, taking this basic information into account can help them to be more flexible and successful in trading certain currencies.

Categories
Forex Assets

Costs Involved While Trading The NZD/INR Forex Currency Pair

Introduction

The abbreviation of NZD/INR is the New Zealand Dollar paired with the Indian Rupee. Here, NZD is the official currency of New Zealand, and Indian Rupee is India’s currency. Like other currency pairs, NZD/INR provides some decent movement that allows traders to make money from the forex market.

Understanding NZD/INR

In NZD/INR currency pairs, NZD is the base currency (First Currency), and the INR is the quote currency (Second Currency). In a currency pair’s sell trade, we trade the base currency to buy the quote currency and vice versa. Therefore, if the NZD/INR pair is trading at 49.02, it means we should have 49.02 INR to buy 1 NZD.

Spread

As price and bid price is a common term in the forex market, most of the traders should know. The price represents the price in which we sell a currency pair. On the other hand, the bid price is the price at which we take a buy trade.

The difference between the asking price and the bid price is called the spread, usually a charge that the broker takes from a trader. Below are the spread values for the NZD/INR Forex pair.

ECN: 36 pips | STP: 41 pips

Fees

A Fee is a cost that traders pay to the broker as a charge to take a trade. This fee differs on the type of broker (ECN/STP) we use.

Slippage

In some cases, when we take a trade at a particular price, it might ignore the level and open the trade at another price, which is usually known as Slippage. The Slippage can occur at any price level and at any time, usually when the market remains volatile.

Trading Range in NZD/INR

Our aim as a trader is to eliminate losses and minimize trading risks. The trading range here will indicate how much we will make as a profit or loss within a timeframe. To calculate the exact value, we will use ATR is a technical indicator that suggests the price movement in a currency pair. In the lower table, we interpret the minimum, average, and maximum pip movement in a currency pair. We will assess it merely by using the ATR indicator merged with 200-period SMA.

Procedure to assess Pip Ranges

  1. Add the ATR indicator to your chart
  2. Set the period to 1
  3. Add a 200-period SMA to this indicator
  4. Shrink the chart so you can assess a considerable time period
  5. Select your desired timeframe
  6. Measure the floor level and set this value as the min
  7. Measure the level of the 200-period SMA and set this as the average
  8. Measure the peak levels and set this as Max.
  9. NZD/INR Cost as a Percent of the Trading Range

The price of trade differs on the type of brokers and varies based on the volatility of the market. The full cost of trade involves fees, spread, and sometimes Slippage if the volatility is higher.

ECN Model Account

Spread = 36 | Slippage = 5 |Trading fee = 8

Total cost = Slippage + Spread + Trading Fee = 5 + 36 + 8 = 49

STP Model Account

Spread = 41 | Slippage = 5 | Trading fee = 0

Total cost = Slippage + Spread + Trading Fee = 5 + 41 + 0 = 46

The Ideal way to trade the NZD/INR

Considering the table, we should evaluate these two factors to make trading decisions in the NZD/INR pair. The trading cost and volatility are two critical factors that trade should contemplate when trading in the currency market.

In timeframes, we can see the price movement fluctuates from the minimum volatility and the average volatility. As a trader, we aim to make a profit from this pip movement and variation. However, it often becomes challenging to make a profit if there is no sufficient variant in the pip value. As per the price mentioned above, the NZD/INR pair is profitable in swing trading and day trading.

Categories
Forex Assets

How Expensive Is It To Trade The NZD/MYR Currency Pair

Introduction

The abbreviation of NZD/MYR is the New Zealand Dollar paired with the Malaysian Ringgit. Here, NZD is the official currency of New Zealand and many others like the Pitcairn Islands and the Cook Islands. It is also to be the tenth most traded currency in the Foreign exchange market. MYR stands for the Malaysian Ringgit, and it is the official currency of Malaysia, which is further divided into 100 sens.

Understanding NZD/MYR

In NZD/MYR currency pairs, NZD is the base currency (First Currency), and the MYR is the quote currency (Second Currency). In the foreign exchange market, while we sell the currency pair, we always trade the base currency and simultaneously purchase the quote currency and vice versa. The market value of NZD/MYR helps us to understand the intensity of MYR against the NZD. So if the exchange value for the pair NZD/MYR is 2.7977, it means we need 2.7977 MYR to buy 1 NZD.

Spread

Foreign brokers hold two different prices for currency pairs: the ask and bid price. The ask (offer) price is the price in which we sell an asset, and bid(purchase) is the cost at which we buy it. The difference between the ask-bid price is called the spread. Below are the spread values for the NZD/MYR Forex pair.

ECN: 38 pips | STP: 43 pips

Fees

A Fee is the costs that we tradesmen pay to the broker for initiating a trade. This fee differs on the type of broker (ECN/STP) we use.

Slippage

When we want to achieve a trade at an appropriate price, but instead, if the trade gets fulfilled at a distinctive price, we call that distinction as Slippage. The Slippage can occur at any point in time, but often we can counter a volatile market.

Trading Range in NZD/MYR

As a trader, our main interest should be to prevent losses and minimize risks. The trading range here will ascertain the amount of income we will make or lose within a timeframe. ATR is a technical indicator that suggests the price movement in a currency pair. In the lower table, we have the interpretation of the minimum, average, and maximum pip movement in a currency pair. We will assess it merely by using the ATR indicator merged with 200-period SMA.

Procedure to assess Pip Ranges

  1. Add the ATR indicator to your chart
  2. Set the period to 1
  3. Add a 200-period SMA to this indicator
  4. Shrink the chart so you can assess a large time period
  5. Select your desired timeframe
  6. Measure the floor level and set this value as the min
  7. Measure the level of the 200-period SMA and set this as the average
  8. Measure the peak levels and set this as Max.

NZD/MYR Cost as a Percent of the Trading Range

The price of trade differs on the type of brokers and varies based on the volatility of the market. The full cost of trade involves fees, spread, and sometimes Slippage if the volatility is higher.

ECN Model Account

Spread = 38 | Slippage = 5 |Trading fee = 8

Total cost = Slippage + Spread + Trading Fee = 5 + 38 + 8 = 51 

STP Model Account

Spread = 43 | Slippage = 5 | Trading fee = 0

Total cost = Slippage + Spread + Trading Fee = 5 + 43 + 0 = 48

The Ideal way to trade the NZD/MYR

With the assistance of the above tables, let us estimate these two factors to the trade the NZD/MYR pair. Volatility and cost are two aspects a trader must contemplate for trading any currency pair in the foreign exchange market.

In several timeframes, we can see the pip movement is tremendously elevated between the min volatility and the avg volatility. As a day trader, the objective is to attain profits from the pip variation of the market. It becomes challenging to make profits from the market if there is no variation in the pip value. Hence, trading this pair can be considered both profitable and risky. The answer to the question if trading this pair is expensive, is yes.

Trading using Limit Orders (STP Account Model)

To decline our expenses of trade, we can place the trades using limit orders as a substitute for market orders. In doing so, we can avoid the Slippage that will help lower the total cost of the trade. An instance of a Limit order is given below using the STP model.

Spread = 43 | Slippage = 0 | Trading fee = 0

Total cost = Slippage + Spread + Trading Fee = 0 + 43 + 0 = 43

Categories
Beginners Forex Education Forex Assets

The Euro, the Pound, and the Swissy

The title of this article is not some forex movie spinoff, although there is one “bad” currency in this article. Not all things work in forex trading. You will have tools and indicators that are just bad, and unfortunately, they are abundant. Additionally, some currency pairs are not good for your strategy. If you do not know by now, the trend following strategies are the most successful according to many research studies and confirmed by experience. A group of experienced prop traders has more success in certain currency pairs than with others. The most common ones are the EUR/GBP and the GBP/CHF, out of the major 8 currencies. We will discuss these three currencies, and why they are good for trend following trading. Also, some warning signs about trading that could even ruin the best trades out of thee pairs.

Note that all this material is just an opinion by a forex prop trade who is relying on a technical analysis most of the time. Therefore, trend trading like thins involves a lot of systematic, mathematical decision making using indicators in specialized roles. Following the trend and avoiding events that could disrupt it is also one of the elements. This implies the USD is not a really good choice for this trading type. Not that it is impossible to trade, just unlikely as good as involving the EUR, GBP, and CHF. Traders that have been doing this for 10 years say the USD is full of surprises that could ruin what looked like a very consistent trend. There are several reasons for this. The first one is that the USD is heavily manipulated by the big institutions.

One proof of this is the sentiment, every time traders go long, big players go short and move the price and vice versa. The USD pairs are also most traded, or most popular. This is the place where it is easy to counter the majority of traders’ positions. The big banks and institutions will go where the traders’ money is, hence why the USD pairs are also very hard to master, especially for amateur traders who use the same tools as everybody else. News events are also more frequent with the USD pairs, the price will move illogically to the report or doing extreme shakeouts before the move happens. Anytime you see the major events like the non-farm payrolls or interest rates, the market will go crazy, disrupting your strategy and planed trades.

The Power of Tweets

Interestingly, the USD is affected by one more phenomenon – Trump tweets. Whenever the president of the US has some comment, regardless if it is related to the US economy, the media start to make stories and predictions to which forex market reacts. Now, we have one more event to pay attention to, making the USD unforgiving, choppy currency. If you like trading the news, this is not something you could use to your advantage, these events are unpredictable, unlike the reports. There is no “logical” move behind them.

Luckily for every forex trader, there are cross pairs. Cross pairs can be defined as the ones that do not have the USD, among other definitions. Again, most of the traders do not come to these markets for several reasons. Of course, it is ok to specialize on one or a few currency pairs, but we all know the basic rule of the Risk Management, diversification is good for your loss protection, never put all of your eggs in one basket. There will be times your favorite pairs will act differently, your system will have a hard time giving you any gains. If you have a specialized system, it means you will not be able to trade once markets change their face, there will be no market you can migrate your system to.

Options for Trend Followers

Back to the currencies that we think are the good ones for trend followers. The advantages of the EUR come from the currency segregation. The Euro is segregated, it is a currency of many EU countries, and it has low relation to the US economy. The EUR/USD is of course affected by the news events from the US but if we look at the EUR alone, it does not care what the USD is doing. The news that the EUR has are scattered, you will see interest rates of Germany, France, and other strong countries, but the impact they will have on the EU and the EUR is not as strong. The EUR is unlike the CAD, for example, where every bad or good event affects the price of CAD drastically. Also, the EUR news schedule is not as tight as with the USD, they are easy to follow and the ones that are not tied to a specific EU country are those that matter. You can easily plan accordingly when you know the ECB is releasing the decision on the interest rates, for example. You do not have to worry about the tweets or hysterical media that make markets go wild.

Moving on to the GBP, this currency is an oldtimer on forex. It has its own “personality” and is not correlated to anything. Depending on how much you are familiar with the market, you may notice that the EUR and the CHF are somewhat correlated. The USD and the JPY are also similarly correlated, they are both regarded as the safe-haven currencies. The USD and the CAD are correlated because they are both North American currencies. Unlike these, the GBP is not correlated to anything. Because of this, the GBP pairs are on the constant move, the constant move means strong quality trends. More trends mean more gains for trend followers. Sideways movement is bad for trend traders and GBP does this rarely. Just pay attention, when the GBP moves sideways, these ranges are whipsawing faster and higher than with other currencies.

Another specialty about the Pound is that the moves are more extreme, this is easily spotted if we compare the ATR (Average True Range) of GBP pairs and other non-exotics. Similarly to the EUR, GBP news events are also easy to follow. It is common to see the same type of news affect the GBP, fewer surprises – fewer losses. What news events affect major 8 currencies the most would require another article, but it Is important to know the outlines about the GBP, EUR, and CHF.

Coping with Neutrality

The Swissy is very neutral, just as the country politics itself. Very few news events affect the CHF, the only one you need to pay attention to is the Swiss National Bank. Whatsmore, the SNB does not have a lot to say. This means you can leave your trades running, the news will not affect trends as much. Another similar currency to the Swissy regarding this is the JPY. Swissy is also regarded as a safe haven currency, it is common to see it negatively correlated with the equities market but also positively correlated with the EUR. This is not always the case of course although when the Swissy correlates with the EUR the movements are not to the same extent. This trait of the Swissy can be used for so-called Pairs Trading method. Whatsmore, this gives you the ability to “switch” the trend if you have a position with the EUR, move it to the CHF where the news event will not affect it much.

There are moments in the forex market where a certain currency will behave like a major news event was ongoing even though you will not see anything that could cause such a drastic move. AUD might be one of these currencies, but not the CHF, at least not always (remember the CFH flash crash off the peg?). So Swissy is also the currency with few “weird” moves that do not have any arguments. It is usually the big banks play when you see something like this. So predictability is great, always take inherent risk into account with a certain currency. You mat even eyeball some chart and see if it is too choppy for your system, do you see some spikes and are those spikes affected by news which you can predict or not.

This trio can make a lot of gains when paired together. Starting with the EUR/GBP, what is so special about it?. It is the slowest out of the major 8 pairs. According to the ATR, this is what is usually seen and measured on the charts historically. Slow movement can be a good thing when you want more control. The pair is also USD news proof. The relation to the USD news is minor at best so you can focus only on GBP and the EU news, which are easy to follow. The movements on the EUR/GBP are rarely in balance, more often than not there are some trends in this pair. So when you combine something that has slow predictable movements, without much news disruptions and having trends…this is the golden choice for trend traders.

Still, this pair is not on the top of the most traded pairs list, not even close. The analogy of this might be like when most people want to have a trendy iPhone smartphone instead of a Samsung, even though it may not be a good fit for their needs or financial capabilities. According to the reports of professional prop traders, this pair has a great winning percentage. If they have a signal to buy on the GBP, they would rather trade the EUR/GBP than the GBP/USD. They are not even splitting the risk profile on two, just go full on the EUR/GBP. The probabilities they have gathered say it is just better to allocate positions on this pair, even if it means more risk by not diversifying.

Other Pairs to Consider

Moving on to the GBP/CHF, the ATR of this currency pair is higher than the EUR/GBP. The Swissy is a single national currency, unlike the EUR and is sensitive to the GBP movement, boosting the momentum. So if the EUR/GBP is too slow to trigger your trade entry or exit, check this pair as there are similar qualities. To some extent, this causes the pair to be even more trendy than the EUR/GBP. Having better “spool” and consistent trends. Stagnation is not common, at least not for the forex majors pairs standards. As with the rest of the pairs, the news events are not frequent, do not cut the trends, and are predictive. The USD events’ effects are not noticeable. GBP/CHF pair is very very unpopular. As such do not expect those weird price action movements without any news to back it up, nor sudden whipsaws.

The EUR/CHF, well, this is the one to avoid. Consider how much the Swissy is correlated to the Euro. Are the baskets similar? Compare the sideways or consolidation ranges to the GBP. You will understand this is a place where trenders either do not trade a lot or just lose. The stagnation or positive correlation to the EUR can change, at this moment this pair is moving nicely like the CHF is now more expressive in less certain times. Trading the EUR/AUD would be the same as trading the EUR/CHF a while ago before 2018, but now it is a bit different. The correlation will probably start again when the markets get out of the (if) COVID-19 crisis. For now, there is not enough historical evidence to say this pair is not correlated anymore. If you are trading this one, try it with less risk.

These observations can be seen on the charts. When we open the mentioned currency pairs charts in the MT4 or any other trading platform, you will notice the sideways movements on the daily timeframe that could last for a month or two. These are areas you should avoid. Some traders can spot these periods by the naked eye, others rely on indicators. These types of indicators are not common, but this is another subject. Take all of this as advice, especially if you have a trend following system.

A few more warnings or tips for you. When you see the GBP/CHF and the EUR/CHF charts and you have a signal on one but the other is very close to giving one, do not wait for it, go with the first pair with a signal. This hesitation could lead you to miss great trades. Professional prop traders are often calm when they lose a trade, although when they miss significant trends because they are late to the party, they are very self-critical. The second tip or a warning is not to trade GBP/CHF and the EUR/GBP at the same time. Your exposure on the GBP will be doubled, so trade one or split the risk if you have two signals.
To conclude, be aware of the USD, if you trade USD related pairs, go with reduced risk or smaller positions. Find more opportunities with cross pairs, they tend to have better trends, especially the ones mentioned. Finally, the elementary part of your Risk Management setup should be not to overexpose on one currency, remember the eggs and the basket.

Categories
Forex Assets

Analyzing The Costs Involved While Trading The EUR/DKK Forex Pair

Introduction

The Euro Area’s euro against the Danish Krone, in short, is written as EURDKK. This is an exotic pair in the forex market. Typically, this pair is traded with low volumes. Here, EUR is the base currency, and DKK is the quote currency.

Understanding EUR/DKK

The current market price in the exchange of this pair depicts the value of Danish Krone equivalent to one euro. It is simply quoted as 1 EUR per X DKK. For example, if the current value of EURDKK is 7.4702, then about 7.5 DKK are required to buy one euro.

EUR/DKK Specification

Spread

In the foreign exchange market, spreads are the primary source through which brokers make money. They set a different price for buying and a different price for selling the same currency pair. This difference is referred to as the spread. This spread varies from broker to broker and also from the type of execution model used.

Spread on ECN: 40 pips | Spread on STP: 42 pips

Fee

This fee is the same fee is paid to the stockbrokers. In other terms, this is the commission that is paid to the broker. The fee on ECN accounts is between 5-10 pips, while it is nil on STP accounts.

Slippage

The difference between the price at which the trader executed the trade and actual executed price is called the slippage on the trade. This happens only on market orders, due to two reasons – Market volatility & Broker’s execution speed

Trading Range in EUR/DKK

As the name partially suggests, the trading range is a range of pip movements in a currency pair in different timeframes. Pip movement is also referred to as the volatility values. These values are extremely helpful in figuring the gain/loss that can be made on a trade.

Procedure to assess Pip Ranges

  1. Add the ATR indicator to your chart
  2. Set the period to 1
  3. Add a 200-period SMA to this indicator
  4. Shrink the chart so you can assess a large time period
  5. Select your desired timeframe
  6. Measure the floor level and set this value as the min
  7. Measure the level of the 200-period SMA and set this as the average
  8. Measure the peak levels and set this as Max.

EUR/DKK Cost as a Percent of the Trading Range

The total cost of the trade is determined by summing up the slippage, spread, and the trading fee. And this cost is not fixed. It varies based on the volatility of the market. Below is the tabular representation of the cost variation, which is signified in percentages.

ECN Model Account

Spread = 40 | Slippage = 3 | Trading fee = 3

Total cost = Spread + Slippage + Trading Fee = 40 + 3 + 3 = 46

STP Model Account

Spread = 42 | Slippage = 3 | Trading fee = 0

Total cost = Spread + Slippage + Trading Fee = 42 + 3 + 0 = 45

Note: The costs may seem significantly high because of the Spreads. As we know, these Spreads keep changing from time to time. At times we have seen the spreads for this pair being as low as 12. But we have considered maximum spread to give you the maximum cost percentages.

The Ideal way to trade the EUR/DKK

Trading the EURDKK is different from trading the major/minor currency pairs. And this can be easily figured out from the percentage values.

From the table, we can infer that the percentage values are extremely high on the 1H, 2H, and 4H timeframes. This means that the costs in these timeframes are super-high. Hence, trading this pair on these lower timeframes is a bad decision.

However, if we look at the next three rows (1D, 1W, and 1M), we can see that the percentage values are significantly lower than the above values. Hence, this makes this pair tradable on the daily, weekly, and monthly timeframes.

Consider the charts of EURDKK on the 1H and the 1D timeframe. On the 1H timeframe chart, we can see that there is barely any movement in the price. Also, volatility is high here.

On the other hand, on the 1D timeframe, there is enough movement in the prices, and the volatility is not very high as well. Hence, making it the ideal timeframe to trade.

Moreover, a simple and effective way to reduce costs is by trading using limit and stop orders instead of market orders. In doing so, the slippage will be completely nullified. Hence, the total cost will significantly reduce.