Introduction
The abbreviation of NZD/MYR is the New Zealand Dollar paired with the Malaysian Ringgit. Here, NZD is the official currency of New Zealand and many others like the Pitcairn Islands and the Cook Islands. It is also to be the tenth most traded currency in the Foreign exchange market. MYR stands for the Malaysian Ringgit, and it is the official currency of Malaysia, which is further divided into 100 sens.
Understanding NZD/MYR
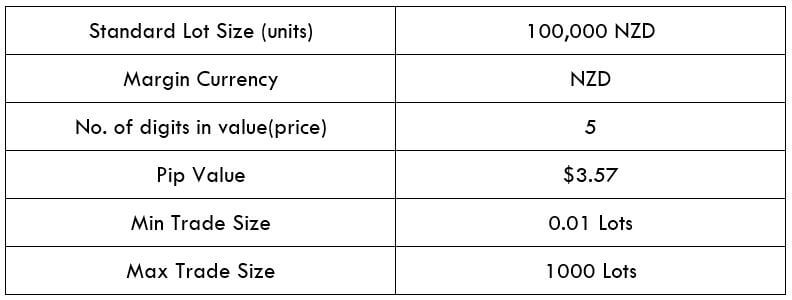
In NZD/MYR currency pairs, NZD is the base currency (First Currency), and the MYR is the quote currency (Second Currency). In the foreign exchange market, while we sell the currency pair, we always trade the base currency and simultaneously purchase the quote currency and vice versa. The market value of NZD/MYR helps us to understand the intensity of MYR against the NZD. So if the exchange value for the pair NZD/MYR is 2.7977, it means we need 2.7977 MYR to buy 1 NZD.
Spread
Foreign brokers hold two different prices for currency pairs: the ask and bid price. The ask (offer) price is the price in which we sell an asset, and bid(purchase) is the cost at which we buy it. The difference between the ask-bid price is called the spread. Below are the spread values for the NZD/MYR Forex pair.
ECN: 38 pips | STP: 43 pips
Fees
A Fee is the costs that we tradesmen pay to the broker for initiating a trade. This fee differs on the type of broker (ECN/STP) we use.
Slippage
When we want to achieve a trade at an appropriate price, but instead, if the trade gets fulfilled at a distinctive price, we call that distinction as Slippage. The Slippage can occur at any point in time, but often we can counter a volatile market.
Trading Range in NZD/MYR
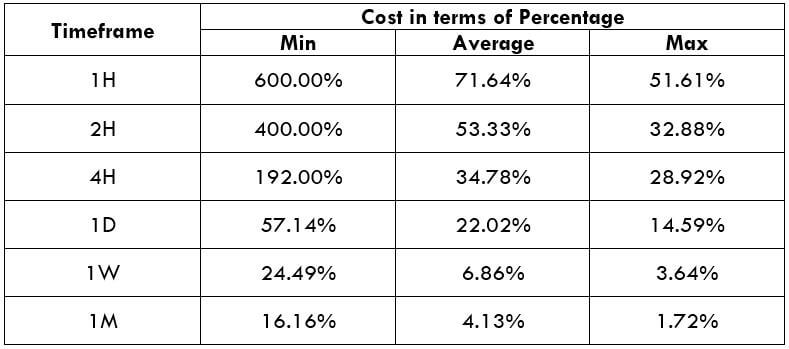
As a trader, our main interest should be to prevent losses and minimize risks. The trading range here will ascertain the amount of income we will make or lose within a timeframe. ATR is a technical indicator that suggests the price movement in a currency pair. In the lower table, we have the interpretation of the minimum, average, and maximum pip movement in a currency pair. We will assess it merely by using the ATR indicator merged with 200-period SMA.
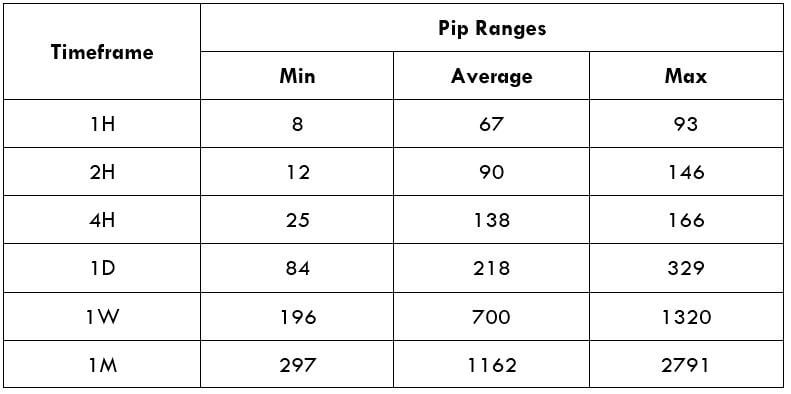
Procedure to assess Pip Ranges
- Add the ATR indicator to your chart
- Set the period to 1
- Add a 200-period SMA to this indicator
- Shrink the chart so you can assess a large time period
- Select your desired timeframe
- Measure the floor level and set this value as the min
- Measure the level of the 200-period SMA and set this as the average
- Measure the peak levels and set this as Max.
NZD/MYR Cost as a Percent of the Trading Range
The price of trade differs on the type of brokers and varies based on the volatility of the market. The full cost of trade involves fees, spread, and sometimes Slippage if the volatility is higher.
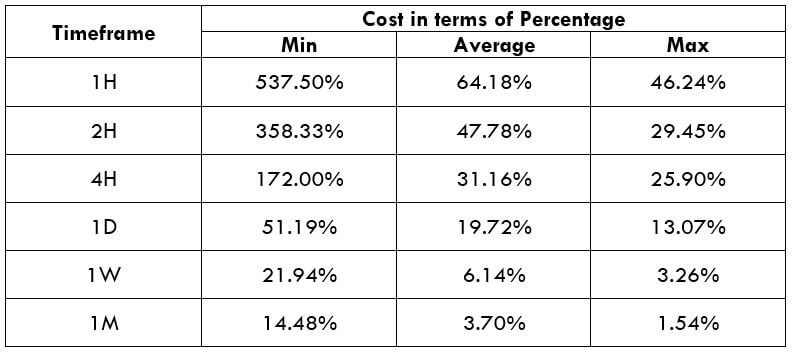
ECN Model Account
Spread = 38 | Slippage = 5 |Trading fee = 8
Total cost = Slippage + Spread + Trading Fee = 5 + 38 + 8 = 51
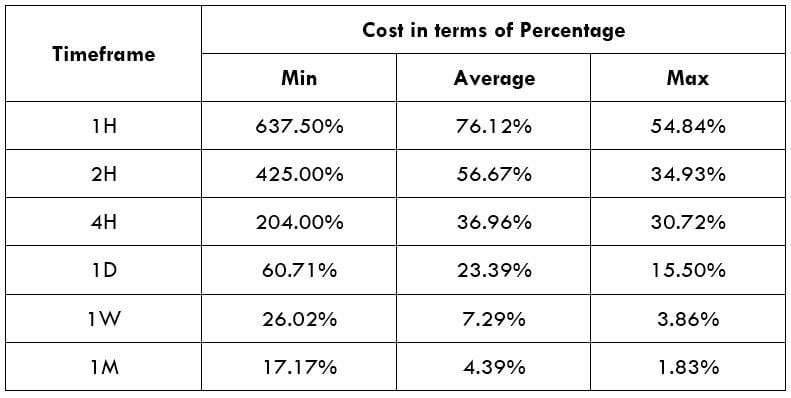
STP Model Account
Spread = 43 | Slippage = 5 | Trading fee = 0
Total cost = Slippage + Spread + Trading Fee = 5 + 43 + 0 = 48
The Ideal way to trade the NZD/MYR
With the assistance of the above tables, let us estimate these two factors to the trade the NZD/MYR pair. Volatility and cost are two aspects a trader must contemplate for trading any currency pair in the foreign exchange market.
In several timeframes, we can see the pip movement is tremendously elevated between the min volatility and the avg volatility. As a day trader, the objective is to attain profits from the pip variation of the market. It becomes challenging to make profits from the market if there is no variation in the pip value. Hence, trading this pair can be considered both profitable and risky. The answer to the question if trading this pair is expensive, is yes.
Trading using Limit Orders (STP Account Model)
To decline our expenses of trade, we can place the trades using limit orders as a substitute for market orders. In doing so, we can avoid the Slippage that will help lower the total cost of the trade. An instance of a Limit order is given below using the STP model.
Spread = 43 | Slippage = 0 | Trading fee = 0
Total cost = Slippage + Spread + Trading Fee = 0 + 43 + 0 = 43