Introduction
NZD/NOK is the abbreviation for the currency pair New Zealand dollar versus the Norwegian Krone. It is referred to as an exotic cross-currency pair. In this case, NZD is the base currency, and NOK is the quote currency. In this article, we shall learn about everything you need to know about this currency.
Comprehending NZD/NOK
Understanding the value of a currency pair is simple. The value of NZD/NOK verifies the Norwegian Krone that must be paid to buy one New Zealand dollar. It quoted as 1 NZD per X NOK. For instance, if the current value of NZD/NOK is 6.0549, then 6.0549 NOK is required to buy one NZD.
Spread
Spread is the keyway through which stockbrokers make income. The selling price and buying price are different; the distinction between these prices is termed as the spread. It ranges from broker to broker and their implementation type. Below are the spreads for NZD/NOK currency pairs in both ECN & STP account models:
ECN: 20 pips | STP: 25 pips
Fees
For every execution, there is a cost levied by the broker. This cost is also indicated as the commission/fee on a trade. This fee/commission does not apply to STP accounts; however, a few additional pips are charged.
Slippage
Slippage is the difference in the price executed by you and the price you indeed received. It occurs on market orders. Slippage varies on two factors:
- Market’s volatility
- Broker’s execution speed
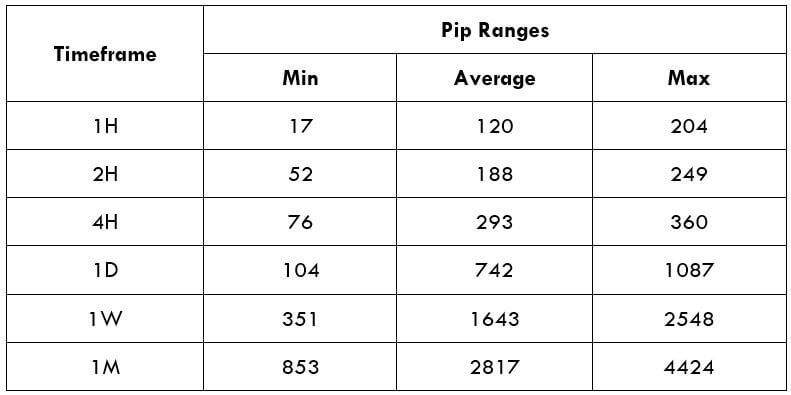
Trading Range in NZD/NOK
The trading range is a tabular description of the pip movement in a currency pair in a variety of timeframes. These values help in evaluating the risk-on trade as it defines the minimum, average, and maximum profit that can be made on a trade.
Procedure to assess Pip Ranges
- Add the ATR indicator to your chart
- Set the period to 1
- Add a 200-period SMA to this indicator
- Shrink the chart so you can assess a large time period
- Select your desired timeframe
- Measure the floor level and set this value as the min
- Measure the level of the 200-period SMA and set this as the average
- Measure the peak levels and set this as Max.
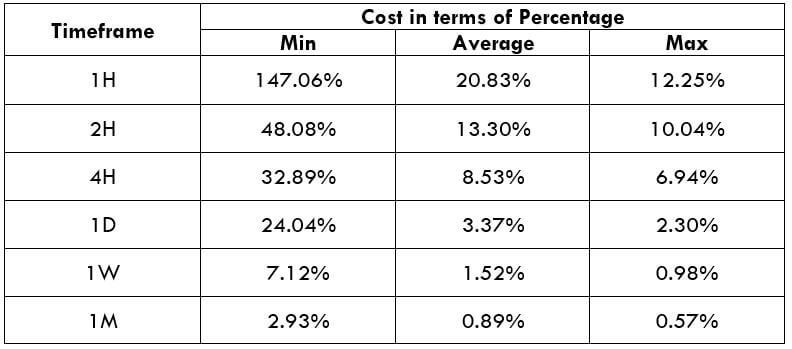
NZD/NOK Cost as a Percent of the Trading Range
The total cost of the trade shifts/changes based on the volatility of the market; hence we must figure out the instances when the costs are less to place ourselves in the market. The table below exhibits the variation in the costs based on the change in the market’s volatility.
Note: The ratio signifies the relative scale of costs and not the stable costs on the trade.
ECN Model Account
Spread = 20 | Slippage = 5 |Trading fee = 8
Total cost = Slippage + Spread + Trading Fee = 5 + 20 + 8 = 33

STP Model Account
Spread = 25 | Slippage = 5 | Trading fee = 0
Total cost = Slippage + Spread + Trading Fee = 5 + 25 + 0 = 30

The Ideal way to trade the NZD/NOK
NZD/NOK is an exotic currency pair, and hence we can see, the average pip movement in 1hr timeframe is 120, which indicates higher volatility. The greater the volatility, the higher is the risk, and smaller is the cost of the trade and the other way around. Taking an instance, we can see from the trading range that when the pip movement is smaller, the charge is elevated, and when the pip movement is higher, the charge is lower.
To further decrease our costs of trade, we may place trades using limit orders as an alternative to the market orders. In the below table, we will see the interpretation of the cost percentages when limit orders are applied. As we can see, the slippage is zero. In doing so, the slippage will be excluded from the calculation from the total costs. And this will help us in lowering the trading cost by a sizeable margin. An example of the same is given below.
STP Model Account (Using Limit Orders)
Spread = 25 | Slippage = 0 | Trading fee = 0
Total cost = Slippage + Spread + Trading Fee = 0 + 25 + 0 = 25