Introduction
CADNOK is a Forex currency pair, where CAD is the official currency of Canada, and NOK is the native currency of Norway. In this exotic pair, CAD is the base currency, and NOK is the quote currency.
Understanding CADNOK
This pair’s price determines the value of NOK, which is equivalent to one CAD. We can quote it as 1 CAD per X numbers of NOK. For example, if the CADNOK pair’s value is at 6.7135, it means we need almost 6.7135 NOK to buy one CAD.
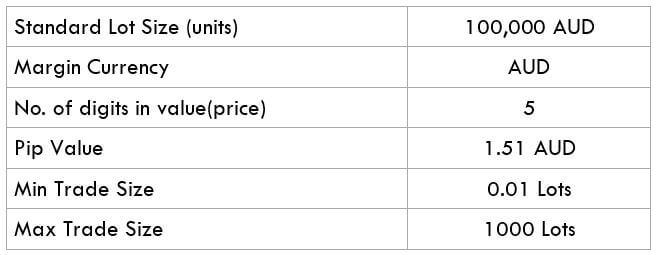
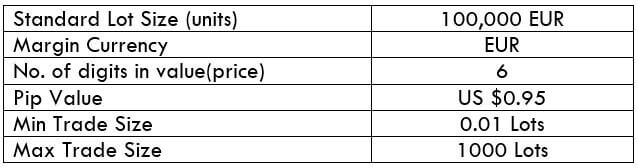
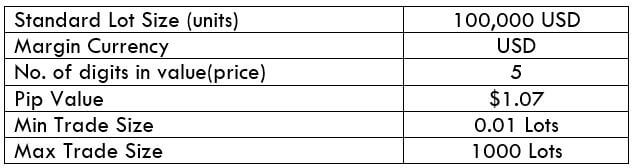
CADNOK Specification

Spread
In forex trading, Spread indicates the difference between the Bid price and the Ask prices. Traders don’t have to do anything with this as it is deducted by the broker. This value changes with the type of execution model used for executing the trades. Below are the ECN and STP spread values of this currency pair.
Spread on ECN: 39 pips | Spread on STP: 44 pips
Fees
The trading fees that forex brokers take are similar to other financial markets. It is deducted from the traders’ accounts when they take a trade. Note that STP accounts do not take any charge, but a few pips are charged in ECN accounts.
Slippage
Slippage happens when a trader opens a trade at a price, but it opens at another price by expanding the Spread. The main reason to occur slippage is the market volatility and the broker’s execution speed.
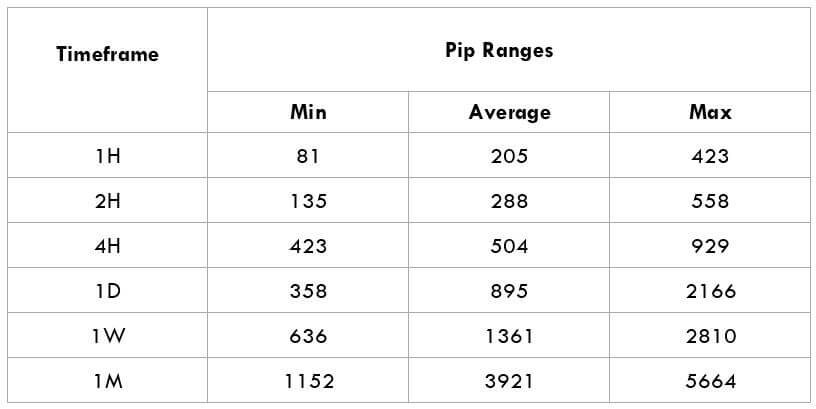
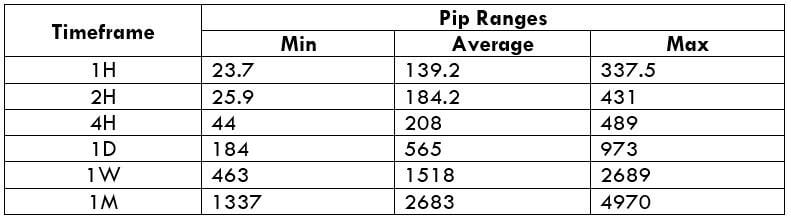
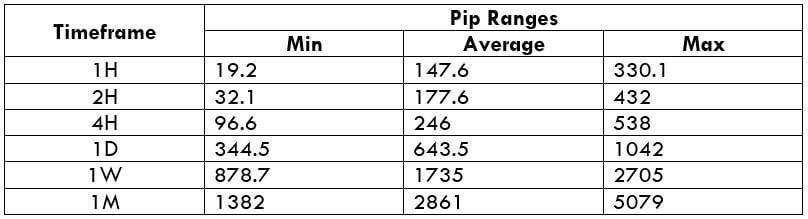
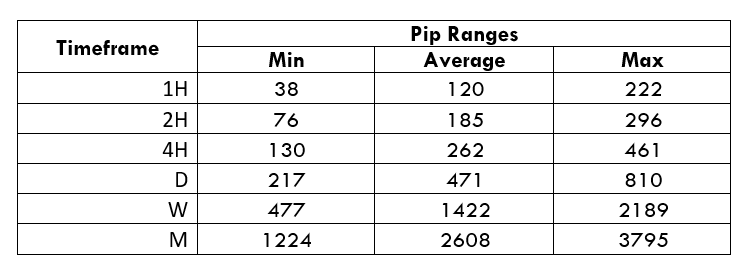
Trading Range in CADNOK
The trading range is the representation of the minimum, average, and the maximum volatility of this pair on the 1H, 4H, 1D, 1W, and 1M timeframe. Using these values, we can assess our profit/loss margin of trade. Hence, this proves to be a helpful risk management tool for all types of traders.
Procedure to assess Pip Ranges
- Add the ATR indicator to your chart
- Set the period to 1
- Add a 200-period SMA to this indicator
- Shrink the chart so you can assess a large time period
- Select your desired timeframe
- Measure the floor level and set this value as the min
- Measure the level of the 200-period SMA and set this as the average
- Measure the peak levels and set this as Max.
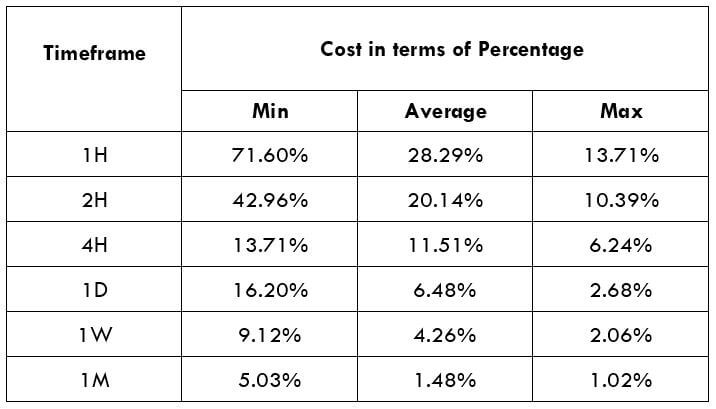
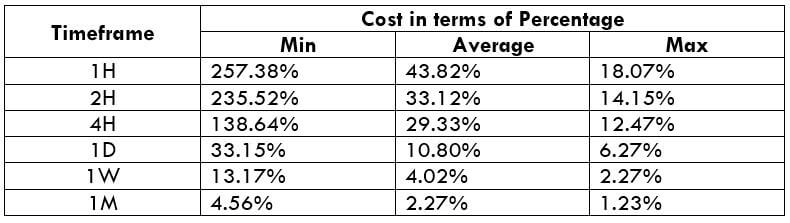
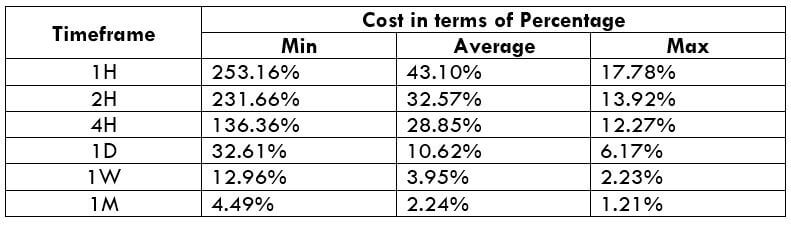
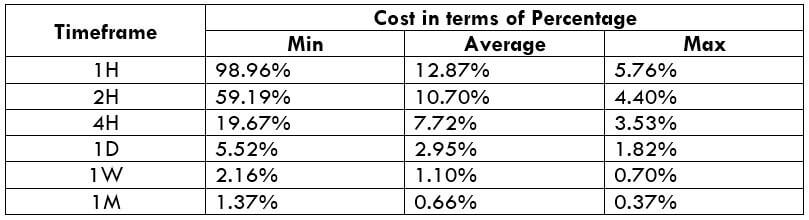
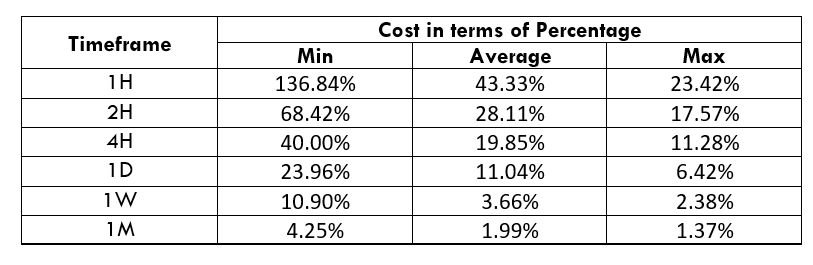
CADNOK Cost as a Percent of the Trading Range
If we look at the volatility values from the above table, we can see how the cost changes with the change in volatility. We have provided the ratio between the cost and the volatility values into percentages.
ECN Model Account
Spread = 39 | Slippage = 5 | Trading fee = 8
Total cost = Spread + Slippage + Trading Fee
= 39 + 5 + 8
Total cost = 52
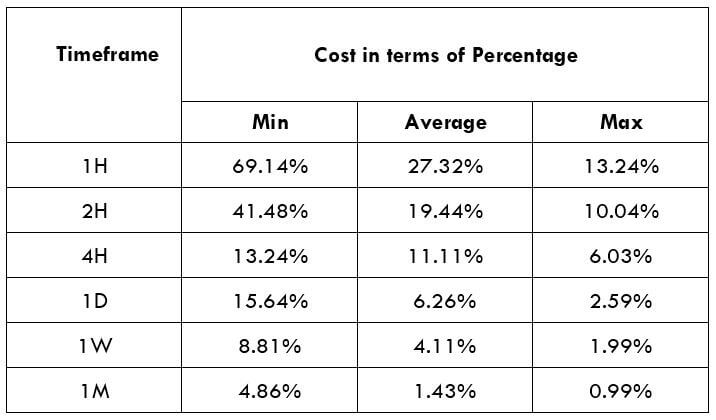
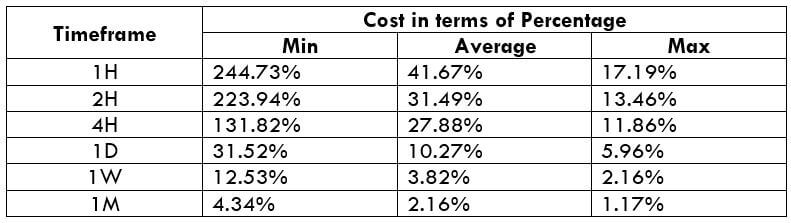
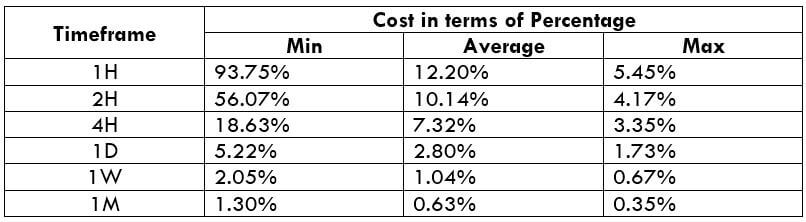
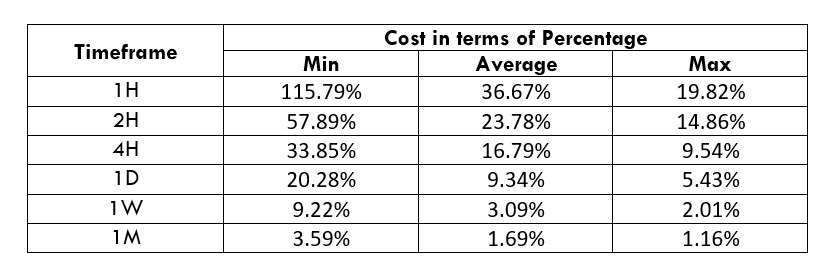
STP Model Account
Spread = 39 | Slippage = 5 | Trading fee = 0
Total cost = Spread + Slippage + Trading Fee
= 39 + 5 + 0
Total cost = 44
The Ideal way to trade the CADNOK
The CADNOK is an exotic currency pair that has enough liquidity. As a result, traders may find it easy to trade in this exotic currency pair. The percentage values from the above table did not move above 138%, which is an indication of less volatility. However, the Percentage of trading cost is lower in the higher timeframe.
Therefore, traders should be cautious to determine the price where trading is suitable. An increase in volatility is risky, while the decrease in volatility is less profitable. Therefore, the best time to trade in this pair is when the volatility remains at the average value.
Furthermore, another way to reduce the cost is to place a pending order as ‘limit’ and ‘stop’ instead of ‘market.’ In that case, the slippage will not be considered in the calculation of the total costs. So, the total cost will be reduced by five pips.
STP Account Using Limit Model Account
Spread = 39 | Slippage = 0 | Trading fee = 0
Total cost = Spread + Slippage + Trading Fee
= 39 + 0 + 0
Total cost = 39