Categories
Forex Assets

Asset Analytics – Analyzing The GBP/DKK Currency Pair

Introduction

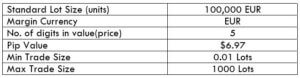
GBP Pound sterling, also known as the pound, is the official currency of the United Kingdom and many others. The sterling is the fourth most-traded currency in the forex market. Where in DKK is known as The krone and sometimes Danish crown. It is the official currency of Denmark, Greenland, and the Faroe Islands.

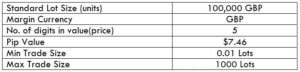
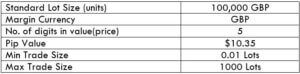
GBP/DKK is the abbreviation for the Pound sterling against the Danish crown. In the Forex, one currency is quoted against the other. Here, the first currency(GBP) is the base currency, and the second(DKK) is the quote currency. The GBPDKK is classified as exotic-cross currency pair.

Understanding GBP/DKK

In Forex, to find out the relative value of one currency, we need another currency to compare. The market value of GBPDKK determines the strength of DKK against the GBP that can be easily understood as 1GBP is equal to how much DKK, so if the exchange rate for the pair GBPDKK is 8.3430. It means that we need 8.3430DKK to buy 1 GBP.

If the value of the base currency goes down, the value of the quote currency goes up and vice versa.
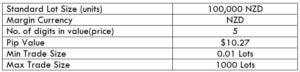
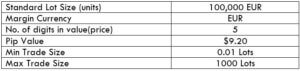
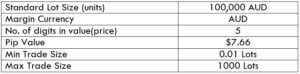
Spread

Forex brokers have two different prices for currency pairs: the bid and ask price. The bid price is the selling price, and ask is the buy price.

The difference between the ask and the bid price is called the spread. The spread is how brokers make their money.

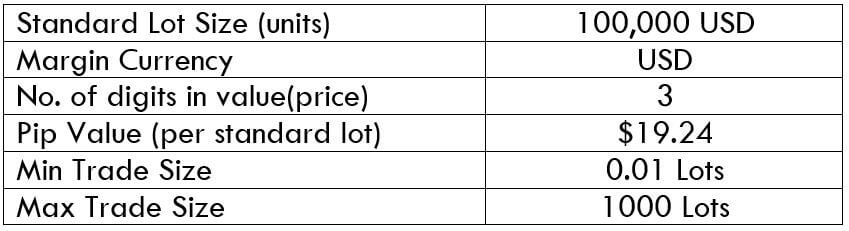
ECN: 39 pips | STP: 42 pips

Fees

A Fee is simply the commission we pay to the broker on each position we open. There is no fee on STP account models, but a few pips on ECN accounts.

Slippage

slippage refers to the difference between the trader’s expected price and the actual price at which the trade is executed. It can occur at any time but mostly happens when the market is fast-moving and volatile. Also, sometimes when we place a large number of orders at the same time.

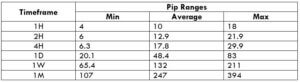
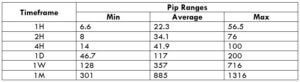
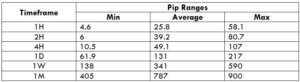
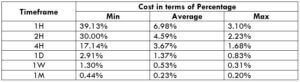
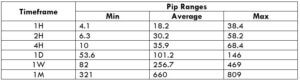
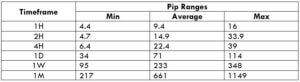
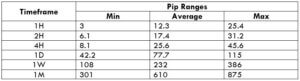
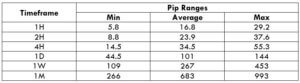
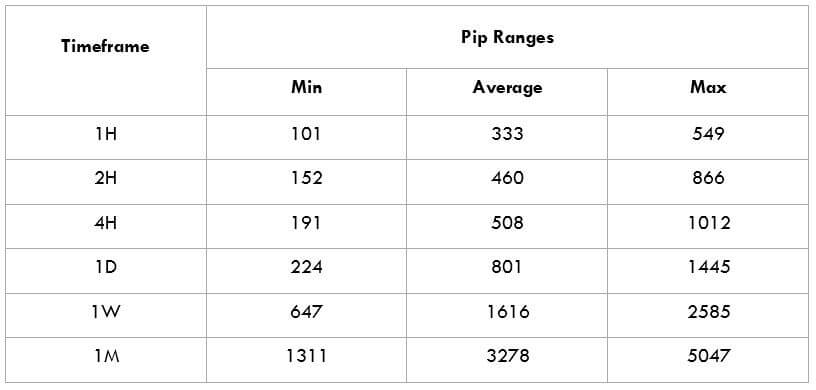
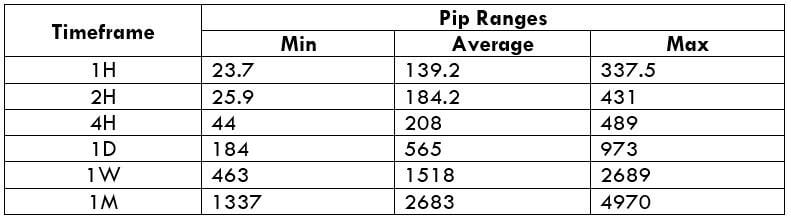
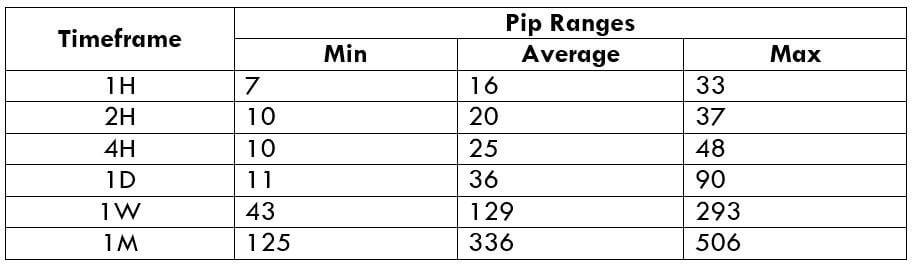
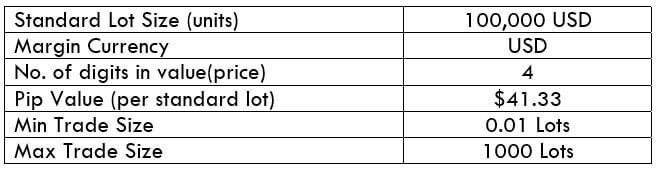
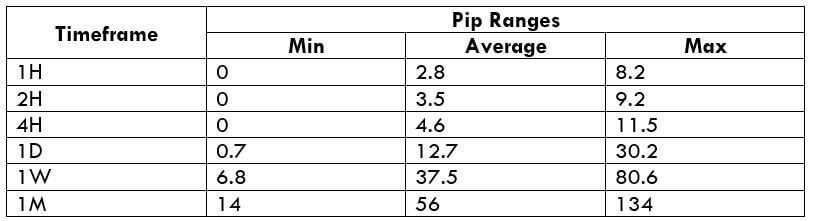
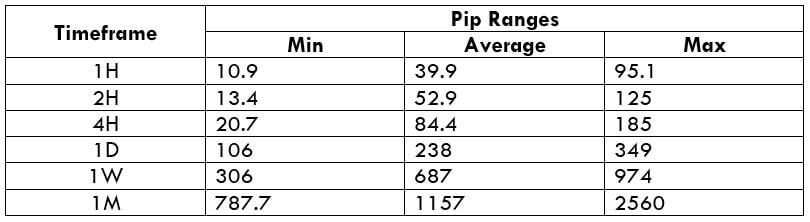
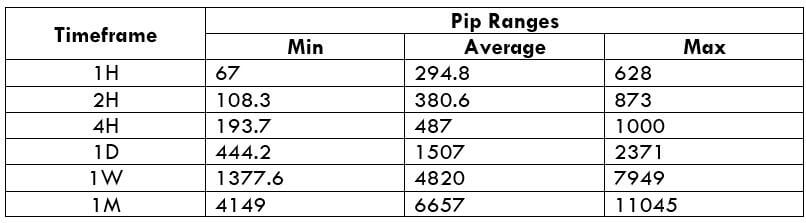
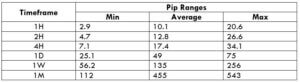
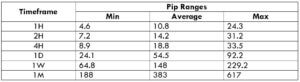
Trading Range in GBP/HKD

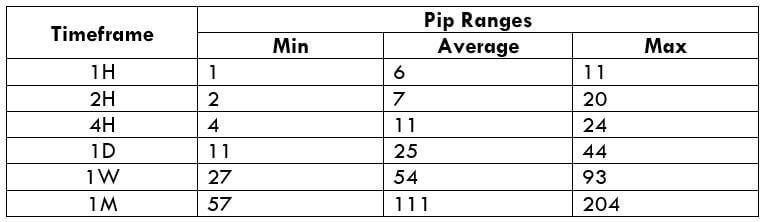
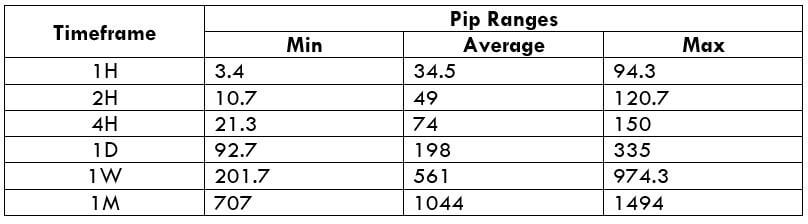
The amount of money you will win or lose in a given amount of time can be assessed using the trading range table. This is a representation of the minimum, average, and maximum pip movement in a currency pair. This can be evaluated simply by using the ART indicator combined with 200-period SMA.

Procedure to assess Pip Ranges

  1. Add the ATR indicator to your chart
  2. Set the period to 1
  3. Add a 200-period SMA to this indicator
  4. Shrink the chart so you can assess a significant period
  5. Select your desired timeframe
  6. Measure the floor level and set this value as the min
  7. Measure the level of the 200-period SMA and set this as the average
  8. Measure the peak levels and set this as Max.

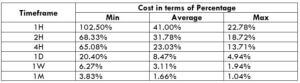
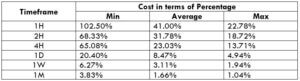
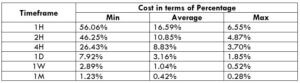
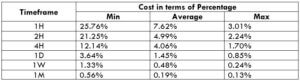
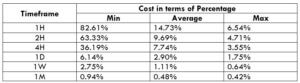
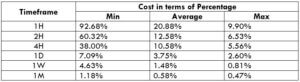
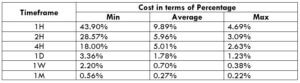
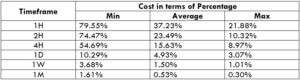
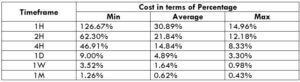
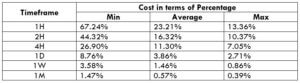
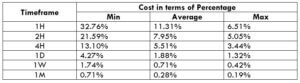
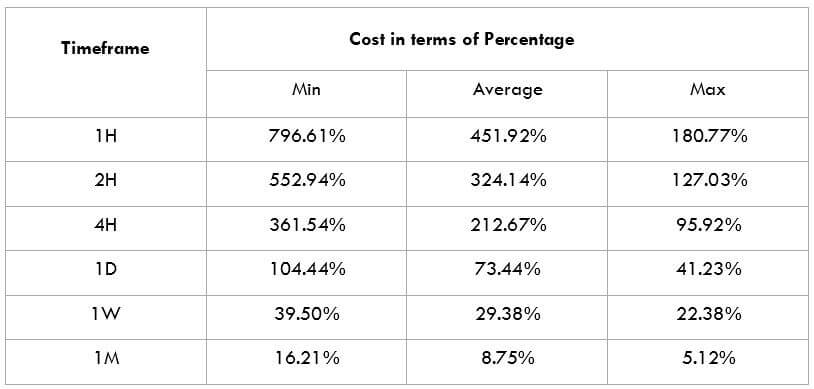
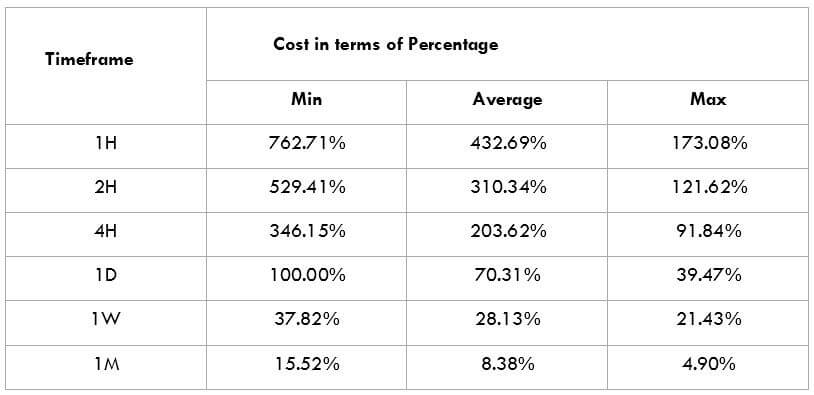
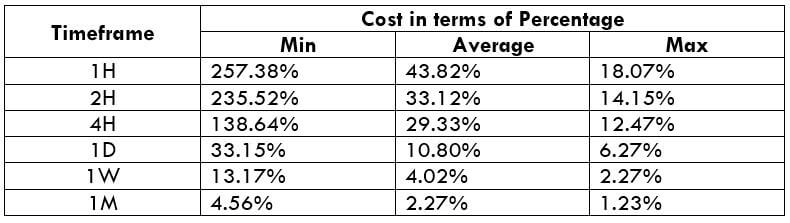
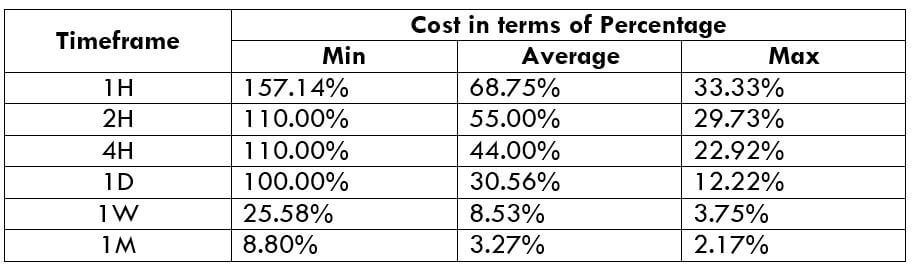
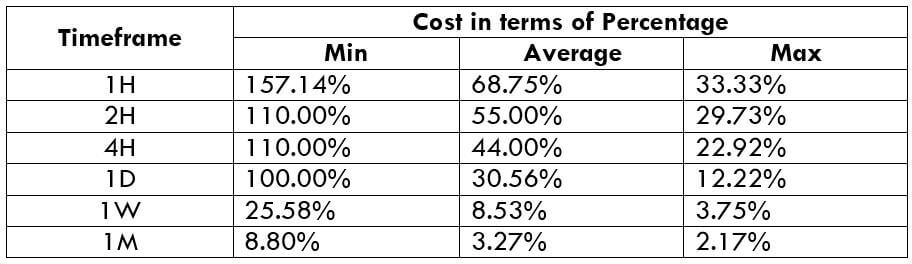
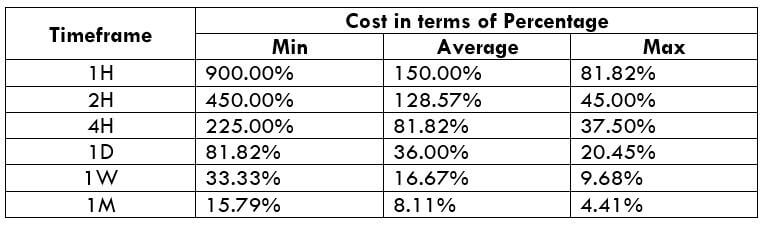
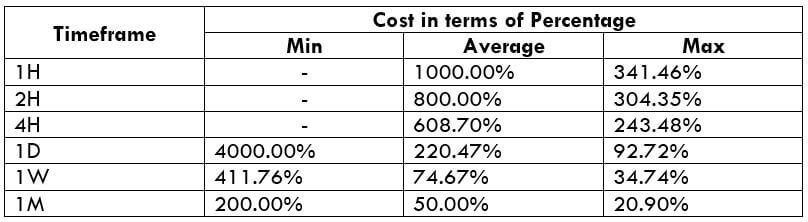
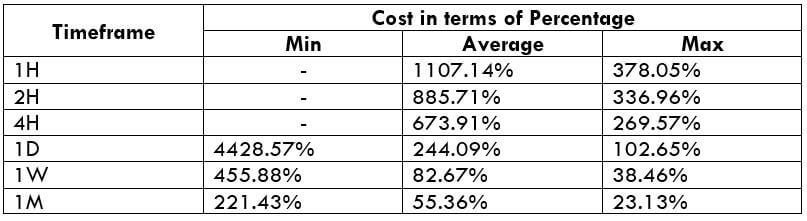
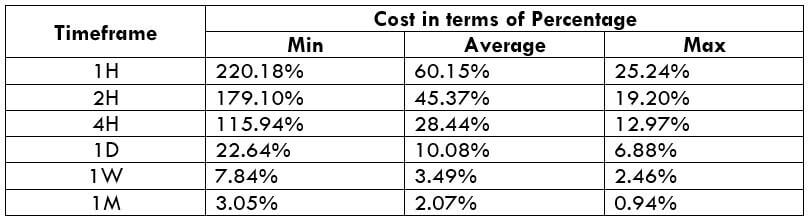
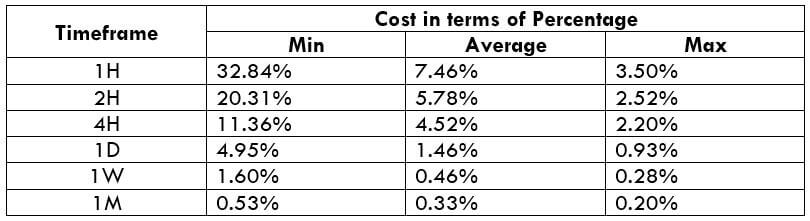
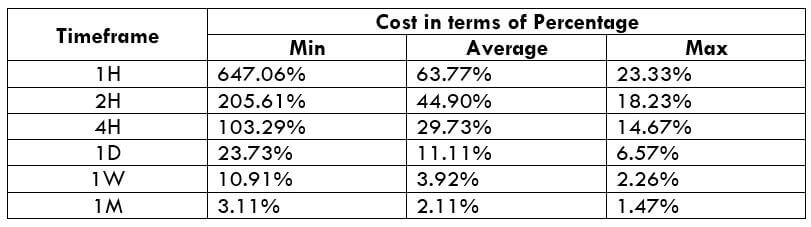
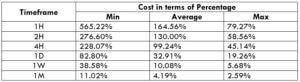
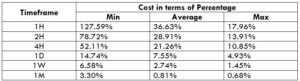
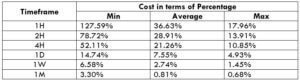
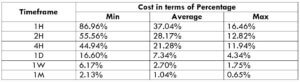
GBP/DKK Cost as a Percent of the Trading Range

The cost of trade mostly depends on the broker and varies based on the volatility of the market. This is because the total cost involves slippage and spreads apart from the trading fee. Below is the representation of the cost variation in terms of percentages. The comprehension of it is discussed in the following sections.
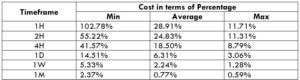
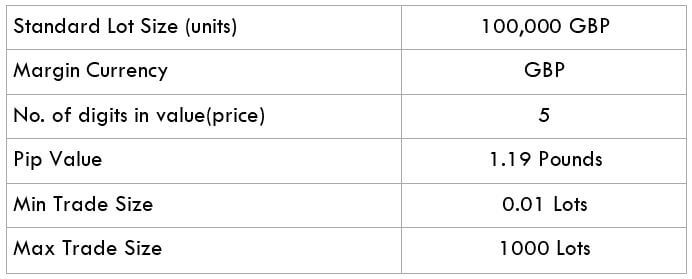
ECN Model Account

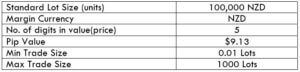
Spread = 39 | Slippage = 3 |Trading fee = 5

Total cost = Slippage + Spread + Trading Fee = 3 + 39 + 5 = 47
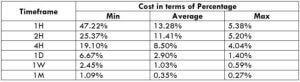
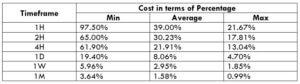
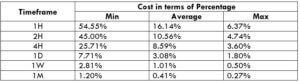
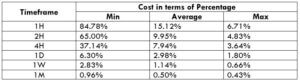
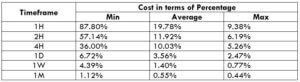
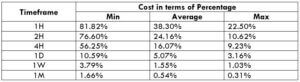
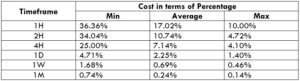
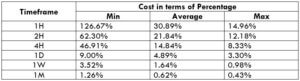
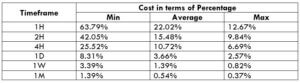
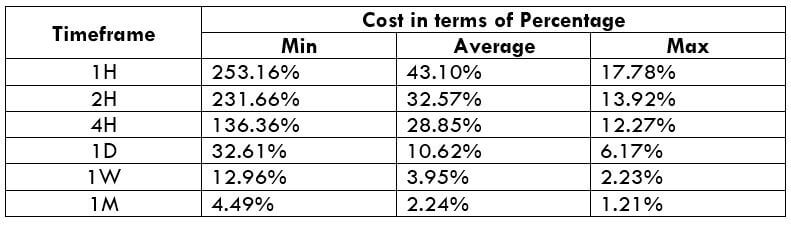
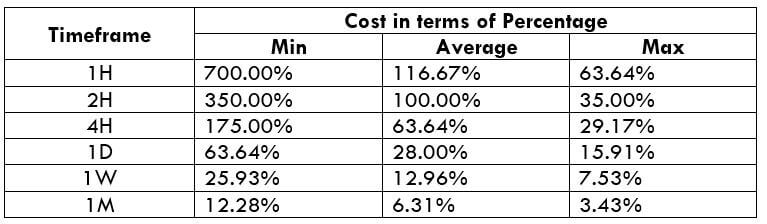
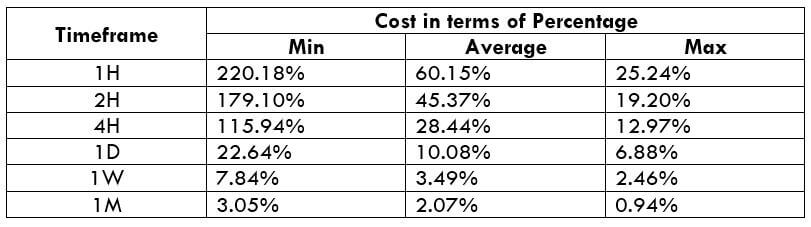
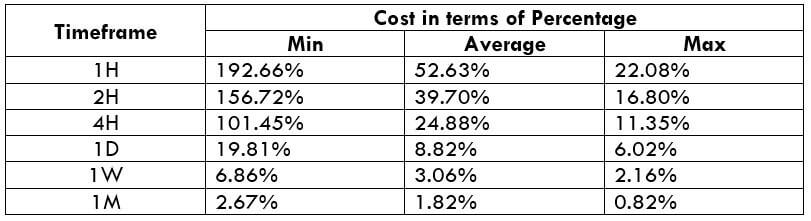
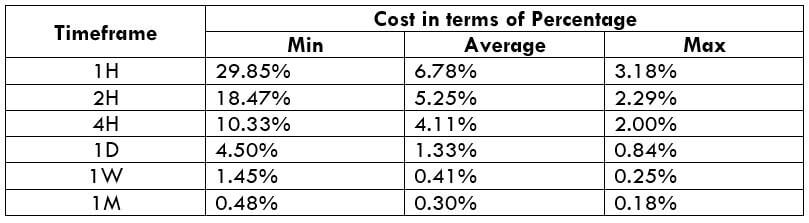
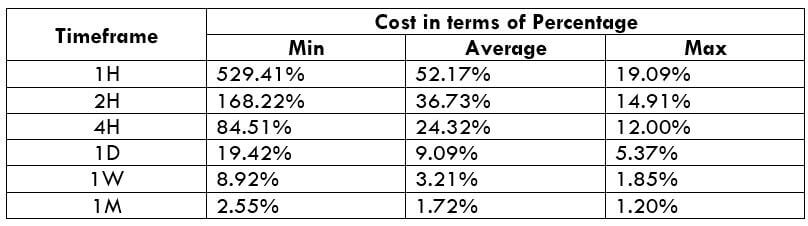
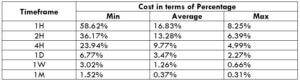
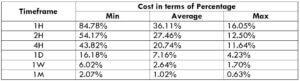
STP Model Account

Spread = 42 | Slippage = 3 | Trading fee = 0

Total cost = Slippage + Spread + Trading Fee = 3 + 42 + 0 = 45

Trading the GBP/DKK

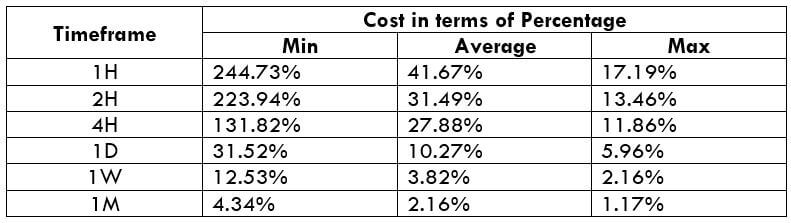
The GBP/DKK is an exotic-cross currency pair and is a volatile market. For instance, the average pip movement on the 1H timeframe is only 333 pips. DKK is considered to be an emerging pair.

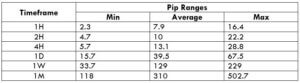
Note that the higher the volatility, the lower is the cost of the trade. However, this is not an advantage as it is risky to trade highly volatile markets. Also, the larger/smaller the percentages, the higher/lower are the costs on the trade. So, we can infer that the prices are higher for low volatile markets and high for highly volatile markets.

It is recommended to trade when the volatility is around the minimum values. The volatility here is low, and the costs are a little high compared to the average and the maximum values. But, if you’re priority is towards reducing costs, you may trade when the volatility of the market is around the maximum values.

Categories
Forex Assets

EUR/NOK – Everything You Should Know Before Trading This Currency Pair

Introduction

EUR/NOK is the abbreviation for the Euro Area’s euro against the Norwegian Krone. This pair is classified as an exotic-cross currency. Here, EUR is the base currency, and NOK is the quote currency.

In this asset article, we shall understand what the value of this pair means, the volatility in different timeframes, the cost variations, and finally, the ideal way to trade this pair.

Understanding EUR/NOK

The value of this pair represents the value of NOK equivalent to one EUR. It is quoted as 1 EUR per X NOK. For example, if the value of this pair is 10.4373, approx. 10 Krones are required to purchase one euro.

EUR/NOK Specification

Spread

The difference between bid and ask prices set by the brokers is referred to as the spread on the trade.

There are two types of trade execution models in forex, namely, ECN and STP. The spread on both vary.

  • Spread on ECN: 55 pips
  • Spread on STP: 57 pips

Fees

For every position you take on your account, you are required to pay some fee for it. This fee is typically between 5-10 pips. Moreover, there is no fee as such in STP accounts.

Slippage

When orders are executed by the market, the trader will not receive the exact price at which he triggered the button. The difference between the actual received price and the triggered price is called the slippage.

Trading Range in EUR/NOK

A Trading range is a tabular representation of the pip movement in a currency pair for different timeframes. Below is the same table for the EURNOK currency pair. From these values, we can assess our profit/loss on a trade beforehand. All you must do is, find the product of the volatility value and the pip value ($0.95).

Procedure to assess Pip Ranges

  1. Add the ATR indicator to your chart
  2. Set the period to 1
  3. Add a 200-period SMA to this indicator
  4. Shrink the chart so you can assess a large time period
  5. Select your desired timeframe
  6. Measure the floor level and set this value as the min
  7. Measure the level of the 200-period SMA and set this as the average
  8. Measure the peak levels and set this as Max.

EUR/NOK Cost as a Percent of the Trading Range

This is an application to the above trading range table. By clubbing these values with the total cost of a trade, we can determine the cost variations for changing volatilities.

ECN Model Account 

Spread = 55 | Slippage = 3 | Trading fee = 3

Total cost = Spread + Slippage + Trading Fee = 55 + 3 + 3 = 61

STP Model Account

Spread = 57 | Slippage = 3 | Trading fee = 0

Total cost = Spread + Slippage + Trading Fee = 57 + 3 + 0 = 60

The Ideal way to trade the EUR/NOK

Trading the EURSEK is similar to trading any other exotic-cross pair. This pair has pretty high volatility with liquidity lesser than major/minor pairs. This is the reason for its spreads to be at 55 pips. Yet, this pair can still be traded.

From the above cost percentage table, we can infer that the magnitudes are large in the min column and small in the max column. This means that the costs are more for low volatilities are less for high volatilities. It is neither preferable to trade during high volatilities nor when the costs are less, for obvious reasons. So, to maintain equilibrium between costs and volatility, it is ideal for entering this pair when the volatility is more or less near the average values in the trading range table.

Another simple way to bring down your costs is by placing orders by ‘limit’ and ‘stop.’ When trades are not executed as market orders, the slippage is cut off. Hence, the total cost is reduced by a decent percentage. An example of the same is given below.

Spread = 55 | Slippage = 0 | Trading fee = 3

Total cost = Spread + Slippage + Trading Fee = 55 + 0 + 3 = 58

Categories
Forex Assets

Analyzing The USD/BND Forex Currency Pair

Introduction

USD/BND is the abbreviation for the US Dollar against the Brunei Dollar. Brunei is located on the Asian continent, and this pair is classified as an emerging currency pair. In the USD/BND, USD is the base currency, and BND is the quote currency.

Understanding USD/BND

The market price of this currency pair specifies the value of BND equivalent to one USD. It is quoted as 1 USD per X BND. For example, if the value of this pair is 1.3711, then these many units of the quote currency (BND) are required to purchase one unit of the base currency (USD).

Spread

The difference between the bid and the ask price is called the spread. The spread varies from broker to broker and also by execution model used.

ECN: 5 pips | STP: 8 pips

Fees

A fee is a synonym for commission. This is similar to the one that is paid to the stockbrokers. Below is the fee on ECN and STP brokers.

Fee on ECN – 0 pips | Fee on STP – 5-10 pips

Slippage

The difference between the price requested by you and the price you actually received from the broker is called slippage. There are two reasons for slippage to place:

  • Market volatility
  • Broker’s execution speed

Trading Range in USD/BND

A trading range is a tabular representation of the minimum, average, and the maximum volatility of this currency pair. And these values help in determining the profit/loss of a trade in a given timeframe. Hence, this is a great risk management tool for traders.

Procedure to assess Pip Ranges

  1. Add the ATR indicator to your chart
  2. Set the period to 1
  3. Add a 200-period SMA to this indicator
  4. Shrink the chart so you can assess a large time period
  5. Select your desired timeframe
  6. Measure the floor level and set this value as the min
  7. Measure the level of the 200-period SMA and set this as the average
  8. Measure the peak levels and set this as Max.

USD/BND Cost as a Percent of the Trading Range

The cost as a percent of the trading range is the representation of the cost variation in a trade for different volatilities are timeframes. This variation is represented as a percentage. The magnitude of these percentages depicts the highness and lowness of a trade.

ECN Model Account

Spread = 5 | Slippage = 3 |Trading fee = 3

Total cost = Slippage + Spread + Trading Fee = 3 + 5 + 3 = 11

STP Model Account

Spread = 8 | Slippage = 3 | Trading fee = 0

Total cost = Slippage + Spread + Trading Fee = 3 + 8 + 0 = 11

The Ideal way to trade the USD/BND

Trading the USD/BND is simple. This pair is not so volatile, like the other emerging pairs. Moreover, the spreads are low too.

From the above tables, we can see that the percentage values are pretty high in the minimum column, and comparatively lower in the max column. This means that the costs are high for low volatile markets and low for high volatile markets. So, traders who need high volatility may enjoy low costs. And trades who want to minimize their risk and trade low volatile markets will have to bear higher costs. Finally, traders who need a balance between the two may trade when the volatility of the market is around the average values. This will ensure the equilibrium between volatility and costs.

Moreover, there is a way through which you can cut off the slippage on your trade. Placing orders as limit orders instead of market orders will take away the slippage and bring down the total cost on the trade. So, in our example, the total cost would reduce by three pips.

We hope this article will change the way you trade this currency pair. Happy trading!

Categories
Forex Assets

Trading Costs Involved While Trading The USD/PHP Forex Pair

Introduction

USD/PHP is the abbreviation for the US dollar versus the Philippine Peso. Since Philippine is involved in the pair, this classified under the Asian emerging pairs. In this pair, the USD is the base currency and the PHP is the quote currency.

Understanding USD/PHP

The current market price determines the price of PHP that is equivalent to one US dollar. It is simply quoted as 1 USD per X PHP. For example, if the price of this pair was 50.96, then around 51 pesos would be required to buy one US dollar.

Spread

The difference between the bid price and the ask price is referred to as the spread. This value a variable that varies from broker to broker as well as the type of execution model used by the brokers.

ECN: 3 pips | STP: 4 pips

Fees

The fee is a synonym for commission. It is levied on the ECN accounts only and not STP accounts.

Slippage

Slippage is some sort of a fee that is paid only on market orders. Slippage is the pip difference between the trader’s requested price and the price that was given by the broker. There is variation primarily due to two reasons – Market’s volatility & Broker’s execution speed

Trading Range in USD/PHP

Wanting to know how much could be your minimum average and maximum profit/loss of a trade in a given timeframe? Below is a table that will help you with it. With the pip movement values in the table, one can determine their risk on the trade. All you have to do is, multiply the volatility value with the pip value ($19.24). This will yield the value for one standard lot size.

 Procedure to assess Pip Ranges

  1. Add the ATR indicator to your chart
  2. Set the period to 1
  3. Add a 200-period SMA to this indicator
  4. Shrink the chart so you can assess a large time period
  5. Select your desired timeframe
  6. Measure the floor level and set this value as the min
  7. Measure the level of the 200-period SMA and set this as the average
  8. Measure the peak levels and set this as Max.

USD/PHP Cost as a Percent of the Trading Range

Apart from the profit/loss in a trade, we can even determine the cost variation in altering volatilities. To do so, we have taken the ratio between the volatility value and the total cost and represented it as a percentage.

ECN Model Account

Spread =3 | Slippage = 3 |Trading fee = 3

Total cost = Slippage + Spread + Trading Fee = 3 + 3+ 3 = 9

STP Model Account

Spread = 4 | Slippage = 3 | Trading fee = 0

Total cost = Slippage + Spread + Trading Fee = 3 + 4 + 0 = 7

The Ideal way to trade the USD/PHP

Firstly, from the trading range table, we can infer that the volatility of this pair is feeble. But, note that, the small pip movement values do not mean you’ll have to trade large quantities to make a good profit. Since the pip value (per standard lot) is $19.24, even a 0.1 pip will generate $1.924.

Coming to the cost table, the percentages here are too high, especially in the min column. So it is recommended to not trade during low volatilities as It will have high costs. So, to reduce costs, it is ideal to trade when the volatility of the market is on the higher side. As far as the risk involved in highly volatile markets is concerned, you may cut down your lot sizes.

To simplify it even further, you can bring down your costs by executing your trades as limit/stop orders instead of market orders. This eliminates the slippage involved in the calculation of total costs on the trade.

Categories
Forex Assets

Assessing The USD/UAH Exotic Forex Currency Pair

USD/UAH is the abbreviation for the currency pair US dollar against the Ukrainian Hryvnia. It is classified as an emerging currency pair. The volatility, liquidity, and volume in this pair, is significantly low. In this pair, the US dollar is the base currency, and UAH is the quote currency.

Understanding USD/UAH

The value of the pair as a whole represents the value of UAH that is equivalent to one US dollar. It is quoted as 1 USD per X UAH. For instance, if the value of USDUAH is 24.19, then about 24 Hryvnias are required to purchase one US dollar.

Spread

The difference between the bid price and the ask price is referred to as the spread. Spread usually varies from broker to broker, and also on the execution model used by the brokers.

ECN: 20 pips | STP: 23 pips

Fees

As the name pretty much suggests, the fee is the charge paid to the broker on each trade. Below is the fee on ECN and STP accounts.

ECN – 5-10 pips | STP – 0 pips

Slippage

Due to the changes in the volatility and the broker’s execution speed on the trade, a trader does not get the exact price he needed. And the difference between the two prices is called slippage.

Trading Range in USD/UAH

Risk management is a vital factor in trading. The trading range is a tabular representation of the pip movement in a currency pair in different timeframes. And these values help in determining the gain or loss on a trade.

Note: The product of the pip movement value and the pip value (per standard lot) yields the profit/loss in a trade for a particular timeframe.

Procedure to assess Pip Ranges

  1. Add the ATR indicator to your chart
  2. Set the period to 1
  3. Add a 200-period SMA to this indicator
  4. Shrink the chart so you can determine a large time period
  5. Select your desired timeframe
  6. Measure the floor level and set this value as the min
  7. Measure the level of the 200-period SMA and set this as the average
  8. Measure the peak levels and set this as Max.

USD/UAH Cost as a Percent of the Trading Range

The total cost of a trade is determined by the sum of the spread, slippage, and the trading fee. And this varies from time to time, based on the volatility of the market. Below are the tables that represent the costs for different volatilities and timeframes.

ECN Model Account

Spread = 20 | Slippage = 3 |Trading fee = 5

Total cost = Spread + Slippage + Trading Fee = 20 + 3 + 5 = 28

STP Model Account

Spread = 23 | Slippage = 3 |Trading fee = 5

Total cost = Spread + Slippage + Trading Fee = 23 + 3 + 5 = 31

The Ideal way to trade the USD/UAH

Firstly, the percentage values depict the cost variation on the trade. The magnitude of the percentage is directly proportional to the cost of the trade.

We can see that the minimum pip movement in 1H, 2H, and 4H timeframe is 0 pips. So, it is pointless to trade in the lower timeframes. However, one may trade this pair on the higher timeframes, like the 1D, 1W, and 1M. To reduce costs even further and to have decent volatility, one may preferably trade when the volatility of the market is above the average values.

Furthermore, limit orders is another way through which a trader can bring down their costs considerably. This is because limit orders, unlike the market orders, do not have any slippage on it. For instance, the total cost on an ECN account for limit orders would be,

Total cost = Spread + Slippage + Trading Fee = 20 + 0 + 5 = 25

Corollary

We can see that on average volatilities, it almost takes a week range to cover the costs if the trade goes in the direction of the trade.  That means this pair is unsuitable to trade short-term. The use of limit orders to catch the price entry at the absolute minimum of the week, combined with ultra-reliable timing, is the only way to succeed. There are lots of better pairs to choose from.

Categories
Forex Assets

Understanding The USD/PLN Exotic Currency Pair

Introduction

USD/PLN is the abbreviation for the US dollar against the Polish Zloty. It is an emerging currency pair in the forex market. The volatility in this pair is high, and the trading volume is less compared to major and cross currencies. In this pair, USD is the base currency, and PLN is the quote currency.

Understanding USD/PLN

The value of this pair determines the value of PLN that is equal to one US dollar. It is quoted as 1 USD per X PLN. For example, if the value of this pair is 3.8146, then around 4 PLN is required to buy one USD.

Spread

In forex, one of the most used terms is the spread. Spread is the difference between the bid price and the ask price of the market. This value is decided by the broker and varies from the type of account model.

ECN: 18 pips | STP: 21 pips

Fees

There is some fee on every trade you execute. And this, too, varies from type of account model. For instance, there is no fee on the STP account and a few pips on ECN accounts.

Slippage

Slippage occurs only on market orders. By definition, it is the difference between the trader’s required price for execution and the actual price the order was executed. This value depends on the broker’s execution speed and the market’s volatility.

Trading Range in USD/PLN

Assessing the profit that you can make and the loss that you can incur is a vital risk management tool. And below is a table that represents the minimum, average, and maximum volatility in different timeframes, which will help determine profit/loss values.

Procedure to assess Pip Ranges

  1. Add the ATR indicator to your chart
  2. Set the period to 1
  3. Add a 200-period SMA to this indicator
  4. Shrink the chart so you can determine a large period
  5. Select your desired timeframe
  6. Measure the floor level and set this value as the min
  7. Measure the level of the 200-period SMA and set this as the average
  8. Measure the peak levels and set this as Max.

USD/PLN Cost as a Percent of the Trading Range

An excellent application to the above table is the cost as a Percent of the Trading Range. The below tables illustrate how the cost varies based on the volatility of the market. And these values will help us an idea on the best times of the day to enter into this currency pair.

ECN Model Account

Spread = 18 | Slippage = 3 |Trading fee = 3

Total cost = Slippage + Spread + Trading Fee = 3 + 18 + 3 = 24

STP Model Account

Spread = 21 | Slippage = 3 | Trading fee = 0

Total cost = Slippage + Spread + Trading Fee = 3 + 21 + 0 = 24

The Ideal way to trade the USD/PLN

Before getting right into it, let us comprehend what the tables actually mean. The higher the value of the percentage, the higher is the cost of the trade and vice versa. From the table, we can clearly ascertain that the percentages are high in the first (min) column, indicating that the costs are high when the market volatility is low.

Now, talking the ideal time to trade this currency pair, you may trade this pair during those times when the volatility is above the average values. In doing so, you will be assured with sufficient volatility and low costs as well.

Furthermore, if you wish to reduce your costs much more, you may place orders using the limit/stop instead of the market. This will completely nullify the slippage on the trade and will, in turn, bring down the total costs significantly. As an example, the above table, when the slippage is made, is nil is illustrated below.

Categories
Forex Assets

Everything About The USD/MXN Forex Currency Pair

Introduction

USDMXN is the abbreviation for the US Dollar against the Mexican Peso. It is classified as an exotic currency pair that usually has high volatility and low trading volume. Here, the US Dollar (on the left) is the base currency, and the MXN (on the right) is the quote currency.

Understanding USD/MXN

The market price of USDMXN represents the value of MXN that are required to purchase to one US Dollar. It is quoted as 1 USD per X MXN. So, if the market price of this pair is 18.7615, then this amount of MXN is required to buy one USD.

Spread

The difference between the bid and the ask price is referred to as the spread. Its value varies from the type of execution model of the broker.

ECN: 16 pips | STP: 17 pips

Fees

For every position a client takes from the broker, he must pay some fee on each. Note that there is no fee on STP accounts. However, there are few pips of fees on ECN accounts.

Slippage

The difference between the price requested by the client and the price that was given by the broker is referred to as the slippage. Its value depends on the volatility of the market and the broker’s execution.

Trading Range in USD/MXN

Assessing the amount of money you will win and lose beforehand, in a particular timeframe is critical in trading. Below is a volatility table through which one can determine the minimum, average, and maximum profit/loss they can encounter in a specified timeframe.

Procedure to assess Pip Ranges

  1. Add the ATR indicator to your chart
  2. Set the period to 1
  3. Add a 200-period SMA to this indicator
  4. Shrink the chart so you can assess a large time period
  5. Select your desired timeframe
  6. Measure the floor level and set this value as the min
  7. Measure the level of the 200-period SMA and set this as the average
  8. Measure the peak levels and set this as Max.

USD/MXN Cost as a Percent of the Trading Range

By applying the total cost to the above table, we can even determine the cost variation in a trade. The ratio between the two expressed in percentage will help us determine the ideal times of the day to trade the currency pair.

ECN Model Account

Spread = 16 | Slippage = 3 |Trading fee = 3

Total cost = Slippage + Spread + Trading Fee = 3 + 16 + 3 = 22

STP Model Account

Spread = 17 | Slippage = 3 | Trading fee = 0

Total cost = Slippage + Spread + Trading Fee = 3 + 17 + 0 = 20

The Ideal way to trade the USD/MXN

Comprehending the above tables is simple. The percentage values are directly proportional to the total cost of the trade. It is seen that the percentages are comparatively high on the min column and vice versa. Now, coming to the ideal time to enter the market, it would be when the volatility of USDMXN is somewhere around the average pip movement. Trading in such moments will ensure low costs as well as lower liquidity.

Furthermore, you reduce costs by placing orders using limit/pending orders instead of market orders. This will significantly bring down the total costs as the slippage will be zero at this point in time. I hope this article will help you trade this pair in a much efficient way. Cheers!

Categories
Forex Assets

Analyzing The USD/HUF Forex Exotic Currency Pair

Introduction

The US Dollar versus the Hungarian Forint, in short, is represented as USDHUF. It is an exotic currency pair in the forex market. It has got high volatility and lower volume compared to major and minor currencies. Here, USD is the base currency, and HUF is the quote currency.

Understanding USD/HUF

The value of this pair represents the number of HUF that are required to buy one US Dollar. It is quoted as 1 USD per X HUF. If the current market price of USDHUF is 307.72, these many Hungarian Forints are needed to purchase one unit of USD.

Spread

Spread is the primary way through which brokers generate revenue from their clients. The pip difference between the bid price and the ask price is their revenue, which is referred to as the spread. Spread is different on ECN accounts and STP accounts.

ECN: 16 pips | STP: 15 pips

Fees

On ECN accounts, one has to pay some pips of fee on each position you take. The fee is usually high on exotic pairs and comparatively less on major and minor pairs. However, on STP accounts, the fee is nil.

Slippage

Slippage in trading is the difference between the client’s intended price and the price the broker actually gave him. Slippage is affected by two factors:

  • Broker’s execution speed
  • The volatility of the market

Trading Range in USD/HUF

The representation of the minimum, average, and maximum volatility of a currency pair is the trading range. It shows the volatility of the market in different timeframes. And these values help in figuring the profit that can be gained or loss that can be incurred on a trade.

Procedure to assess Pip Ranges

  1. Add the ATR indicator to your chart
  2. Set the period to 1
  3. Add a 200-period SMA to this indicator
  4. Shrink the chart so you can assess a large time period
  5. Select your desired timeframe
  6. Measure the floor level and set this value as the min
  7. Measure the level of the 200-period SMA and set this as the average
  8. Measure the peak levels and set this as Max.

USD/HUF Cost as a Percent of the Trading Range

Cost as a per cent of the trading range is the representation of the cost discrepancies for different volatilities and timeframes. With these values, we can determine the moments of the day when the costs are less. And this shall be discussed in detail in the next topic.

ECN Model Account

Spread = 16 | Slippage = 3 |Trading fee = 3

Total cost = Slippage + Spread + Trading Fee = 3 + 16 + 3 = 22

STP Model Account

Spread = 15 | Slippage = 3 | Trading fee = 0

Total cost = Slippage + Spread + Trading Fee = 3 + 15 + 0 = 18

The Ideal way to trade the USD/HUF

We know that exotic currency pairs typically have high volatility and low trading volume. Also, the total costs on trade are pretty expensive. Hence, one must be choosy while deciding when to enter the market.

The higher percentage values in the min column represent that the costs are high when the volatility of the market is low. And the opposite is the case for lower percentage values. However, it is not ideal to trade during any of these times.

One may trade these currency pairs during those times of the day when the volatility values are around the average values. This will ensure decent volatility as well as low costs on the trade.

Furthermore, another simple way to reduce costs is by trading using limit orders and not market orders. Because this will take away the slippage on the total cost, and this will, in turn, reduce the total cost significantly. An example of the same is given below.

With slippage

Spread = 16 | Slippage = 3 |Trading fee = 3

Total cost = Slippage + Spread + Trading Fee = 3 + 16 + 3 = 22

Without slippage

Spread = 16 | Slippage = 0 |Trading fee = 3

Total cost = Slippage + Spread + Trading Fee = 0 + 16 + 3 = 19

Categories
Forex Assets

Analyzing The USD/SGD Forex Currency Pair

Introduction

US dollar versus the Singapore dollar, in short, is referred to as USDSGD. USD stands for the US dollar and is the base currency, and SGD stands for the Singapore dollar and is the quote currency. This currency pair comes under the sack of exotic currency pairs. Unlike the major and minor currencies, exotic currencies tend to have high volatility and low volumes.

Understanding USD/SGD

Comprehending the value of USDSGD is simple. The number of SGD equivalent to one USD is the value of the currency pair USDSGD. It is quoted as 1 USD per X SGD. So, if the value of this pair is 1.3641, then 1.3241 units of SGD are to be produced to purchase one USD.

Spread

Spread is a term given to the difference between the bid price and ask price of a currency pair. This value varies from broker to broker and on the type of execution model.

ECN: 7 | STP: 9

Fees

The fee is similar to the commission that is paid on each trade. This value, too, varies based on how the brokers execute a trade. Note that there is no fee on STP accounts. However, there is a fee on ECN accounts. And for exotic pairs, the fee is pretty high.

Slippage

Slippage is the difference between the price that a trader expected to receive and the price he actually got. There is always this difference due to the volatility of the market and the broker’s execution speed.

Trading Range in USD/SGD

Assessing the profit or loss that a trader is liable for is considered to be a vital factor in trading. This can easily be determined using the table below, which represents the pip movements in the currency pair in a given timeframe.

Procedure to assess Pip Ranges

  1. Add the ATR indicator to your chart
  2. Set the period to 1
  3. Add a 200-period SMA to this indicator
  4. Shrink the chart so you can assess a large time period
  5. Select your desired timeframe
  6. Measure the floor level and set this value as the min
  7. Measure the level of the 200-period SMA and set this as the average
  8. Measure the peak levels and set this as Max.

USD/SGD Cost as a Percent of the Trading Range

The total cost on a trade does not remain static even though you’re trading with the same broker. It varies depending on the volatility of the currency pair. To find the variation of these costs, we consider the values in the pip movement table and find the ratio with the total cost, and represent in percentage.

ECN Model Account

Spread = 7 | Slippage = 3 |Trading fee = 3

Total cost = Slippage + Spread + Trading Fee = 7 + 3 + 3 = 13

STP Model Account

Spread = 9 | Slippage = 3 | Trading fee = 0

Total cost = Slippage + Spread + Trading Fee = 9 + 3 + 0 = 12

The Ideal way to trade the USD/SGD

As mentioned, exotic pairs are pretty expensive to trade. However, it can still be traded in some moments when the costs are low.

It can be ascertained from the above table that the percentages are maximum in the min column and minimum on the max column. This means that the costs are high when the market’s volatility is low and vice versa.

Now, to ensure moderate volatility with affordable costs, it is ideal to trade when the volatility of the market is somewhere around the average values of the volatility table.

Slippage is a variable in the total cost that can be erased by trading using limit orders instead of market orders. In doing so, the costs will be reduced by a significant value. For example, if the total cost on the trade was 13 (including slippage=3), then the costs would be reduced to 10 as slippage is not considered.

Categories
Forex Assets

Basics Of Trading The AUD/CHF Currency Pair & Analyzing The Trading Costs Involved

Introduction

AUDCHF is the abbreviation for the Australian dollar and the Swiss franc. It is a cross-currency pair in the market. AUD being on the left is the base currency, and CHF (on the right) is the quote currency. One can expect high volatility and liquidity during the Australian session.

Understanding AUD/CHF

The value of AUDCHF represents the amount of Swiss Francs required to buy one Australian dollar. It is quoted as 1 AUD per X CHF. For example, if the value of AUDCHF is 0.6885, then this number represents the CHF that is to be produced by the trader to buy one AUD.

AUD/CHF Specification

Spread

Spread is the difference between the bid price and the ask price of the market set by the brokers. It is not a fixed value. It differs from the account type as well as the broker.

ECN: 0.7 | STP: 1.7

Fees

Brokers charge a fee on every trade a trader takes. It could be per execution or finished trade (round trip). Also, it varies from the type of account model. Typically, fee on ECN type is 5-10 pips, and 0 on STP type.

Slippage

Slippage is the difference between the price demanded by the trader and the price he actually received from the broker. There is always a variation in this due to the broker’s execution speed and market volatility.

Trading Range in AUD/CHF

Wanting to know how much profit one can make in a given time? If so, then you may find the answer in the table illustrated below. This table is the representation of the min, average, and max volatility of the currency pair in different timeframes. And with these values in the table, one can determine the profit on a trade.

Procedure to assess Pip Ranges

  1. Add the ATR indicator to your chart
  2. Set the period to 1
  3. Add a 200-period SMA to this indicator
  4. Shrink the chart so you can determine a significant period
  5. Select your desired timeframe
  6. Measure the floor level and set this value as the min
  7. Measure the level of the 200-period SMA and set this as the average
  8. Measure the peak levels and set this as Max.

AUD/CHF Cost as a Percent of the Trading Range

The cost as a percent of the trading range is determined in the following table using different volatilities, assuming that the trading range can be seen as the potential profit on a given timeframe. The percentages are obtained by finding the ratio between the total cost of the trade and the range values. These values, thus, help in assessing the right moments in the day to trade the currency pair.

ECN Model Account

Spread = 0.7 | Slippage = 2 |Trading fee = 1

Total cost = Slippage + Spread + Trading Fee = 2 + 0.7 + 1 = 3.7

STP Model Account

Spread = 1.7 | Slippage = 2 | Trading fee = 0

Total cost = Slippage + Spread + Trading Fee = 2 + 1.7 + 0 = 3.7

The Ideal way to trade the AUD/CHF

Firstly, the higher the value of the percentage, the higher is the cost of the trade. It is pretty evident from the above tables that the costs are higher in the min column and keep decreasing in the subsequent columns. Meaning, as the volatility increases, the total cost of the trade reduces. But, it is not ideal to trade in either of the extremes. To have an affordable cost and optimal volatility, it is best to enter during those times of the day when the pip movement for the pair is more or less equal to the average values.

Furthermore, the total cost can easily be reduced by trading using limit order instead of market orders. This methodology would bring down the slippage to zero. Hence, significantly affecting the percentage values. And an example of the same is depicted below.

Categories
Forex Assets

Understanding The AUD/CAD Forex Currency Pair

Introduction

AUDCAD is the abbreviation for the currency pair, the Australian dollar, and the Canadian dollar. It is a cross-currency pair. One can expect great volatility and liquidity in the market during the Australian session. AUD is the base currency, and CAD is the quote currency.

Understanding AUD/CAD

The value of AUDCAD is the number of Canadian dollars required to buy one Australian dollar. It is quoted as 1 AUD per X CAD. For example, if the value of this pair is 0.9013, then 0.9013 CAD is needed to purchase one AUD.

AUD/CAD Specification

Spread

Spread in trading is the difference between the bid price and the ask price set by the broker. This pip difference is how brokers generate revenue. The spread always varies from broker to broker and the type of account model.

ECN: 1 | STP: 1.9

Fees

Apart from spreads, brokers charge a few pips of fee or commission on each trade you take. This exists only ECN accounts, as a fee on STP accounts is nil.

Slippage

Due to the delay in the broker’s execution speed and volatility of the market, a trader doesn’t get the exact price he intended. This difference in prices is referred to as slippage. It typically varies from 0.5 pips to 5 pips.

Trading Range in AUD/CAD

The trading range is the representation of the minimum, average, and maximum volatility in the market in a given timeframe. This proves to be useful in determining the profit/loss that can be made in a specific amount of time. One can determine this simply by finding the product of the pip movement on the required timeframe and the pip value (mentioned in the specification table).

Procedure to assess Pip Ranges

  1. Add the ATR indicator to your chart
  2. Set the period to 1
  3. Add a 200-period SMA to this indicator
  4. Shrink the chart so you can assess a large time period
  5. Select your desired timeframe
  6. Measure the floor level and set this value as the min
  7. Measure the level of the 200-period SMA and set this as the average
  8. Measure the peak levels and set this as Max.

AUD/CAD Cost as a Percent of the Trading Range

The cost of trade is an essential point of consideration in trading. Cost is that factor that is not fixed and varies on different variables. For example, when the volatility changes, the costs change. The same is the case with timeframes as well. Below is a table that illustrates the variation in the costs on a trade for different timeframes and volatilities.

ECN Model Account

Spread = 1 | Slippage = 2 |Trading fee = 1

Total cost = Slippage + Spread + Trading Fee = 2 + 1 + 1 = 4

STP Model Account

Spread = 1.9 | Slippage = 2 | Trading fee = 0

Total cost = Slippage + Spread + Trading Fee = 2 + 1.9 + 0 = 3.9

The Ideal way to trade the AUD/CAD

Comprehending the above tables is simple. The higher the magnitude of the costs, the higher is the total cost that has to be paid on a trade and vice versa. In the table, the percentages are on the higher side in the min column and lower in the max column. Hence, it can be concluded that the costs are higher when the volatility is low and vice versa. However, it isn’t ideal to trade in these situations. It is rather preferred to enter the market when the volatility is around the average values because the costs are affordable, and the volatility is as needed.

Moreover, it is recommended to design strategies such that limit orders are put to use. This shall completely eliminate the slippage on the trade. And with the elimination of slippage, the total cost would significantly reduce as well.

Categories
Forex Assets

What Should You Know Before Trading The NZD/JPY Currency Pair

Introduction

NZDJPY, or the NZD/JPY or the New Zealand dollar against the Japanese yen, is a cross-currency pair in the Forex market. The left currency (NZD) represents the base currency, and the one the right (JPY) represents the quote currency.

Understanding NZD/JPY

The market value of NZDJPY is a value of JPY that is required to buy one NZD. It is quoted as 1 NZD per X JPY. For example, if the CMP (current market price) of NZDJPY is 72.657, then it takes 72.657 yen to buy one New Zealand dollar.

NZD/JPY Specification

Spread

Spread is the difference between the bid price and the ask price controlled by the broker. It varies across brokers and their type of execution.

ECN: 0.8 | STP: 1.7

Fees

On every trade a trader takes, there are few pips of fee on it. And this is only on ECN accounts because the fee on STP accounts is nil.

Slippage

Slippage, which happens on market orders, is the difference between the price asked by the client and the price he actually received. There are two primary reasons for it, namely, the broker’s execution speed and the change in volatility of the market.

Trading Range in NZD/JPY

The average, minimum, and maximum pip movement is determined in the trading range table. This comprehensive table helps traders assess the profit they can generate and loss they can incur in a given timeframe. Moreover, this table is helpful in analyzing the cost variation in a trade, which shall be discussed in the next section.

Procedure to assess Pip Ranges

  1. Add the ATR indicator to your chart
  2. Set the period to 1
  3. Add a 200-period SMA to this indicator
  4. Shrink the chart so you can assess a large time period
  5. Select your desired timeframe
  6. Measure the floor level and set this value as the min
  7. Measure the level of the 200-period SMA and set this as the average
  8. Measure the peak levels and set this as Max.

NZD/JPY Cost as a Percent of the Trading Range

The cost of a trade is not the same throughout the trading day. It varies based on the volatility of the market. Hence, it is necessary to know during what times the cost is high and what times it is low. This could be found out from the table illustrated below.

ECN Model Account 

Spread = 0.8 | Slippage = 2 |Trading fee = 1

Total cost = Slippage + Spread + Trading Fee = 2 + 0.8 + 1 = 3.8

STP Model Account

Spread = 1.7 | Slippage = 2 | Trading fee = 0

Total cost = Slippage + Spread + Trading Fee = 2 + 1.7 + 0 = 3.7

The Ideal way to trade the NZD/JPY

The magnitude of the cost percentage is directly proportional to the cost of a trade. So, the higher the value of the percentage, the higher is the cost of a trade. From the table, it can be observed that the cost is highest in the min column compared to the other two columns. This means that the costs are highest when the volatility of the market is low and vice versa, irrespective of the timeframe you’re trading. It is neither ideal to trade when the volatility of the market is high, nor when the costs are high. The average column is on the one we focus on. Trading when the volatility is at the average value is when you can expect moderate volatility and decent costs.

Also, you may reduce your costs by trading using limit or pending orders instead of market orders. This will bring the slippage to ground zero. This, in turn, will reduce the total cost of the trade as well. An example of the same is illustrated below.

Spread = 1.7 | Slippage = 0 | Trading fee = 0

Total cost = Slippage + Spread + Trading Fee = 0 + 1.7 + 0 = 1.7

Hence, it is seen that the costs have reduced by around 50% of the previous value.

Categories
Forex Assets

Understanding The Basics Of NZD/CHF Forex Pair

Introduction

NZDCHF is a cross-currency pair in the Forex market. It is an abbreviation for the New Zealand dollar and the Swiss franc. Here, NZD is the base currency, and CHF is the quote currency.

Understanding NZD/CHF

The value of NZDCHF simply represents the units of CHF equivalent to one unit of NZD. It is quoted as 1 NZD per X CHF. For example, in the market, if the price of NZDCHF is 0.64535, then it requires those many units of CHF to buy one NZD.

NZD/CHF Specification

Spread

The bid price and ask price in the market is typically not the same. The difference between these two prices is referred to as the spread. And this difference amount is used by the broker. It varies from the type of account model.

ECN: 1.1 | STP: 1.9

Fees

The fee is basically the commission that has to be paid on each trade you take. It varies from broker to broker and their execution type. Typically, there is no fee on STP accounts, but a few pips on ECN accounts.

Slippage

Another type of fee traders have to bear is the slippage. It is the difference between the trader’s requested price and the broker’s executed price. Slippage always is changing due to the ups and downs in market volatility and the broker’s execution speed.

Trading Range in NZD/CHF

Many novice traders randomly take trades without determining the amount they’re going to risk. The trading range is that representation, which indirectly illustrates the risk and profit area in a trade, in a given time frame. For example, if the average pip movement on NZDCAD on the 4H timeframe is 20 pips, then the trader will be risking $205.4 in an hour on an average.

Procedure to assess Pip Ranges

  1. Add the ATR indicator to your chart
  2. Set the period to 1
  3. Add a 200-period SMA to this indicator
  4. Shrink the chart so you can assess a large time period
  5. Select your desired timeframe
  6. Measure the floor level and set this value as the min
  7. Measure the level of the 200-period SMA and set this as the average
  8. Measure the peak levels and set this as Max.

NZD/CHF Cost as a Percent of the Trading Range

Apart from knowing the profit/loss that can be made from a trade in a given time, it is also necessary to know the cost variation in different volatilities and timeframes. Below is a table representing the cost as a percentage that is obtained by considering the volatility, timeframe, and the total cost on a trade.

ECN Model Account 

Spread = 1.1 | Slippage = 2 |Trading fee = 1

Total cost = Slippage + Spread + Trading Fee = 2 + 1.1 + 1 = 4.1

STP Model Account

Spread = 1.9 | Slippage = 2 | Trading fee = 0

Total cost = Slippage + Spread + Trading Fee = 2 + 1.9 + 0 = 3.9

The Ideal way to trade the NZD/CHF

Trading on any timeframe and during any volatility is not an efficient way of trading. There are specific times in the market when you must enter/exit. This can be determined from the above two tables. Firstly, the higher the magnitude of the percentage, the higher is the cost of a trade for that particular timeframe and volatility. It can be ascertained from the table that the costs are low for high volatilities and high for low volatilities. And neither of the two states is ideal to trade. To keep your cost affordable and volatility moderate, it is ideal to trade when the volatility is nearby the average values.

Furthermore, it is recommended to have strategies that enable the use of limit orders. Because trading with limit orders will completely cut off the slippage on the trade Nullifying it, the total cost will significantly reduce, which, in turn, will reduce the cost percentage as well. For example, it was observed that cost percentages were reduced by about 50% when the slippage was removed.

Categories
Forex Assets

Information About The GBP/JPY Forex Currency Pair

Introduction

The Great Britain pound versus the Japanese yen is a cross-currency pair in the forex market. It is a widely traded pair with great liquidity and volatility. In this currency pair, GBP is the base currency, and JPY is the quote currency.

Understanding GBP/JPY

The market price of GBPJPY shows the units of yens required to purchase one pound. It is quoted as 1 GBP per X JPY. For example, if the value of GBPJPY is 143.82, then 143.82 yen are to be produced by the trader to buy one pound.

GBP/JPY Specification

Spread

Spread is the difference between the bid price and the ask price set by the broker. These prices vary from broker to broker and type of account model as well. The approximate spread on ECN and SPT accounts is mentioned as follows.

ECN: 0.7 | STP: 1.6

Fees

There is a fixed round-trip fee on every trade a trader takes. On ECN accounts, the spread is around 6 to 10 pips. And on STP accounts, there is no fee as such. However, though there is no fee on STP accounts, the total fee is still compensated with the high spread on it.

Slippage

Slippage is another parameter that adds up to the total fee. It is the difference between price executed by the trader and price he actually received from the broker. This happens solely due to the change in volatility of the market and the broker’s execution speed.

Trading Range in GBP/JPY

The trading range is a pip depiction tool that determines the minimum, average, and maximum pip movement in a different timeframe. This volatility table is pretty useful in analyzing the amount of risk that is involved in a trade. For example, if the max pip movement on the 4H is 60 pips, then a trader can get an idea that he can gain/lose a max of $552.6 in a time frame of 4 hours.

Procedure to assess Pip Ranges

  1. Add the ATR indicator to your chart
  2. Set the period to 1
  3. Add a 200-period SMA to this indicator
  4. Shrink the chart so you can assess a large time period
  5. Select your desired timeframe
  6. Measure the floor level and set this value as the min
  7. Measure the level of the 200-period SMA and set this as the average
  8. Measure the peak levels and set this as Max.

GBP/JPY Cost as a Percent of the Trading Range

The cost as a percent of the trading range is again the volatility but combined with total cost on a trade. It is a tabular representation of the cost of trading in varying timeframes and volatilities. The percentages are obtained simply by finding the ratio between the total cost and volatility.

ECN Model Account

Spread = 0.7 | Slippage = 2 |Trading fee = 1

Total cost = Slippage + Spread + Trading Fee = 2 + 0.7 + 1 = 3.7

STP Model Account

Spread = 1.6 | Slippage = 2 | Trading fee = 0

Total cost = Slippage + Spread + Trading Fee = 2 + 1.6 + 0 = 3.6

The Ideal way to trade the GBP/JPY

The magnitude of the percentages basically determines how high or how low the costs are for each trade. If the percentage is high, the costs are high. If they are low, the costs are low. The very first observation that can be made is that the costs are high in the min column comparative to the average column and maximum column. Hence, the costs are high for low volatile markets, and low for high volatile markets. But, it is not ideal to trade in either of these markets. The best time to get into the pair is when the volatility is around the average values. As far as the timeframes are concerned, the cost decreases as the width of the timeframe increases.

Placing limit orders is another way to minimize your cost significantly. Because this will not take slippage into consideration for calculating the total costs. Thus, the total cost reduces greatly. An example of the same is illustrated below.

Hence, we can see that the percentages have reduced by around 50% or so.

Categories
Forex Assets

Exploring The Basics Of GBP/CAD Forex Pair

Introduction

GBPCAD pronounced as ‘pound cad” is minor/cross currency pair in forex. GBP refers to Great Britain Pound, and CAD refers to the Canadian Dollar. Since GBP is on the left, it becomes base currency, and CAD on the right becomes the quote currency.

Understanding GBP/CAD

The current market price has of GBPCAD is not similar to the prices in the stock market. The value of GBPCAD represents the value of CAD equivalent to one GBP. It is simply quoted as 1 GBP per X CAD. For example, if the value of GBPCAD is 1.7192, then 1.7192 Canadian dollars are required to purchase one pound.

GBP/CAD Specification

Spread

Spread is the difference between the bid price and the ask price in the market. These values are controlled by the brokers. So, it differs from broker to broker as well as the type of account.

ECN: 0.8 | STP: 1.9

Fees

There is a small levied by the broker on every trade a trader takes. There are a few pips of fee on ECN accounts, while the fee is nil on STP accounts. The fee is usually between 6 to 10 pips.

Slippage

Slippage is the difference between the trader’s demanded price and the real executed price. Slippage happens when orders are executed by the market price. It happens solely due to the volatility of the market and the broker’s execution speed.

Trading Range in GBP/CAD

A trading range is the representation of the pip movement of GBPCAD in different timeframes. These values are helpful in getting a rough idea of the profit/loss that can be made from the trade in a given timeframe. For example, if the min pip movement on the 1H timeframe is 3 pips, then a trader can expect to gain/lose at least $22.38 when one standard lot is traded.

Procedure to assess Pip Ranges

  1. Add the ATR indicator to your chart
  2. Set the period to 1
  3. Add a 200-period SMA to this indicator
  4. Shrink the chart so you can assess a large time period
  5. Select your desired timeframe
  6. Measure the floor level and set this value as the min
  7. Measure the level of the 200-period SMA and set this as the average
  8. Measure the peak levels and set this as Max.

GBP/CAD Cost as a Percent of the Trading Range

Now that we know how much profit/loss can be made within a given time frame let us also calculate the cost on each trade by considering the volatility and timeframe. For this, the ratio between the total cost and volatility calculated and expressed in percentages. The magnitude of these percentages will then be used to determine the timeframe with marginal costs.

ECN Model Account 

Spread = 0.8 | Slippage = 2 |Trading fee = 1

Total cost = Slippage + Spread + Trading Fee = 2 + 0.8 + 1 = 3.8

STP Model Account

Spread = 1.9 | Slippage = 2 | Trading fee = 0

Total cost = Slippage + Spread + Trading Fee = 2 + 1.9 + 0 = 3.9

The Ideal way to trade the GBP/CAD

From the above two tables, it can be ascertained that the percentages largest on the min column, moderate on the average column, and least on the max column. The higher the value of percentages, the higher is the cost of the trade. So with this, we can conclude that the costs are high during low volatility, and low during high volatility. Similarly, the costs are high on lower timeframes and considerably low on higher timeframes. Hence, to keep volatility and cost at a balance, it ideal to trade when the pip movement in the market is around the average values.

Market orders bring in an additional cost in the trade. To eliminate this, one can trade using limit orders. This will set the slippage value to 0, and eventually, reduce the total cost on the trade by a significant amount. An example supporting the statement is illustrated below.

Total cost = Spread + trading fee + slippage = 0.8 +1 + 0 = 1.8

Categories
Forex Assets

What Should You Know Before Trading The GBP/CHF Currency Pair?

Introduction

GBPCHF is the abbreviation for the Great Britain pound and the Swiss franc. Since USD is not involved in this pair, it is called a minor currency pair. However, there is an excellent liquidity and volatility in this pair. In this pair, GBP is the base currency, and CHF is the quote currency. GBPCHF is often referred to as “pound Swiss franc.”

Understanding GBP/CHF

The value of GBPCHF determines the Swiss francs required to purchase one pound. It is quoted as 1 GBP per X CHF. For example, if the value of GBPCHF is 1.2740, then one needs to pay 1.2740 Swiss francs to buy a pound.

GBP/CHF Specification

Spread

Spread is the difference between the bid price and the ask price in the market. The bid price is the price used for shorting, and the bid price is the price used for buying a currency pair. These prices differ from broker to broker as well as the account type.

ECN: 0.8 | STP: 1.6

Fees

For every trade a trader takes, there is a fee associated with it. This fee is basically the commission charged by the broker. This fee varies from broker to broker. Note that there is no fee on STP accounts, and on ECN accounts, the fee is around 6 to10 pips.

Slippage

Slippage in trading is the difference between the price requested by the trader and the price given by the broker. Due to variation in volatility and the broker’s execution speed, it is not quite possible to get the exact intended price. Slippage happens only on market orders.

Trading Range in GBP/CHF

Knowing the number of pips the currency pair moved in a given timeframe is a good add-on to a trader’s analysis. This will help them get an idea of the profit/loss that can be made in a specified amount of time. For example, if the average pip movement on the 1D timeframe is 50 pips, then a trader can expect to gain or lose $517.5 (50 pips x 10.35 value per pip).

Procedure to assess Pip Ranges

  1. Add the ATR indicator to your chart
  2. Set the period to 1
  3. Add a 200-period SMA to this indicator
  4. Shrink the chart so you can determine an extensive period
  5. Select your desired timeframe
  6. Measure the floor level and set this value as the min
  7. Measure the level of the 200-period SMA and set this as the average
  8. Measure the peak levels and set this as Max.

GBP/CHF Cost as a Percent of the Trading Range

The cost as a percent of the trading range depicts the magnitude of the variation in the cost in different timeframes for different variable volatility. The percentages are useful in determining the ideal time to enter into this currency pair with marginal costs. Below are the tables representing the cost percentages for minimum, average, and maximum volatility.

ECN Model Account 

Spread = 0.8 | Slippage = 2 |Trading fee = 1

Total cost = Slippage + Spread + Trading Fee = 2 + 0.8 + 1 = 3.8

STP Model Account

Spread = 1.6 | Slippage = 2 | Trading fee = 0

Total cost = Slippage + Spread + Trading Fee = 2 + 1.6 + 0 = 3.6

The Ideal way to trade the GBP/CHF

The lower the percentage, the lower are cost on the trade. In the table, we can infer that the costs are on the lower side in the max column. This implies that the cost of the trade is less when the volatility of the market is low and vice versa. Now, when it comes to the best time to trade this pair, it is ideal to pick at times when the volatility is decent, and the costs are affordable. For example, a 1D trader may trade during those times when the volatility is around 100 pips.

Moreover, the total cost of the trade can be reduced by entering and exiting trades using limit/pending orders. This way, the slippage on the trade will be fully cut off. The impact on the cost percentage when slippage is made 0 is shown below.

Total cost = Spread + trading fee + slippage = 0.8 +1 + 0 = 1.8

From the above table, it is evident that the costs have reduced by over 50% or so. Hence, it is preferable to trade using limit orders rather than market orders.

Categories
Forex Assets

Understanding The EUR/JPY Asset Class

Introduction

The Euro area’s euro against the Japanese yen, in short, is termed as EURJPY. This pair, too, like the EURCHF, EURNZD, EURCAD, EURGBP, etc. is a minor or cross currency pair. It is one of the most traded currency pairs in the forex market. Here, the EUR is the base currency, and JPY is the quote currency. The value of this pair is quoted in terms of the quote currency.

Understanding EUR/JPY

This currency pair is precisely quoted as 1 EUR per X JPY. In simple terms, the value determines the units of the quote currency (JPY) required to buy one unit of the base currency (EUR). For example, if the market value of EURJPY is 121.00, it basically means that these many yen are required to purchase one euro.

EUR/JPY Specification

Spread

Spread is the difference between the bid price and the ask price set by the broker. This value is not constant and varies from broker to broker. It also varies on the type of account model.

Spread on ECN model: 0.6

Spread on STP model: 1.5

Fees

Spread is not the only way through which brokers generate their revenue. They charge some fee (commission) on each trade as well. Fees again vary from broker to broker and account model. Typically, there is no fee on an STP account. However, there are a few pips or fees on an ECN account as their spread is lesser than an STP account.

Slippage

Slippage is the difference between the trader’s asked price and the actual price given to him. Two factors majorly affect slippage on a trade; one, the volatility of the market, and two, broker’s execution speed. The slippage is usually within 0.5 to 5 pips. For major currencies, the slippage is much lower.

Trading Range in EUR/JPY

The trading range is the illustration of the minimum, average, and the maximum number of the pips the currency pair has moved in a given time frame. These values help assess the profit/loss potential of a trade. For instance, if the max volatility on the 1H is 10 pips, then one can expect to win or lose a maximum of $92 (10 pip x 9.20 value per pip) in an hour or two.

Procedure to assess Pip Ranges

  1. Add the ATR indicator to your chart
  2. Set the period to 1
  3. Add a 200-period SMA to this indicator
  4. Shrink the chart so you can determine an extensive period
  5. Select your desired timeframe
  6. Measure the floor level and set this value as the min
  7. Measure the level of the 200-period SMA and set this as the average
  8. Measure the peak levels and set this as Max.

EUR/JPY Cost as a Percent of the Trading Range

In addition to assessing the profit/loss in a timeframe ahead of time, we can use these values in determining the cost variation in different timeframes and volatility as well. The cost as a percent of the trading range tells the min, average, max costs by considering the timeframes and volatility as its variables.

ECN Model Account 

Spread = 0.6 | Slippage = 2 | Trading fee = 1

Total cost = Slippage + Spread + Trading Fee = 2 + 0.6 + 1 = 3.6

STP Model Account

Spread = 1.5 | Slippage = 2 | Trading fee = 0

Total cost = Slippage + Spread + Trading Fee = 2 + 1.5 + 0 = 3.5

The Ideal way to trade the EUR/JPY

Above are the costs of each trade in terms of percentages. Note that they do not represent the actual cost on trade in terms of dollars, but are magnitude values which can be used for comparing with other values. The higher the magnitude of the percentage, the higher is the cost on the trade for that particular timeframe and volatility. From the tables, it can be ascertained that the values are highest on the min column and lowest on the max column. This, in turn, implies that the costs are higher when the volatility is low and vice versa. Talking about the timeframe, the costs are high on the lower timeframes and low on the higher timeframes. So, a day trader may preferably trade on the 2H/4H when the volatility is around the average values. And long-term traders may trade the 1W/1M whatsoever be the volatility of the market.

Furthermore, a trader may reduce their costs by entering and exiting trades using limit order instead of market orders. This will completely erase the slippage on the trade. An example of the same is given below.

Total cost = Spread + trading fee = 0.6 +1 = 1.6

Categories
Forex Assets

Everything About EUR/CAD Currency Pair

Introduction

EURCAD is the abbreviation for the currency pair Euro area’s euro and the Canadian dollar. This is a cross-currency pair, as it does not involve the US dollar. In EURCAD, EUR is the base currency, and CAD is the quote currency. The price of this pair basically tells the value of CAD w.r.t EUR.

Understanding EUR/CAD

The current market price of EURCAD determines the required Canadian dollars to purchase one euro. It is quoted as 1 EUR per X CAD. For example, if the CMP of EURCAD is 1.4700, it is as good as saying that 1.4700 CAD is needed to buy one EUR.

EUR/CAD Specification

Spread

The algebraic difference between the bid price and the ask price set by the broker is known as the spread. Spread varies from time to time and broker to broker. The approximate spread value on an ECN account is 0.8, and on an STP account is 1.8.

Fees

For every position that a trader opens, there is some fee associated with it. And it depends on the type of account model. It is seen that there is no fee on STP accounts and a few pips on ECN accounts.

Slippage

Slippage is terminology in trading, which, by definition, is the difference between the trader’s wished price and the real executed price. That is, the trader does not get the exact price he had intended for. There is some variation due to the volatility of the market and the broker’s execution speed. It usually varies from 0.5 to 5 pips on these minor currency pairs. The slippage is typically lesser on major currency pairs.

Trading Range in EUR/CAD

The trading range is an illustration of the minimum, average, and maximum pip movement in EURCAD. It determines the volatility of the market. The volatility of the market is a vital piece of information in trading, as one can assess the time that can be taken on each trade. And by applying more variables to it, one can determine the cost varies on the trade as well.

Procedure to assess Pip Ranges

  1. Add the ATR indicator to your chart
  2. Set the period to 1
  3. Add a 200-period SMA to this indicator
  4. Shrink the chart so you can assess a large time period
  5. Select your desired timeframe
  6. Measure the floor level and set this value as the min
  7. Measure the level of the 200-period SMA and set this as the average
  8. Measure the peak levels and set this as Max.

EUR/CAD Cost as a Percent of the Trading Range

Cost as a percent of the trading range is a simple yet very effective application of the above volatility table. There is a cost on every trade you take. The total cost of a trade is the sum of slippage, spread, and trading fee. This total cost is divided by the volatility values and is expressed in terms of a percentage. And the percentage values are used to figure out the best times of the day to enter and exit a trade with marginal cost.

ECN Model Account 

Spread = 0.8 | Slippage = 2 | Trading fee = 1

Total cost = Slippage + Spread + Trading Fee = 2 + 0.8 + 1 = 3.8

STP Model Account

Spread = 1.8 | Slippage = 2 | Trading fee = 0

Total cost = Slippage + Spread + Trading Fee = 2 + 1.8 + 0 = 3.8

The Ideal way to trade the EUR/GBP

To determine the ideal way of trading the EURCAD, let us first comprehend what the percentage means.

High percentage => High cost

Low percentage => Low cost

Min column => Low volatility

Max column => High volatility

From the table, we can infer that the percentages are high in the min column and low for the max column. So,

Min column => High percentage

Thus, Low volatility => High cost

Max column => Low percentage

Thus, High volatility => Low cost

It is not ideal during low volatility as costs are high. Also, trading during high volatility is not a good idea as it is quite risky. Hence, to have a balance between both volatility and cost, it is ideal to trade when the pip movement on the currency pair is at the average values.

Another simple hack to reduce the costs is to trade using limit orders instead of market orders. Doing so, the slippage will be automatically cut off from the trade, and the total cost will significantly reduce.

Categories
Forex Assets

Understanding The EUR/AUD Forex Currency Pair

Introduction

EURAUD is a minor/cross currency pair traded in the forex market. EURAUD is the abbreviation for the euro area’s euro and the Australian dollar. The left currency, EUR is the base currency and the one on the right, AUD is the quote currency. The price of EURAUD basically tells the value of the Australian dollar.

Understanding EUR/AUD

The exchange rate of EURAUD shows the Australian dollars required to purchase one euro. It is quoted as 1EUR per X AUD. For example, if the value of EURAUD is 1.5995, it means that these many units of AUD are to be possessed by the trader to buy one unit of EUR.

EUR/AUD Specification

Spread

Spread is the way through which brokers make money. It is merely the difference between the bid price and the ask price set by the broker. These prices are often different from broker to broker. The spread differs based on the volatility of the market as well. The approximate spread on an ECN account and an STP account is given below.

ECN: 0.9 | STP: 1.7

Fees

For every trade a trader takes, there is some fee associated with it. And this fee is charged only by ECN type brokers. Typically, there is no fee on STP type brokers. The fee range is usually between 6 pips and 10 pips.

Slippage

A trader can place trades using either market order or using a limit order. In the case of market orders, the trader doesn’t get the exact price at which he executed the trade. The real price he received is different. This difference in the price is referred to as slippage.

Trading Range in EUR/AUD

As a professional trader, it is vital to know how many pips the currency pair moves in each timeframe. It gives the trader an idea of how long he must wait for his trade to perform. Traders can also assess their profit/loss in a given time frame. For example, if a trader takes a trade by analyzing the 1H timeframe, and the min market volatility is three pips, then he can expect to win or lose at least $20.91 (3 pips x $6.97 value per pip).

Procedure to assess Pip Ranges

  1. Add the ATR indicator to your chart
  2. Set the period to 1
  3. Add a 200-period SMA to this indicator
  4. Shrink the chart so you can assess a large time period
  5. Select your desired timeframe
  6. Measure the floor level and set this value as the min
  7. Measure the level of the 200-period SMA and set this as the average
  8. Measure the peak levels and set this as Max.

EUR/AUD Cost as a Percent of the Trading Range

Apart from knowing the potential profit/loss from the volatility of the market in different timeframes, one can also determine the cost variation by considering the volatility and the timeframe. For this, the ratio between total cost and volatility is taken into account. It is then expressed in terms of percentage. The magnitude of the percentage determines the cost of each trade.

ECN Model Account

Spread = 0.9 | Slippage = 2 | Trading fee = 1

Total cost = Slippage + Spread + Trading Fee = 2 + 0.9 + 1 = 3.9

STP Model Account

Spread = 1.6 | Slippage = 2 | Trading fee = 0

Total cost = Slippage + Spread + Trading Fee = 2 + 1.7 + 0 = 3.7

The Ideal way to trade the EUR/AUD

Now that we’ve got the values from the above table, here is our ideal way to trade the EUR/AUD.

The higher the magnitude of the percentages, the higher is the cost of the trade on that particular timeframe. Comprehending this to the above table, it is seen that the percentages are highest and lowest on the min and max columns, respectively. This, in turn, implies that the costs are high when the volatility of the market is feeble. And the costs are low when the volatility is high. So, it is ideal to trade on any timeframe, given the volatility of the market is above average volatility. This will ensure the fairly high volatility with affordable costs.

Furthermore, the costs can be made much lower by placing limit orders instead of market orders because this will reduce the slippage on the trade to zero. As an example, the cost percentage table is given by ignoring the slippage value.

Thus, comparing the two tables, it is evident that the costs have reduced by 50%.