Categories
Forex Signals

AUDCAD Breakout Retest BUY

Flow Assessment

  • Price is in a strong up-flow and the seller pullback is coming in with weaker volatility and strength

Location Assessment

  • We look to trade near the key buyer area, where there was a high volatility reaction previously

Momentum Assessment

  • Allow the sellers to try 1 more time since the sellers approached the key buyer area in a sharp way, but after signs of buyers holding the level even after the seller’s 2nd try, this is a sign for taking the buy
Categories
Forex Assets

Understanding The AUD/CAD Forex Currency Pair

Introduction

AUDCAD is the abbreviation for the currency pair, the Australian dollar, and the Canadian dollar. It is a cross-currency pair. One can expect great volatility and liquidity in the market during the Australian session. AUD is the base currency, and CAD is the quote currency.

Understanding AUD/CAD

The value of AUDCAD is the number of Canadian dollars required to buy one Australian dollar. It is quoted as 1 AUD per X CAD. For example, if the value of this pair is 0.9013, then 0.9013 CAD is needed to purchase one AUD.

AUD/CAD Specification

Spread

Spread in trading is the difference between the bid price and the ask price set by the broker. This pip difference is how brokers generate revenue. The spread always varies from broker to broker and the type of account model.

ECN: 1 | STP: 1.9

Fees

Apart from spreads, brokers charge a few pips of fee or commission on each trade you take. This exists only ECN accounts, as a fee on STP accounts is nil.

Slippage

Due to the delay in the broker’s execution speed and volatility of the market, a trader doesn’t get the exact price he intended. This difference in prices is referred to as slippage. It typically varies from 0.5 pips to 5 pips.

Trading Range in AUD/CAD

The trading range is the representation of the minimum, average, and maximum volatility in the market in a given timeframe. This proves to be useful in determining the profit/loss that can be made in a specific amount of time. One can determine this simply by finding the product of the pip movement on the required timeframe and the pip value (mentioned in the specification table).

Procedure to assess Pip Ranges

  1. Add the ATR indicator to your chart
  2. Set the period to 1
  3. Add a 200-period SMA to this indicator
  4. Shrink the chart so you can assess a large time period
  5. Select your desired timeframe
  6. Measure the floor level and set this value as the min
  7. Measure the level of the 200-period SMA and set this as the average
  8. Measure the peak levels and set this as Max.

AUD/CAD Cost as a Percent of the Trading Range

The cost of trade is an essential point of consideration in trading. Cost is that factor that is not fixed and varies on different variables. For example, when the volatility changes, the costs change. The same is the case with timeframes as well. Below is a table that illustrates the variation in the costs on a trade for different timeframes and volatilities.

ECN Model Account

Spread = 1 | Slippage = 2 |Trading fee = 1

Total cost = Slippage + Spread + Trading Fee = 2 + 1 + 1 = 4

STP Model Account

Spread = 1.9 | Slippage = 2 | Trading fee = 0

Total cost = Slippage + Spread + Trading Fee = 2 + 1.9 + 0 = 3.9

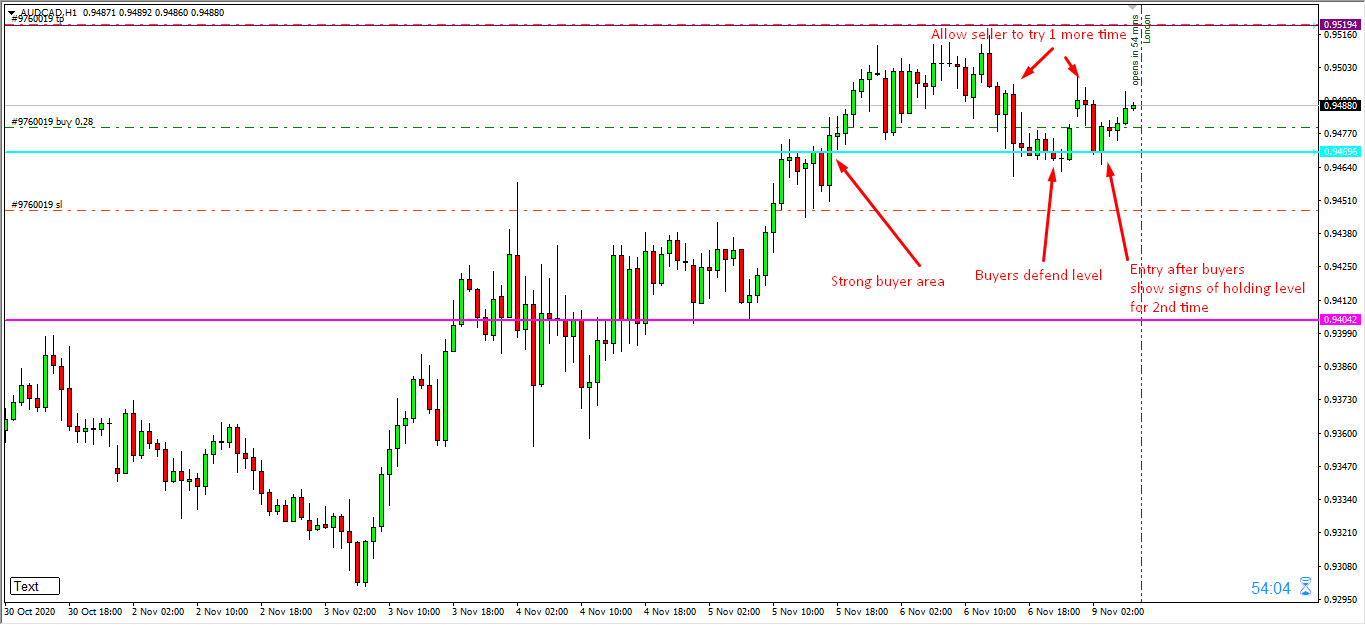
The Ideal way to trade the AUD/CAD

Comprehending the above tables is simple. The higher the magnitude of the costs, the higher is the total cost that has to be paid on a trade and vice versa. In the table, the percentages are on the higher side in the min column and lower in the max column. Hence, it can be concluded that the costs are higher when the volatility is low and vice versa. However, it isn’t ideal to trade in these situations. It is rather preferred to enter the market when the volatility is around the average values because the costs are affordable, and the volatility is as needed.

Moreover, it is recommended to design strategies such that limit orders are put to use. This shall completely eliminate the slippage on the trade. And with the elimination of slippage, the total cost would significantly reduce as well.

Categories
Forex Educational Library

Forex.Academy 2018-2019 Outlook – CAD Group


Summary


Forex Daily News: In this post, we analyse the Canadian Dollar group against their main currencies. As a summary, the second half of the year and 2019, we foresee a corrective movement in the Canadian currency, which could come supported for a correction in oil prices to, then, give way to a new rally. After this correction, our central vision for the Canadian Dollar is a new appreciation scenario.

Additionally, we observe that it is likely that GBP and EUR would show the best performance against the CAD; on the opposite side, the Japanese currency and the Swiss Franc could have the worst performance against the Canadian Dollar.


USDCAD

The USDCAD is developing a complex corrective structure of a second bullish impulsive wave. The corrective structure has a bearish bias, which could find support in the area between 1.29607 to 1.28371. The key level to watch out is 1.2884, this level should convert on a critical pivot level (HHL).


EURCAD

EURCAD cross in the short-term has a bearish bias, probably could see new lows in 1.50 zone. In the mid-term, the cross moves sideways as a complex corrective. In the long-term, we foresee that the EURCAD could find fresh lows in the area between 1.47822 to 1.45662, from where the cross could start a new rally as a fifth bullish wave. Invalidation level is at 1.4442.


GBPCAD

Probably the GBPCAD cross shows the clearest movement of the CAD Group. The price is moving in a bearish A-B-C sequence, which could find support at 1.6410 level, from where the price could create a new connector and then initiate a rally. The new bullish sequence has a target the area between 1.8533 and 1.9266. Invalidation level is at 1.5837.


CADJPY

The CADJPY cross has been commented in a previous analysis, and we maintain the main idea which consists in to seek only long positions with a long-term profit target in the area between 94.69 and 95.30. Is probably that the cross makes a retrace to the area between 85.45 to 83.73 from where we could find new opportunities to incorporate us into the trend. Invalidation level is located at 82.17.


CADCHF

In the CADCHF cross, the lemma is “Buy the Dips” or “Watch the Breakout.” CADCHF is running sideways in an upper degree consolidation structure. The key level to control is 0.7636, after the breakout of this level, we expect more upsides to the zone between 0.7992 and 0.8245. In case that the price makes a false breakdown to the area between 0.7394 and 0.7289, it could be an attractive opportunity to look for the long side. Invalidation level is at 0.7124.


NZDCAD

In the long-term, NZDCAD is running sideways and making lower highs. The long-term pivot level is at 0.8640. For this cross, we expect only short positions; if the price makes a bullish move, the potential movement is limited to the area between 0.9253 to 0.9461. The long-term target area is between 0.8401 to 0.8098.


AUDCAD

Probably the AUDCAD cross is the less attractive to trade. As we can see in the weekly chart, it is running sideways since the second half of 2013. The price is moving inside a bearish cycle, which could find support in the “long-term pivot level” at 0.8919, from where AUDCAD could start to bounce. The invalidation level for the bearish cycle is at 1.0397.


Forex Daily News: Finally, as a technical note, considering that the AUDCAD is mostly bearish, by correlation, the CAD should perform better than the AUD for the period foreseen.