Introduction
AUDCAD is the abbreviation for the currency pair, the Australian dollar, and the Canadian dollar. It is a cross-currency pair. One can expect great volatility and liquidity in the market during the Australian session. AUD is the base currency, and CAD is the quote currency.
Understanding AUD/CAD
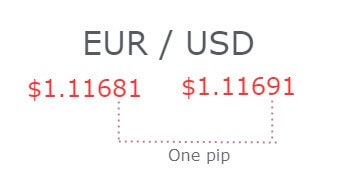
The value of AUDCAD is the number of Canadian dollars required to buy one Australian dollar. It is quoted as 1 AUD per X CAD. For example, if the value of this pair is 0.9013, then 0.9013 CAD is needed to purchase one AUD.
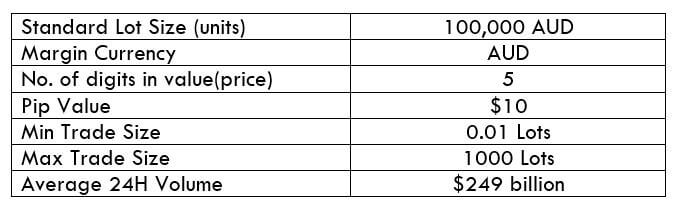
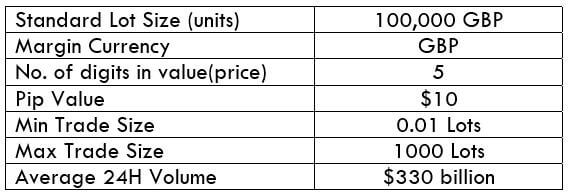
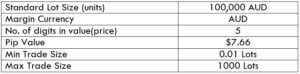
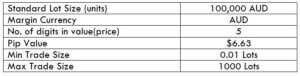
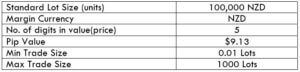
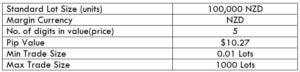
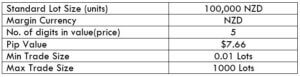
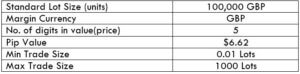
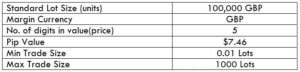
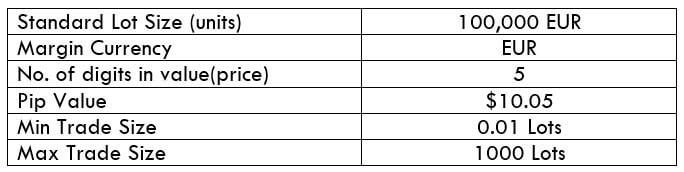
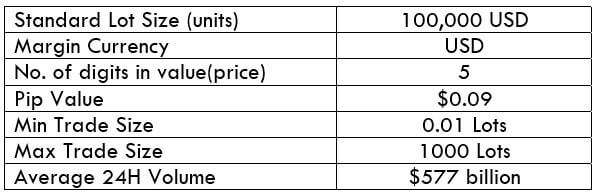
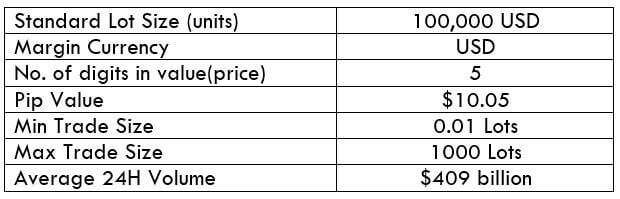
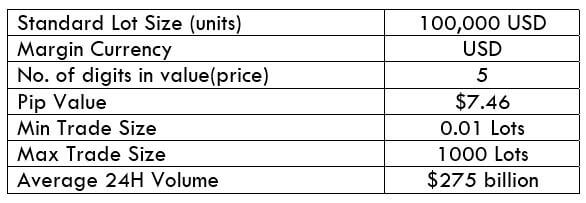
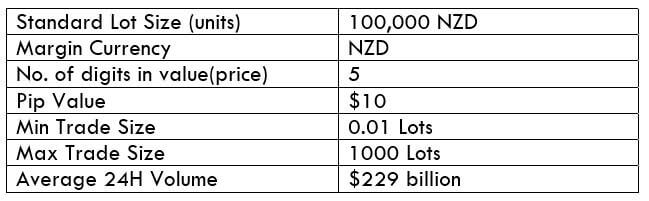
AUD/CAD Specification
Spread
Spread in trading is the difference between the bid price and the ask price set by the broker. This pip difference is how brokers generate revenue. The spread always varies from broker to broker and the type of account model.
ECN: 1 | STP: 1.9
Fees
Apart from spreads, brokers charge a few pips of fee or commission on each trade you take. This exists only ECN accounts, as a fee on STP accounts is nil.
Slippage
Due to the delay in the broker’s execution speed and volatility of the market, a trader doesn’t get the exact price he intended. This difference in prices is referred to as slippage. It typically varies from 0.5 pips to 5 pips.
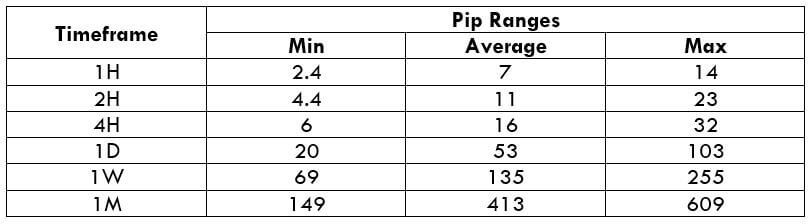
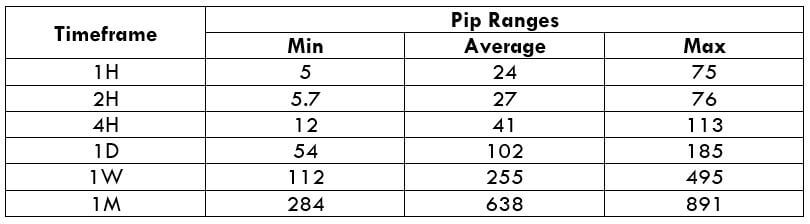
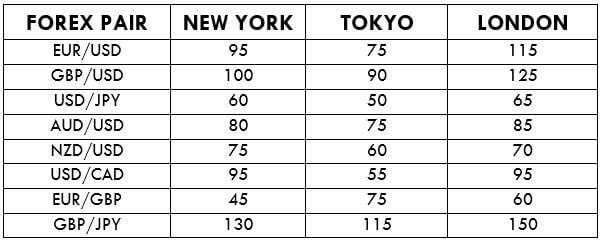
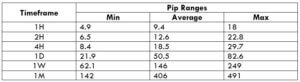
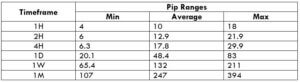
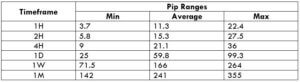
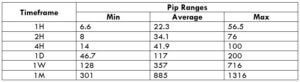
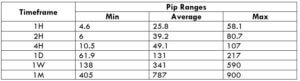
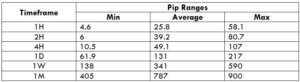
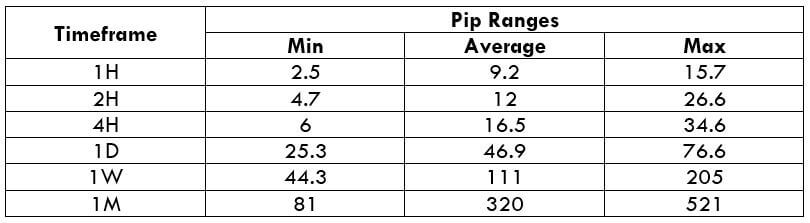
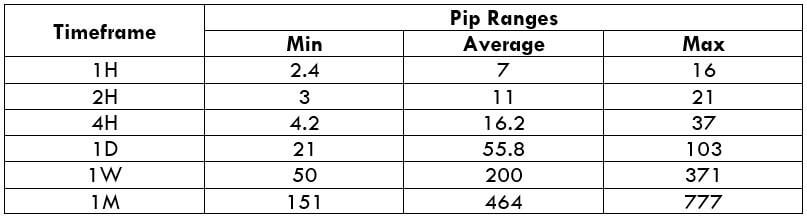
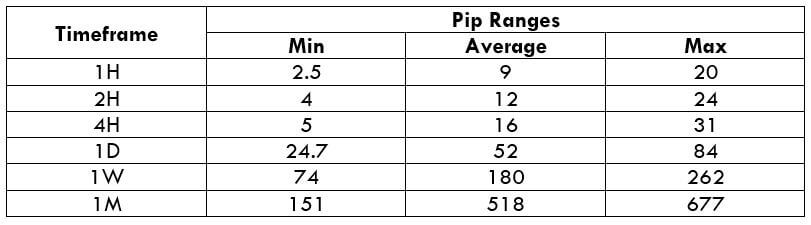
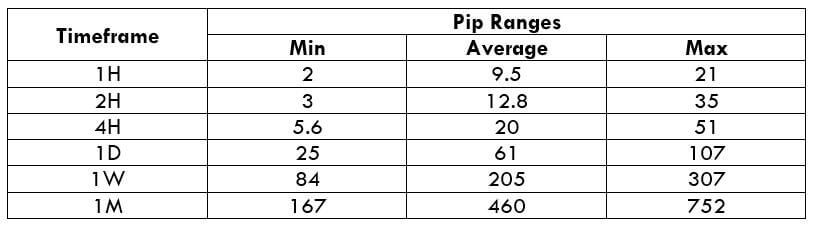
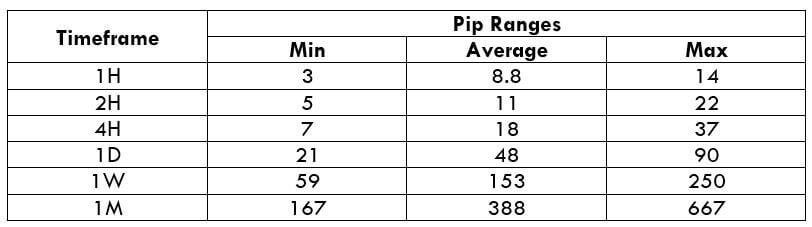
Trading Range in AUD/CAD
The trading range is the representation of the minimum, average, and maximum volatility in the market in a given timeframe. This proves to be useful in determining the profit/loss that can be made in a specific amount of time. One can determine this simply by finding the product of the pip movement on the required timeframe and the pip value (mentioned in the specification table).
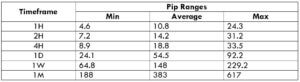
Procedure to assess Pip Ranges
- Add the ATR indicator to your chart
- Set the period to 1
- Add a 200-period SMA to this indicator
- Shrink the chart so you can assess a large time period
- Select your desired timeframe
- Measure the floor level and set this value as the min
- Measure the level of the 200-period SMA and set this as the average
- Measure the peak levels and set this as Max.
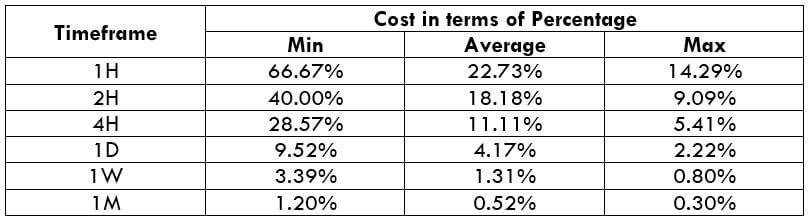
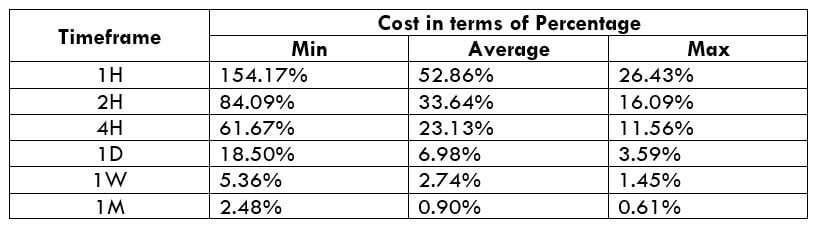
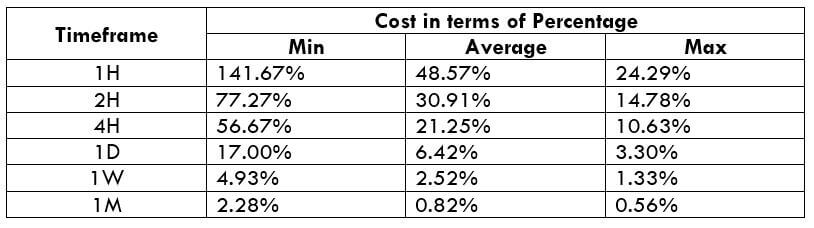
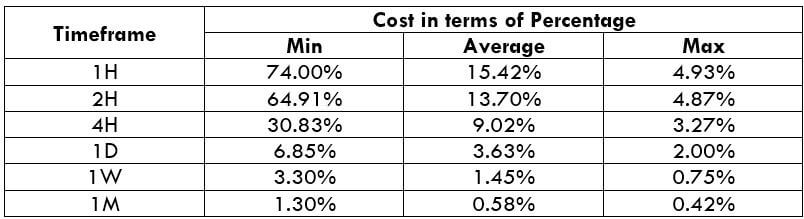
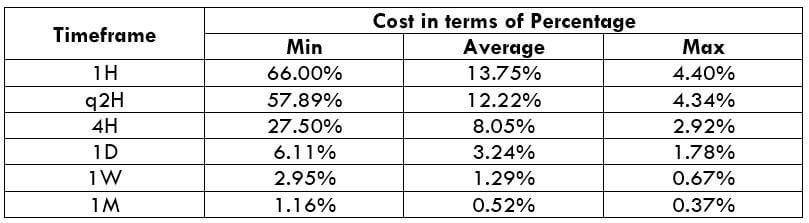
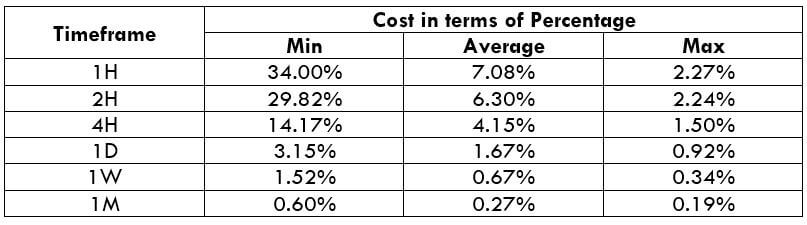
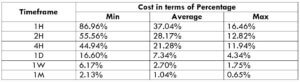
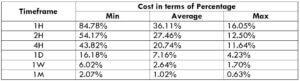
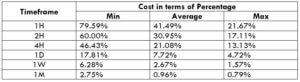
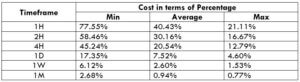
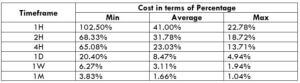
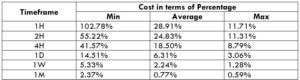
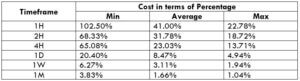
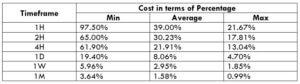
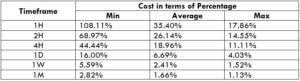
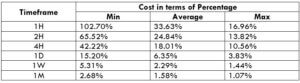
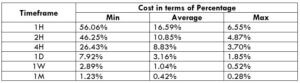
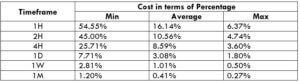
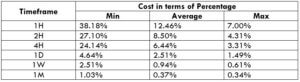
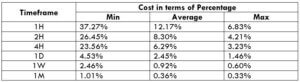
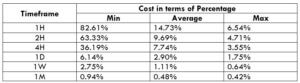
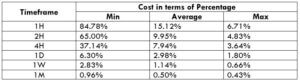
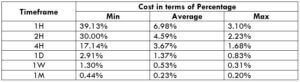
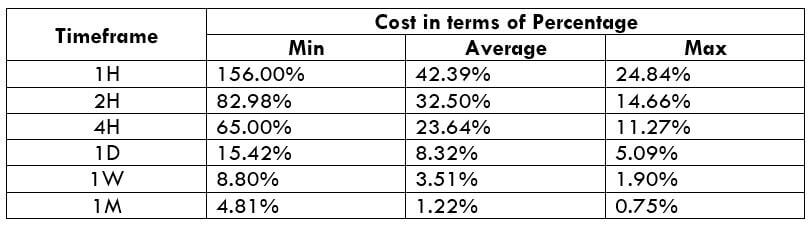
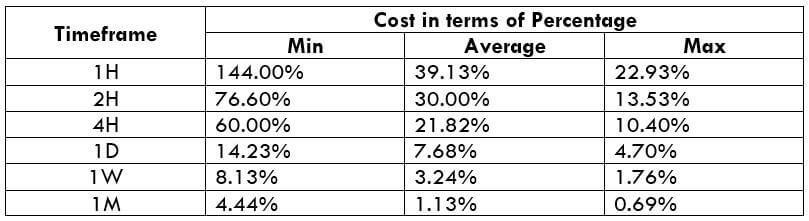
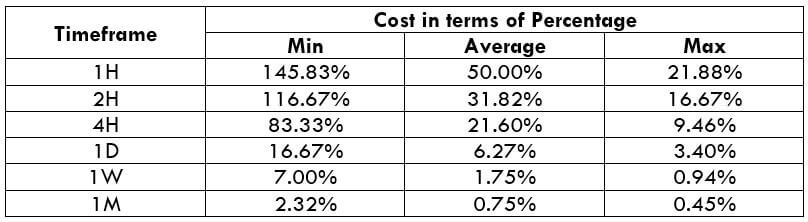
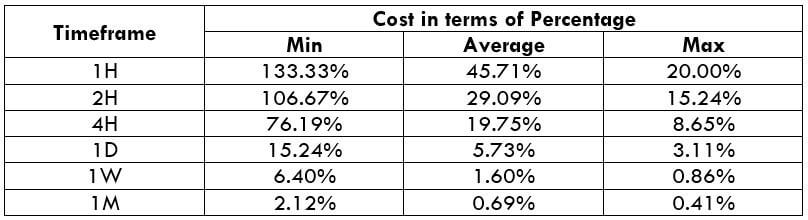
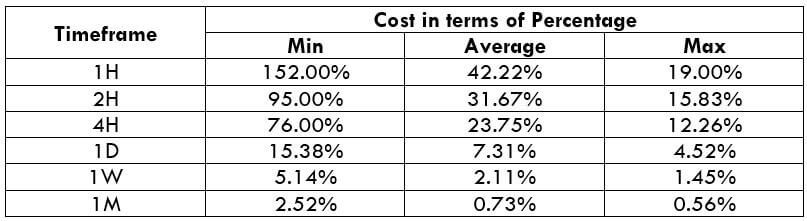
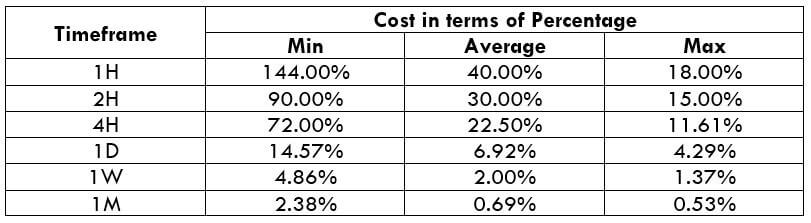
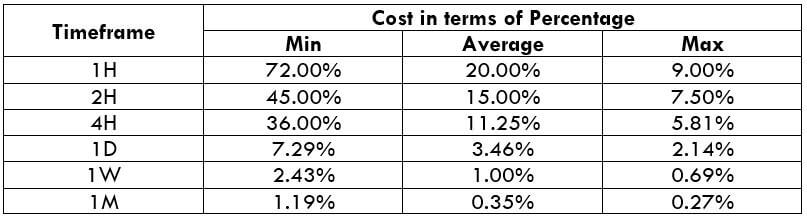
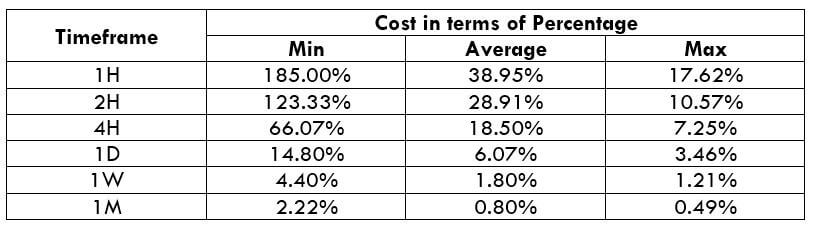
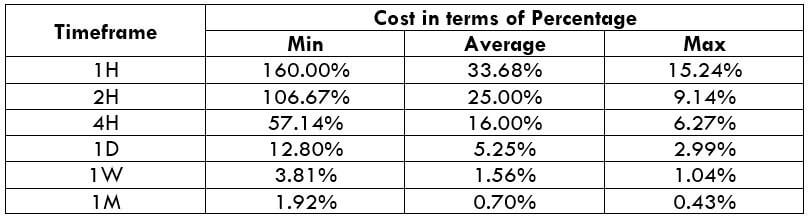
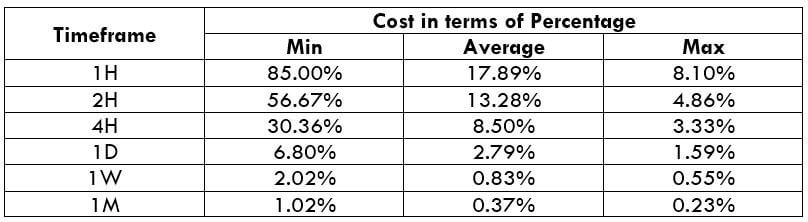
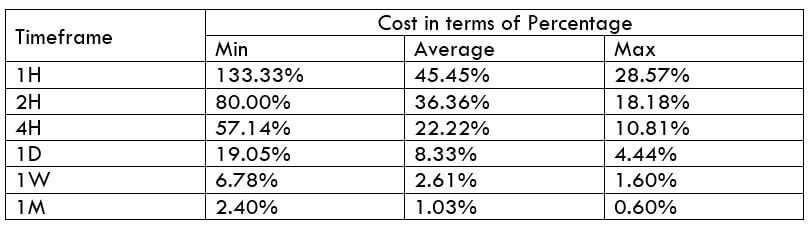
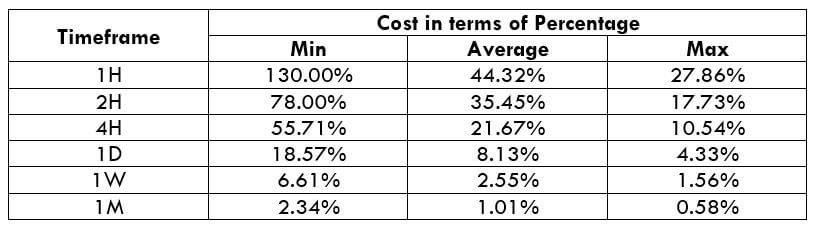
AUD/CAD Cost as a Percent of the Trading Range
The cost of trade is an essential point of consideration in trading. Cost is that factor that is not fixed and varies on different variables. For example, when the volatility changes, the costs change. The same is the case with timeframes as well. Below is a table that illustrates the variation in the costs on a trade for different timeframes and volatilities.
ECN Model Account
Spread = 1 | Slippage = 2 |Trading fee = 1
Total cost = Slippage + Spread + Trading Fee = 2 + 1 + 1 = 4
STP Model Account
Spread = 1.9 | Slippage = 2 | Trading fee = 0
Total cost = Slippage + Spread + Trading Fee = 2 + 1.9 + 0 = 3.9
 The Ideal way to trade the AUD/CAD
Comprehending the above tables is simple. The higher the magnitude of the costs, the higher is the total cost that has to be paid on a trade and vice versa. In the table, the percentages are on the higher side in the min column and lower in the max column. Hence, it can be concluded that the costs are higher when the volatility is low and vice versa. However, it isn’t ideal to trade in these situations. It is rather preferred to enter the market when the volatility is around the average values because the costs are affordable, and the volatility is as needed.
Moreover, it is recommended to design strategies such that limit orders are put to use. This shall completely eliminate the slippage on the trade. And with the elimination of slippage, the total cost would significantly reduce as well.

 The Ideal way to trade the AUD/NZD


 The Ideal way to trade the GBP/NZD
 The Ideal Timeframe to Trade NZD/USD