Categories
Forex Market Analysis

EUR/CHF Triangle Breakout – Time to Short the Pair!  

The EUR/CHF is facing stiff resistance around 1.05440, which is mostly extended by a descending triangle pattern that has already been violated. This may drive the EUR/CHF pair further lower until the next support area of 1.0502. The Euro as a signal currency is still staying bearish in the wake of an increased number of COVID 19 cases around the globe.  

Most of the selling in the EUR/CHF pair triggered after the Eurozone money market rates crawled lower from four-year speak. It’s a hint the Euribor benchmark may be beginning to counter to European Central Bank measures aimed at reducing the funding rush beyond the single currency bloc. Declines in the oil prices could be recovered during the day ahead, mainly due to the risk recovery in the market, as the coronavirus cases are showing some sign of a slowdown in global economies. 


The EUR/CHF pair has formed a descending triangle pattern which was supporting the pair around 1.0540 along with resistance around 1.05675. As we can see, the pair has already breached the descending triangle pattern, which now opens further room for selling until the next target level of 1.0540.  

The 50 EMA and the descending trendline is weighting on the cross pair, and it may drive selling bias in the EUR/CHF today. The violation of 1.0540 level can extend the selling trend until the next target level of 1.0520 and 1.0509. Good luck! 

Categories
Forex Assets

What Should You Know About The EUR/CHF Forex Pair?

Introduction

EURCHF is the abbreviation for the Euro area’s euro and the Swiss franc. This currency pair is a minor/cross currency pair. Here, EUR is the base currency, and CHF is the quote currency. Trading the EURCHF is commonly called trading the ‘swissie.’

Understanding EUR/CHF

The value of EURCHF determines the number of units of Swiss francs required to purchase one euro. It is quoted as 1 euro per X francs. For example, if the value of 1.3000, it means that one must pay 1.3000 francs to buy one euro.

EUR/CHF Specification

Spread

Spreads are the way by which brokers make their money. There is a separate price to buy a currency pair and a separate price to sell it. To buy, one must refer to the ask price, and to sell, one must refer to the bid price of the currency pair. The difference between these two prices is known as the spread. This spread usually differs from account type. The average spread on ECN and STP model account are as follows:

ECN: 0.9 | STP: 1.6

Fees

The fee is nothing but the commission charged by the broker on a single trade. The fee also varies base on account type.

Fee on STP account: NIL

Fee on ECN account: 1 pip

Note: The fee depends from broker to broker. Here, we have taken the average value by referring to some brokers.

Slippage

Slippage in trading is the difference between the trader’s desired price and the real executed price by the broker. The slippage value depends on two factors:

  • Broker’s execution speed
  • Currency pair’s volatility

Trading Range in EUR/CHF

The trading range in EURCHF is the representation of the minimum, average, and maximum pip movement in different timeframes. These values can be used to assess one’s approximate profit or loss in a given time frame. For example, if the volatility on the 1H timeframe is five pips, then one can expect to be in a profit or loss of $50.25 (5 pips x $10.05 value per pip) in an hour or two.

Procedure to assess Pip Ranges

  1. Add the ATR indicator to your chart
  2. Set the period to 1
  3. Add a 200-period SMA to this indicator
  4. Shrink the chart so you can assess a large time period
  5. Select your desired timeframe
  6. Measure the floor level and set this value as the min
  7. Measure the level of the 200-period SMA and set this as the average
  8. Measure the peak levels and set this as Max.

EUR/CHF Cost as a Percent of the Trading Range

Apart from assessing your profit and loss, one can find the best time of the day to enter and exit a trade. For this, another table is inserted that represents costs in terms of percentage. And the magnitude of these percentages determines the range of costs on each trade.

ECN Model Account

Spread = 0.9 | Slippage = 2 | Trading fee = 1

Total cost = Slippage + Spread + Trading Fee = 2 + 0.9 + 1 = 3.9

STP Model Account

Spread = 1.6 | Slippage = 2 | Trading fee = 0

Total cost = Slippage + Spread + Trading Fee = 2 + 1.6 + 0 = 3.6

Comprehending ‘Cost as a percentage of trading range’

Note that the mentioned percentages are a unitless quantity, and we consider only the magnitude of it. If the percentage value is high, then the costs are high. If they’re low, the costs are low too. Relating it to volatility, if the volatility is high, the costs are low and vice versa.

The Ideal way to trade the EUR/CHF

Now that we’ve comprehended what the cost percentages mean, let us determine the best times to trade the EURCHF currency pair. The minimum column of the table has the highest percentages, while the max column has the lowest percentages for each timeframe. It is neither ideal to trade when the volatility is high & costs are low nor when the volatility is low, and the costs are high. The only option left is the average column. The average column consists of the median values for both volatility and costs. Hence, this becomes the most suitable time to enter into this currency pair for trading.

Limit orders and their benefits

Traders usually enter and exit trades using market orders. This is the sole reason for slippage to take place. This has a significant weight on the cost of the trade. However, placing a limit order instead will nullify the slippage on the trade.

The difference in the ‘costs as a percentage of trading range’ when the slippage is made nil is illustrated below.

Categories
Forex Market Analysis

Daily: Trade War Continues; Poor US Retail Sales Data; Sterling Hitting Highs Fueled by Carney’s Remarks


NEWS COMMENTARY


Trade war

Trade talk efforts between the U.S. and China cooled after U.S. President Donald Trump suggested that he was “under no pressure to make a deal with China, they are under pressure to make a deal with us”, Beijing was quick to shrug off the claim.

“The Trump administration should not be mistaken that China will surrender to the U.S. demands,” state run China Daily published on Friday.

“It has enough fuel to drive its economy even if a trade war is prolonged,” the paper insisted.


Retail sales data

Coming after Thursday’s weaker-than-expected inflation data, shopping takes the spotlight in economic indicators with numbers on retail sales and consumer sentiment arrived soft as well, as retail sales came 0.1% under expectations of 0.4%,  with core retail sales followed it to 0.3% less than forecast 0.5%. Increasing concerns that the Federal Reserve could ease its monetary policy.


Surging sterling

The pound hit a six-week high against the dollar on Friday as Bank of England governor Mark Carney reportedly warned that a no deal Brexit would likely mean higher interest rates.

Carney warned that if the UK and European Union were unable to forge trade deals that the result could be as bad as the 2008 financial crisis, driving the pound lower. The corresponding increase in inflation would likely require the BoE to tighten policy.

Oil

Oil prices recovered on Friday from the prior session’s sharp decline and remained on track for solid weekly gains as investors looked ahead to the latest gauge of U.S. production.

Both barrels were still on track for weekly gains of 1.8% and 2.0%, respectively, as traders await the latest data on U.S. crude production from Baker Hughes.

The U.S. rig count, an early indicator of future output, rose by 2 to 862 last week, hovering near its highest levels since March 2015.


CHART ANALYSIS


DAX

On the daily chart, we can see that the price had a bearish rally for the past six weeks until it reached the key support zone of 11900.8-11742.4

It’s also the lower side of the descending channel along with 88.6% Fibonacci

The price is technically expected to have its way up back again to the key resistance level 12582.46 which is the top of descending channel and the broken ascending trend


OIL

On the daily chart, the price is moving sideways between the support area 66.2-64.15 and the resistance area 74.45-72.45

After breaking the ascending trend, the price turned back to this support zone with bounce from an ascending trend as shown

The price now is retesting this zone with price action “pin bar”, to have a bullish movement again

So, it’s expected to go up to the resistance zone of 72.45-74.45
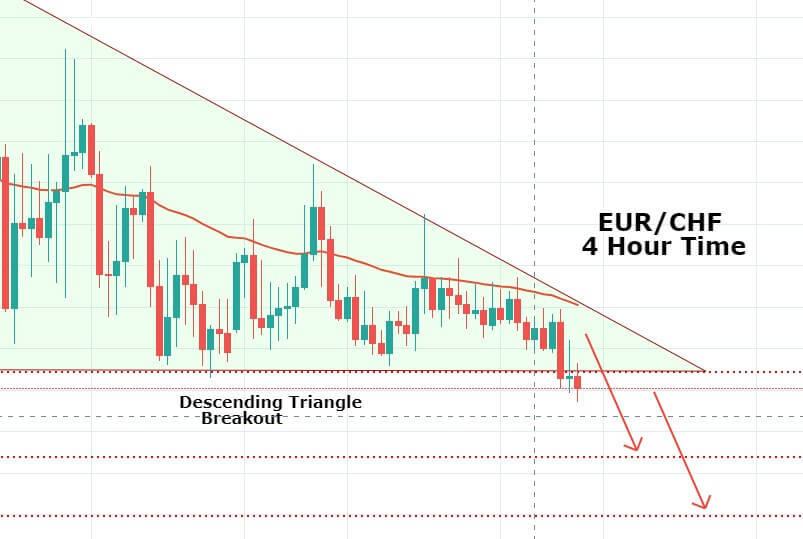

EUR/CHF

On the daily chart, the price is facing a punch of support levels that would it hike again due to:

firstly the key support zone 1.127-1.119, secondly the reversal pattern “wedge”, third the AB=CD harmonic pattern, and finally the divergence on RSI

the price is supposed to meet its first target at 1.1435


GBP/CHF

On the daily chart, the price had bounced from the key support level at 1.247 with engulfing price action, to reach the dash resistance level at 1.271 to retrace from it to 1.2595

the price is about to shape the second shoulder of the H&S reversal pattern, it will be assured if the price breaks through 1.271

followed by divergence on RSI, the price is expected to reach the resistance level 1.285 where to meet the upper edge of the descending channel


Categories
Forex Market Analysis

Forex and Indices – Daily Update – 24.07.18


Fundamental Overview


Mixed data of preliminary PMI in the Eurozone.

The Flash Purchase Managers Index (PMI) data in July show signs that this third quarter for the eurozone has begun to lose the buoyant momentum that registered during the first half of the year. Manufacturing PMI modestly reached 55.1 points, slightly higher than the 54.9 points reached in June. In the opposite side, Services PMI index fell to 54.4 points from the 55.2 points reported in June. The slowdown in growth momentum suggests that similar levels could be seen in August.


source: tradingeconomics.com

The main cause of this deceleration could be attributed to the fuels price increase of oil as well as the increase in tariffs on steel and aluminium.


source: tradingeconomics.com


Forex and Indices Technical Analysis


EURUSD

The EURUSD in 30-minutes chart continues consolidating. The price is moving above the weekly pivot suggesting a bullish pressure for the pair. Long positions should be considered if the price breaks above 1.1710, with a potential profit target placed at 1.1775. Short positions should be valued if the pair breaks down 1.1667 with a profit target at 1.1615


GBPUSD

The GBPUSD in the 30-minutes chart is consolidating the Friday 20th rally. For long positions, the price must break above 1.3137 with a potential profit target at 1.3208. Short positions should be considered if the price breaks under 1.3085 with a potential target at 1.3022.


USDCHF

The pair USDCHF in the 30-minutes chart is developing a bullish retrace of the previous sell-off. For bullish positions, the next resistance is 0.996; for bearish continuation, the critical support to break down is 0.9922, and the potential profit target is at 0.9887.


EURCHF

The EURCHF cross in the 30-minutes chart is testing resistance with the 200-period moving average which is converging with the first daily resistance. For long positions, we need to see the breakout of the 1.1629 level with a potential target at 1.165 (Weekly Pivot Zone). In the bearish side, the price should break under 1.1603 level, with a potential profit target at 1.1582.


GBPCHF

The GBPCHF cross is turning bullish after the 1.3049 level breakout. Long positions have the potential target at 1.3117, coinciding with the third daily resistance. On the short side, the price should break down 1.3001 level, with a potential target at 1.2965 level.


FTSE 100

FTSE 100 in the 30-minutes chart shows that the price is moving above 24 and 200 moving average. Also, the British index has bounced from the weekly pivot level, the next resistance es at 7,728. For bullish continuation, the next target is 7,786 pts, which is the convergence between the second weekly resistance level and the third daily resistance.


DAX 30

DAX 30 in the 30 minutes chart shows that the price has surpassed the third daily resistance without to make a reversal move to the daily pivot level, it suggests that the German index should continue with the bullish bias with a target placed at 12,855 pts (previous resistances confluence area.)


Check out Forex and Indices technical analysis for July 16, 2018.

Categories
Forex Market Analysis

U.S. Inflation Grows Firmly In June – Forex and Daily Update – 12.07.18


Fundamental Overview


U.S. inflation grows firmly in June.

Forex Trading Signals: The Consumer Price Index (YoY) in the United States in June reached the highest level in 6 years, climbing to 2.9% from the 2.8% reported in May. According to what was stated by the U.S. Bureau of Labor Statistics, the CPI in June increased driven by the food index, which advanced 0.2 per cent; and the gasoline index, which grew by 0.5 per cent. Despite this increase, the energy index decreased 0.3 per cent, mainly due to the Energy Services index, which fell 1.5 per cent in June.

Forex trading signals Source: Forex Trading Signals – Forex.Academy Collection


Technical Overview


EURUSD

The EURUSD 2-hour chart is showing bullish signals due to the price making higher highs and higher lows. Currently, the common currency is making a retrace to the green box, from where we expect new upsides to the 1.19067 area, completing a major degree connector. Invalidation level is 1.15080.


GBPUSD

The GBPUSD 2-hour chart is making a new bearish leg after the upward sequence in 5 moves started on June 28th. We expect a continuation of the previous bullish cycle from the zone between 1.3181 to 1.3099 with a target placed on 1.3475 area from where the pound should decide the next moves. Invalidation level of the bullish cycle is at 1.30494.


USDCHF

The USDCHF 2-hour chart is making a breakout of the consolidation range which is developing from the first half of June. The RSI oscillator shows that price has a bullish bias. In the short-term, we expect a limited retrace to incorporate to the bullish long-term trend. The invalidation area is 0.98579.


EURCHF

The EURCHF cross in the 2-hour chart is moving bullish after the breakout above 1.1565 level. We expect more upsides which could drive the cross to the targets at 1.1768 in the short-term, and 1.19475 in the long-term. Invalidation level is 1.14799.


GBPCHF

The GBPCHF cross has broken up the psychological 1.32 resistance. We expect a retrace to the area between 1.319 until 1.31057, from where the price should continue rising to 1.3312 level in the short-term and the 1.3442 level in the mid-term. Invalidation level is 1.3023.


FTSE 100

FTSE 100 in the 2-hour chart continues moving sideways in a complex corrective structure, but the main trend is bullish. We expect a limited upside to 7,792 level, from where we should wait for a new connector completion. Invalidation level is 7,508.


DAX 30

The DAX 30 is bouncing from the Potential Buy Zone (green box), from where we expect an upward movement to the area between 12,695 to 12,742. If DAX climbs above 12,807 pts, the German index could reach and test the 13,020 level resistance. Invalidation level is 12,104.


Categories
Forex Market Analysis

Forex and Indices – Daily Update – 29.06.18


Fundamental Overview


“Green sprout” in New Zealand?

Forex Market Update: The increase in building consents in New Zealand which reached 3,407 permits in May, the highest level reached since June 2004, represents 7.1% after the fall of 3.6% registered in April. Will this be a green outbreak of improvement in New Zealand’s macroeconomic conditions or will it be only an isolated effect?


Forex Market UpdateSource: Forex.Academy Collection – Forex Market Update


Technical Analysis


EURUSD

The pair is moving in a bearish wedge pattern which could drive to the price to a new lower low ending the bearish cycle near to the 1.145 zone coinciding with the lower trendline of the bearish wedge. Invalidation level of the downward cycle is at 1.18523.


GBPUSD

GBPUSD is moving in a bearish wedge in the same way as the EURUSD. We expect a spike to the PRZ before it makes a reversal move, maybe in the next week. A key level to watch out for is 1.30 as a psychological level. Invalidation level of the bearish cycle is at 1.34725.


USDCHF

The Swiss currency is moving in a triangulation structure which represents a continuation of the previous bullish move. However, as an inverse correlation with EURUSD, the movement could be a false breakout as a bull trap. In this pair, we will maintain in a neutral position before taking a position in the market.


EURCHF

The EURCHF cross is turning bullish after the breakout above the 1.1565 level, a throwback to this level could drive the cross to the 1.1772 short-term targets. RSI is supporting this scenario with the upward trendline.


GBPCHF

The GBPCHF 2-hour chart shows the importance of the invalidation level of a proposed scenario and its ex-post analysis. In this cross, we expected a limited retrace to the area between 1.3124 and 1.3089 for an upward move, with the profit target in the area between 1.3323 and 1.3374. However, after the retrace to the blue box, the GBPCHF cross continued falling. Watching the AO oscillator between May 18th and June 1st, we can appreciate that the bearish move corresponds to a bearish wave 3, then the retrace analysed is a wave 4. In consequence, the final movement as a bearish wedge pattern, which should end the bearish cycle.


FTSE 100

The FTSE 100 is moving sideways with a bearish bias which is correcting the previous rally realised from March to May. Despite the bearish bias of global indices, we prefer to avoid the short positions expecting the timing for entry in the bullish side.


DAX 30

In the Thursday 28th trading session, DAX 30 fell to the control level finding support to the corrective move. Now we expect consolidation on the 12,100 pts from where the German Index could start a new bullish cycle.