Categories
Forex Course

200. The Correlation Between USD/CAD Pair & Crude Oil

Introduction

Crude oil, also known as black gold, is the major energy source that runs the economy. Canada is among the top oil producers in the world. It is one of the major oil exporters to the USA. Canada exports more than 3 million barrels of petroleum and oil products, a figure that is sufficient to impact USD/CAD’s movement.

USD/CAD and Crude Oil – The Correlation

The volume of crude oil that Canada exports to the US generate massive demand for the CAD. Moreover, Canada’s economy depends a lot on its exports, and approximately 85% of the country’s exports go to the US.

Therefore, the value of USD/CAD is significantly impacted by how the consumers in the United States reach oil prices. If the US’s demand increases, manufacturers have to order more oil to cater to the rising demand. This can result in rising oil prices, thereby resulting in reducing the value of USD/CAD.

Conversely, if the US’s demand falls, the manufacturer will not need to order in more oil to make goods. Subsequently, the oil prices might fall, which would be bad from the CAD value. So essentially, USD/CAD has a negative correlation.

It’s all about Supply and Demand

Supply and demand are the prominent influencers of the correlation between USD/CAD and crude oil, impacting the demand and supply of US dollars and Canadian dollars.

Export of cruise oil covers a significant percentage of the US currency acquired by Canada. This means that a shift in the price and volume of crude oil will have a considerable impact on the flow of the Greenback into the Canadian dollar.

Furthermore, high crude oil prices also imply a higher flow of USD into Canada due to its exports. This implies that there will be a strong supply of the USD into the Canadian dollar, thereby increasing the value of the Canadian dollar.

Similarly, when the crude price falls, the US dollar supply will be lowered as opposed to the Canadian dollar, leading to a decreasing value of the Canadian dollar.

[wp_quiz id=”97486″]
Categories
Forex Videos

The Information On Oil You Need To Know! WTF!

What’s happening with oil prices?


Crude oil, which is sold by the barrel in the future’s market where buyers take delivery on a monthly basis, reached a peak of $65 per barrel just a few weeks ago.


The May contract, which expires today 21st of April 2020, had been hovering around the $20 per barrel level yesterday for one of the producers, West Texas Intermediate, or WTI. However, it became increasingly apparent that buyers for this contract were hard to come by because of a lack of storage facilities. And when the Chicago Mercantile Exchange or CME issued a warning statement yesterday that it was possible for oil prices to go into negative territory, it sent a shock through the oil markets.
While producers remained extremely eager to sell and buyers were left standing on the sidelines, and with just hours remaining until the May contract expired, panic selling set in and, as we can see on the graph, the price of a barrel of WTI, fell through zero into minus territory. And where this had happened for only the first time in the history of the crude oil market.


We can also see on the chart that the price did recover some upside to just over $1 per barrel, but where it currently hovers slightly underneath zero at around – $2 per barrel at the moment. This price action in crude oil is unprecedented, and, as I mentioned previously, has never happened before. So what exactly is going on, and what does this tell us about the oil and financial markets in general?

First, we need to take a step back just a few short weeks ago when the world was hit by the Covid-19 pandemic. People all over the world remain in lockdown, businesses are closed, the airline industry has almost flatlined, cars are off the road because nobody is going anywhere. And every one of these sectors uses by-products of oil in the form of petrol, diesel, gasoline, jet fuel, cooking oils, lubricants, plastics, etc. Springtime has hit the west, and with the warmer weather, we need less heating oil.
An old adage springs to mind, and has never been more appropriate: supply and demand: we have too much supply and too little demand. I think it’s safe to say that we just don’t need oil right now.

Storage facilities, including Cushing in Oklahoma in the United States, are at almost 80% capacity of barrels of oil, which are only trickling out to refineries, which are also busting to overflow with the by-products that they have produced including petrol and diesel, etc.
All the time I’m big oil-producing countries such as Saudi Arabia and Russia, the USA and others keep pumping out oil, in defiance of nations asking them to ease production and where the governing body, OPEC, seems not to have enough clout to force countries such as the belligerent Russia to do so.

However, when prices of oil go into negative territory, which many of us have never even considered before, a sudden realization occurs, that producers of oil, which falls into negative pricing during a futures contract, are forced to pay buyers to take oil off of their hands at the market rate. This will be extremely painful for oil producers, who are producing a product which they cannot store because of a lack of storage facilities, and where they are hiring – at great expense – barges, and cargo ships and huge tankers, many of which are languishing in ports and offshore while waiting to go into ports to be

offloaded, and which becomes a further expense to producers. Surely now the writing’s on the wall, and that the longer this pandemic goes on, the less oil we are going to need, and therefore we should expect production to fall even further.
But is there an underline message here? Well yes, this kind of unprecedented crash in a major financial sector, albeit a blip, will send out warning signs to investors that the financial markets remain extremely unstable during the virus pandemic, and that the longer this goes on for we should expect volatility to spill over into other markets such as stocks, currencies – and especially where those countries are producers and exporters of oil, is the United States, Canada, Russia Saudi Arabia, and oil, and of course markets will be keeping a close eye on future oil contract expires.

Categories
Forex Market Analysis

Daily: New Episode of Trade War, Brexit Negotiations, U.S & South Korean Summit


NEWS COMMENTARY


U.S. President Donald Trump and South Korean leader Moon Jae-in will meet in New York on Monday to discuss how to move forward on a formal declaration of the end of the Korean War. Moon met with North Korean leader Kim Jong Un last week. “Chairman Kim expressed his wish to finish complete denuclearization at an early date and focus on economic development,” Moon said of his meeting with the North Korean leader in Pyongyang.

The Organization of the Petroleum Exporting Countries and Russia pushed back against a call last week by U.S. President Donald Trump to lower prices. “I do not influence prices,” Saudi Energy Minister Khalid al-Falih told reporters as OPEC and non-OPEC energy ministers gathered in Algiers. The group of oil producers is in discussion about rising output to counter falling Iranian supplies due to U.S. sanctions but made no formal recommendation for any additional supply boost at its Sunday meeting.

British Prime Minister Theresa May is under attack from several fronts over her Brexit plan. Members of her own party launched an alternative plan for leaving the European Union which would involve ditching her Chequers deal for a cleaner break with the bloc. The main opposition Labour Party are holding their annual conference where members will decide on whether to back a second referendum on the issue. There were also reports over the weekend of a possible snap election in November. Relations with the EU side, meanwhile, continue to be strained.


CHART ANALYSIS


OIL

Last week price continued its ranging move between support at 66.2-64.15 and resistance at 74.45-72.45. After having breached the ascending trend, price turned back to the support zone with a bounce from an ascending trend as shown on the daily chart below. As we expected, price is now “pin bar” reaching the main resistance zone with touching 72.45, we expect bullish momentum to build up towards the 74.45 level. and then wait for a bounce or a break to determine the next move


S&P 500

On the daily chart, the price has broken the key resistance level at 2875.58 and stayed above it to reinforce the bullish bias.

However, we should highlight significant reversal signs, including:

1. Elliot’s Wave 5 has formed;
2. AB=CD harmonic pattern in play.
3. A Wedge reversal pattern remains active.
4. RSI Divergence.

Thus, if price breaks through support at 2875.58 we should witness a correction towards 2797.82.


AUD/USD

On the daily chart, the Aussie is clearly reflecting a bearish bias as it descends down a channel that started forming since the beginning of this year; reaching support at 0.71 where some clear sign of reversal showed up.

We expect reversal/consolidation to develop further as:

1. Price has bounced from the support zone between 0.71-0.716.
2. An AB=CD harmonic pattern is rather suggestive.
3. A Wedge reversal pattern.
4. RSI divergence.

the price manages to stay above 0.7225,then it has the potential of reaching 0.733 and 0.745


USD/CAD

On the daily chart, we observe the Loonie to follow a descending channel since June this year, with a false 2 weeks reversal before continuing its way down.

As we expected before that the price fell further to 1.289 and meet the ascending trend line from March’s Low, coupled with the 200 Exponential Moving Average (EMA)

Now the price located at the key support of 1.289 besides the ascending trend line from the low of 2017. so, any bounce here would expose the price back to 1.312. and any break beneath these levels would continue the bearish bias to 1.272


USD/JPY

On the daily chart, as expected, price is moving upwards to the 113 target, leaving 112 as near-term support. We expect an extension towards the 113 area before resumption of the downside towards at least 109,75.


Categories
Forex Market Analysis

Weekly: Trade Tensions Continue; Italy “Crisis”; No Brexit Deal; FED to Raise Rates


NEWS COMMENTARY


US

Bets on Fed fund futures suggest that traders have already priced in the near-certainty of the next rate hike to occur this coming week. Yet the dollar reversed course, after last week posting the second trough in a descending peak-trough succession.

Also in the U.S., traders will get the opportunity to react to the latest data on consumer confidence, durable goods and gross domestic product.

OIL

A steady rise in U.S. oil output will gather pace in the next five years, OPEC said on Sunday, predicting that demand for the producer group’s crude will decline despite a growing appetite for energy fed by global economic expansion.

“Declining demand for OPEC crude is a result of strong non-OPEC supply in the 2017–2023 period, most notably from U.S. tight oil,” the Organization of the Petroleum Exporting Countries said in its long-term world oil outlook.

“The U.S. remains by far the most important source of medium-term supply growth, contributing … two-thirds of new supply, driven by surging tight oil output,” it said


EUR & GBP

The near term drag for the  single currency continues to be around the Italian debt. Recently, on August 31 to be more precise, the 2-year yield gilt on Italian bonds was as high as 1.465%, before plummeting to 0.63% after the presentation of the Italian budget prospect. It’s of no coincidence that the Euro rally in September coincided with a reduction of perceived short-term sovereign credit risk around Italy. If concerns around Italy are going to impact the Euro, it will be via another rise in short-term yields. We believe that there is no such a thing as a “crisis” surrounding Italian Credit’s situation; however, “news” do have the potential to print short-lived volatility to the markets.

The return of ‘hard Brexit’ fears resulting from the “surprisingly” fractious Salzburg summit obviously hit the British Pound hard at the end of the week. After Teresa May suggested that there would be a no deal Brexit, which of course causes a lot of fear. She stated that there are still a couple of points in the negotiation that divide the UK and the EU, but the spillover impact to the Euro was apparent as well. If odds of a disruptive exit from the EU increase, the uncertainty surrounding the impact to trade could be enough of a reason for the European Central Bank to eventually delay its monetary policy timeline for late next year.


AUD & NZD

While an easing of trade tensions between the United States and China may have been the catalysts behind last week’s rally in the Aussie and Kiwi, the possibility of renewed concerns could take the currencies lower early this week. This is because late Friday, China announced it was cancelling its meeting with the U.S., and wouldn’t resume negotiations until after the November U.S. mid-term elections.

The Australian Dollar, a proxy of China-related trades as well as gauge of risk sentiment, climbed to a three-week high last week. It also produced its biggest weekly advance in 14 months. Additionally, S&P Global Ratings revised its outlook on triple-A rated Australia to stable from negative on Friday, providing the Aussie with a further lift.

In its monetary policy minutes, the Reserve Bank of Australia (RBA) warned on risks to its outlook from U.S.-China trade tensions and weak wages, while reaffirming its next interest rate move would likely be a hike.

The RBA also said “Significant tensions” around trade policy are a “material risk” to the global outlook. Unemployment is expected to decline gradually toward 5 percent and wage growth is expected to increase gradually as spare capacity in the labor market is absorbed.

Although the Fed is widely expected to raise its benchmark interest rate on its next meeting, Australian and New Zealand Dollar traders will be primarily focused on the direction the Fed will chart ahead. Traders essentially want to know how aggressive the Fed will be in increasing rates in the future.

The 25-basis point increase to the federal funds rate is already priced into the market. The hike will push the funds target to 2 percent to 2.25 percent, where it last was more than 10 years ago.

Since the rate hike has already been factored into the dollar and the currencies, traders will be paying more attention to any information that shows how much more monetary tightening will be necessary to keep the economy (and inflation) healthy.

In New Zealand, the focus will be on business confidence and the interest rate and monetary policy decisions by the Reserve Bank of New Zealand (RBNZ). The Reserve Bank is widely expected to leave its benchmark interest rate at 1.75%.


CHART ANALYSIS


OIL

Last week price continued its ranging move between support at 66.2-64.15 and resistance at 74.45-72.45. After having breached the ascending trend, price turned back to the support zone with a bounce from an ascending trend as shown on the daily chart below. Price is now “pin bar” retesting this zone, as we expect bullish momentum to build up towards the 72.45-74.45 level.


S&P 500

On the daily chart, the price has broken the key resistance level at 2875.58 and stayed above it to reinforce the bullish bias.

However, we should highlight significant reversal signs, including:

1. Elliot’s Wave 5 has formed;
2. AB=CD harmonic pattern in play.
3. A Wedge reversal pattern remains active.
4. RSI Divergence.

Thus, if price breaks through support at 2875.58 we should witness a correction towards 2797.82.


AUD/USD

On the daily chart, the Aussie is clearly reflecting a bearish bias as it descends down a channel that started forming since the beginning of this year; reaching support at 0.71 where some clear sign of reversal showed up.

We expect reversal/consolidation to develop further as:

1. Price has bounced from the support zone between 0.71-0.716.
2. An AB=CD harmonic pattern is rather suggestive.
3. A Wedge reversal pattern.
4. RSI divergence.

the price manages to stay above 0.7225,then it has the potential of reaching 0.733 and 0.745


USD/CAD

On the daily chart, we observe the Loonie to follow a descending channel since June this year, with a false 2 weeks reversal before continuing its way down.

As we expected before that the price fell further to 1.289 and meet the ascending trend line from March’s Low, coupled with the 200 Exponential Moving Average (EMA)

Now the price located at the key support of 1.289 besides the ascending trend line from the low of 2017. so, any bounce here would expose the price back to 1.312. and any break beneath these levels would continue the bearish bias to 1.272


USD/JPY

On the daily chart, as expected, price is moving upwards to the 113 target, leaving 112 as near-term support. We expect an extension towards the 113 area before resumption of the downside towards at least 109,75.


Categories
Forex Market Analysis

Daily: Trade War Fears Fading; Strong Kiwi on NZ GDP Increase; U.K Retail Sales Printing Upward Momentum on the Pound


NEWS COMMENTARY


Markets extended their rally on Thursday as U.S.-China trade war fears were set aside and investors focused on bullish macroeconomic and corporate news.

Global markets appear to be shrugging off concerns over an escalating trade war between the U.S. and China

The British Pound got a strong boost following the surprisingly positive UK monthly retail sales figures, coming in to show 0.3% m/m growth in August as against a contraction of 0.2% anticipated. This coupled with some optimistic Brexit comments by the European Commission President Juncker and Irish Foreign Minister Simon Coveney remained supportive of the strong bid surrounding the cross.

In Europe, attention will be focused on an informal summit of European Union leaders in Austria on Thursday. Brexit and immigration are set to be the main points of discussion. U.K. Prime Minister Theresa May, under pressure at home and abroad to achieve a workable Brexit deal, has called for “goodwill” and flexibility from her EU counterparts. The future of the Irish/Northern Irish border remains a stumbling block in talks.

The New Zealand dollar jumped to three-week highs after strong domestic GDP data showed the country’s economy grew at the fastest pace in two years in the second quarter.

The Swiss National Bank (SNB) is maintaining its expansionary monetary policy, thereby stabilising price developments and supporting economic activity. Interest on sight deposits at the SNB remains at –0.75% and the target range for the three-month Libor is unchanged at between –1.25% and –0.25%. The SNB will remain active in the foreign exchange market as necessary, while taking the overall currency situation into consideration. Since the monetary policy assessment of June 2018, the Swiss franc has appreciated noticeably, against the major currencies as well as against emerging market currencies. The Swiss franc is highly valued, and the situation on the foreign exchange market is still fragile. The negative interest rate and the SNB’s willingness to intervene in the foreign exchange market as necessary remain essential in order to keep the attractiveness of Swiss franc investments low and thus ease pressure on the currency.


CHART ANALYSIS


OIL

Last week price continued its ranging move between support at 66.2-64.15 and resistance at 74.45-72.45. After having breached the ascending trend, price turned back to the support zone with a bounce from an ascending trend as shown on the daily chart below. Price is now “pin bar” retesting this zone, as we expect bullish momentum to build up towards the 72.45-74.45 level.


S&P 500

On the daily chart, the price has broken the key resistance level at 2875.58 and stayed above it to reinforce the bullish bias.

However, we should highlight significant reversal signs, including:

1. Elliot’s Wave 5 has formed;
2. AB=CD harmonic pattern in play.
3. A Wedge reversal pattern remains active.
4. RSI Divergence.

Thus, if price breaks through support at 2875.58 we should witness a correction towards 2797.82.


AUD/USD

On the daily chart, the Aussie is clearly reflecting a bearish bias as it descends down a channel that started forming since the beginning of this year; reaching support at 0.71 where some clear sign of reversal showed up.

We expect reversal/consolidation to develop further as:

1. Price has bounced from the support zone between 0.71-0.716.
2. An AB=CD harmonic pattern is rather suggestive.
3. A Wedge reversal pattern.
4. RSI divergence.

the price manages to stay above 0.7225,then it has the potential of reaching 0.733 and 0.745


USD/CAD

On the daily chart, we observe the Loonie to follow a descending channel since June this year, with a false 2 weeks reversal before continuing its way down.

We expect price to fall further to 1.289 and meet the ascending trend line from March’s Low, coupled with the 200 Exponential Moving Average (EMA)


USD/CHF

On the 4H chart, price is moving in a broadening wedge while breaking through the continuous Rectangle pattern at 0.9652. A correction has been already made to this level at the descending trend of the wedge. so, any reverse will take the price back to 0.956


USD/JPY

On the daily chart, price is moving upwards to the 113 target, leaving 112 as near-term support. We expect an extension towards the 113 area before resumption of the downside towards at least 109,75.


Categories
Forex Market Analysis

Daily -UK CPI Gives Sterling (short-lived?) Upward Momentum; NAFTA Talks Continues; European Summit Ahead


NEWS COMMENTARY


Trade war

Investors continue expectant on new developments over the U.S.-China trade war after the Trump administration said on Monday it will implement new tariffs of 10% on $200 billion of Chinese products on Sept. 24, with the tariffs to go up to 25% in January. China retaliated by threatening to implement duties on about $60 billion worth U.S. goods, as previously announced; which is lower than expected. Unless new information hits the wires, markets seem to have fully priced in the current status on the Trade War theme.

Housing Data Ahead

The focus on Wednesday’s economic calendar will be on home construction coming 12:30 GMT.

Housing starts are expected to  risen by 5.8% to an annual rate of 1.235 million in August.

OIL

Oil traded slightly lower on Wednesday as stockpile data from the American Petroleum Institute showed a 1.25 million barrels increase in weekly crude inventories.

Traders are waiting for the weekly government data from the Energy Information Administration with expectations for a draw of 2.741 million barrels.

UK CPI

Meanwhile sterling increased after the consumer price index came in 2.7% higher than expected 2.4%, with core CPI 2.1% v. 1.8% forecasted,  which is regarded by market participants as yet another reason for the BoE and its MPC peers to to expand their monetary policy normalization plan further with a new rate increase anytime soon.

Later on, according to Times, UK Prime Minister Theresa May is set to reject the improved offer by Chief EU Negotiator Michel Barnier for a solution on the Irish border.  Maintaining an open border between the Republic of Ireland and Northern Ireland (part of the UK) has been one of the thorniest issues in the Brexit negotiations. This could make the recent Sterling rally fade.

The report from the times comes a short time before European leaders including May convene for an unofficial summit in Salzburg, Austria, with Brexit being high on the agenda.

NAFTA

U.S. Trade Representative Robert Lighthizer and Canadian Foreign Minister Chrystia Freeland will meet later today in Washington as the two countries remain at odds over some key details on a deal. President Donald Trump has warned he would impose tariffs on Canada in the event of no deal being reached, while Congress remains unwilling to approve a Mexico-only pact.


CHART ANALYSIS


OIL

Last week price continued its ranging move between support at 66.2-64.15 and resistance at 74.45-72.45. After having breached the ascending trend, price turned back to the support zone with a bounce from an ascending trend as shown on the daily chart below. Price is now “pin bar” retesting this zone, as we expect bullish momentum to build up towards the 72.45-74.45 level.


S&P 500

On the daily chart, the price has broken the key resistance level at 2875.58 and stayed above it to reinforce the bullish bias.

However, we should highlight significant reversal signs, including:

1. Elliot’s Wave 5 has formed;
2. AB=CD harmonic pattern in play.
3. A Wedge reversal pattern remains active.
4. RSI Divergence.

Thus, if price breaks through support at 2875.58 we should witness a correction towards 2797.82.


AUD/USD

On the daily chart, the Aussie is clearly reflecting a bearish bias as it descends down a channel that started forming since the beginning of this year; reaching support at 0.71 where some clear sign of reversal showed up.

We expect reversal/consolidation to develop further as:

1. Price has bounced from the support zone between 0.71-0.716.
2. An AB=CD harmonic pattern is rather suggestive.
3. A Wedge reversal pattern.
4. RSI divergence.

the price manages to stay above 0.7225,then it has the potential of reaching 0.733 and 0.745


USD/CAD

On the daily chart, we observe the Loonie to follow a descending channel since June this year, with a false 2 weeks reversal before continuing its way down.

We expect price to fall further to 1.289 and meet the ascending trend line from March’s Low, coupled with the 200 Exponential Moving Average (EMA)


USD/CHF

On the 4H chart, price is moving in a broadening wedge while breaking through the continuous Rectangle pattern at 0.9652. A correction has been already made to this level at the descending trend of the wedge. so, any reverse will take the price back to 0.956


USD/JPY

On the daily chart, price is moving upwards to the 113 target, leaving 112 as near-term support. We expect an extension towards the 113 area before resumption of the downside towards at least 109,75.


Categories
Forex Market Analysis

Daily: Trade was Escalates; RBA Gives the Australian Dollar Upwards Momentum


NEWS COMMENTARY


U.S. President Donald Trump announced on Monday that the U.S. will put 10% tariffs on $200 billion in Chinese goods, which will go up to 25% at the end of the year.

Trump added that “if China takes retaliatory action against our farmers or other industries, we will immediately pursue phase three, which is tariffs on approximately $267 billion of additional imports.” “We have been very clear about the type of changes that need to be made, and we have given China every opportunity to treat us more fairly,” he said in the statement. “But, so far, China has been unwilling to change its practices.”


China said on Tuesday that it had no choice but to retaliate against new U.S. trade tariffs, raising the risk that U.S. President Donald Trump could soon impose duties on virtually all of the Chinese goods that America buys. The Chinese commerce ministry’s statement came hours after Trump said he was imposing 10 percent tariffs on about $200 billion worth of imports from China, and threatened duties on about $267 billion more if China retaliated against the U.S. action.

The brief statement gave no details on China’s plans, but Foreign Ministry spokesman Geng Shuang told a news briefing later that the U.S. steps have brought “new uncertainty” to talks between the two countries. “China has always emphasized that the only correct way to resolve the China-U.S. trade issue is via talks and consultations held on an equal, sincere and mutually respectful basis. But at this time, everything the United States does not give the impression of sincerity or goodwill,” he added. Geng said he would not comment on “hypotheticals” such as what measures Beijing might consider apart from tariffs on U.S. products, saying only that details would be released at the appropriate time.

The Aussie rise in today’s session was caused by the upbeat approach used by the RBA in the Minutes published earlier today, i.e., while there was no strong case for near-term adjustment in policy, the next move in the lending rate is more likely to be an increase. Furthermore, despite of persistent risks related to abroad uncertainty and the slow recovery in labor wages, the bank explicitly vowed for a stronger AUD as supportive of domestic growth. However, upward momentum is likely to be temporary due to another key economic indicator, the CPI, which print was also released at -0.6% v.-0.7% and 2.0% prior; which lessens pressure on the RBA to push for a faster monetary policy normalization.


CHART ANALYSIS


OIL

Last week, price continued its ranging move between support at 66.2-64.15 and resistance at 74.45-72.45. After having breached the ascending trend, price turned back to the support zone with a bounce from an ascending trend as shown on the daily chart below. Price is now “pin bar” retesting this zone, as we expect bullish momentum to build up towards the 72.45-74.45 level.


S&P 500

On the daily chart, the price has broken the key resistance level at 2875.58 and stayed above it to reinforce the bullish bias.

However, we should highlight significant reversal signs, including:

1. Elliot’s Wave 5 has formed;
2. AB=CD harmonic pattern in play.
3. A Wedge reversal pattern remains active.
4. RSI Divergence.

Thus, if price breaks through support at 2875.58 we should witness a correction towards 2797.82.


AUD/USD

On the daily chart, the Aussie is clearly reflecting a bearish bias as it descends down a channel that started forming since the beginning of this year; reaching support at 0.71 where some clear sign of reversal showed up.

We expect reversal/consolidation to develop further as:

1. Price has bounced from the support zone between 0.71-0.716.
2. An AB=CD harmonic pattern is rather suggestive.
3. A Wedge reversal pattern.
4. RSI divergence.

Consequently, if the price manages to stay above 0.7225, it has the potential of reaching 0.733 and 0.745.


USD/CAD

On the daily chart, we observe the Loonie to follow a descending channel since June this year, with a false 2 weeks reversal before continuing its way down.

We expect price to fall further to 1.289 and meet the ascending trend line from March’s Low, coupled with the 200 Exponential Moving Average (EMA)


USD/CHF

On the 4H chart, price is moving in a broadening wedge while breaking through the continuous Rectangle pattern at 0.9652. A correction may occur at this level again before digging down to the next support 0.956


USD/JPY

On the daily chart, price is moving upwards to the 113 target, leaving 112 as near-term support. We expect an extension towards the 113 area before resumption of the downside towards at least 109,75.


Categories
Forex Market Analysis

Daily: Markets are Calmed Ahead of a New Fresh Wave of U.S Tariffs


NEWS COMMENTARY


The U.S.-China trade spat will likely remain a key driver of sentiment this week ahead after reports said U.S. President Donald Trump wants to move forward with tariffs on $200 billion in Chinese goods.

U.S.-China trade-war fears have been simmering for months. Neither side is showing any signs of backing off, fueling worries that the world’s two largest economies are spiraling towards a trade war that could shake the global economy.

Besides trade rhetoric, the U.S. will see a relatively quiet week in terms of economic releases, with a report on the housing sector expected to draw the most attention.

The tariff level will probably be about 10%, as the Wall Street Journal reported, quoting people familiar with the matter. This is below the 25% the administration said it was considering for this possible round of tariffs. The decision comes despite a Treasury invitation last week to senior Chinese officials, including Vice Premier Liu He, for further negotiations to reach a calm resolution of this matter. Trump has demanded that China cut its $375 billion trade surplus with the United States, end policies aimed at acquiring U.S. technologies and intellectual property and roll back high-tech industrial subsidies.

On other hand, in spite of disappointing inflation and retail sales data released on Thursday, the USD Index managed to recover some of the lost ground afterwards, closing the previous week with indecisiveness about future moves. However, such a recovery is expected to be short-lived as the underlying economic indicators lack of the strenght to represent any serious impact on monetary policy. In fact, last week we experienced a typical case of market participants using fundamentals as means to print more liquidity and to reposition themselves by given economics a contrarian reading


CHART ANALYSIS


EUR/GBP

On the daily chart, the price was moving strongly in ascending channel towards the key resistance 0.91 then it dropped to 0.8895 due to

1- breaking beneath the channel after completing the wave 5 (Eliot waves)

2- the AB=CD harmonic pattern

3- the overbought on RSI

The price is about to reach 0.8845 where the descending trend and moving average 200 collide

Then, it may retrace to the resistance 0.9025 before heading the C wave target at 0.873


GBP/CAD

On the daily chart, the pair has reached decisive resistance levels, as the zone 1.7165-1.7065 pushed the price lower along with the upper side of the descending channel from the high of 2018

An AB=CD harmonic pattern has been completed as the price stopped at the B level which is located at the same zone spot

An ascending channel had been formed as a reversal flag besides a divergence on RSI to reinforce the bearish bias to the support 1.657


Categories
Forex Market Analysis

Daily: Trade War Continues; Poor US Retail Sales Data; Sterling Hitting Highs Fueled by Carney’s Remarks


NEWS COMMENTARY


Trade war

Trade talk efforts between the U.S. and China cooled after U.S. President Donald Trump suggested that he was “under no pressure to make a deal with China, they are under pressure to make a deal with us”, Beijing was quick to shrug off the claim.

“The Trump administration should not be mistaken that China will surrender to the U.S. demands,” state run China Daily published on Friday.

“It has enough fuel to drive its economy even if a trade war is prolonged,” the paper insisted.


Retail sales data

Coming after Thursday’s weaker-than-expected inflation data, shopping takes the spotlight in economic indicators with numbers on retail sales and consumer sentiment arrived soft as well, as retail sales came 0.1% under expectations of 0.4%,  with core retail sales followed it to 0.3% less than forecast 0.5%. Increasing concerns that the Federal Reserve could ease its monetary policy.


Surging sterling

The pound hit a six-week high against the dollar on Friday as Bank of England governor Mark Carney reportedly warned that a no deal Brexit would likely mean higher interest rates.

Carney warned that if the UK and European Union were unable to forge trade deals that the result could be as bad as the 2008 financial crisis, driving the pound lower. The corresponding increase in inflation would likely require the BoE to tighten policy.

Oil

Oil prices recovered on Friday from the prior session’s sharp decline and remained on track for solid weekly gains as investors looked ahead to the latest gauge of U.S. production.

Both barrels were still on track for weekly gains of 1.8% and 2.0%, respectively, as traders await the latest data on U.S. crude production from Baker Hughes.

The U.S. rig count, an early indicator of future output, rose by 2 to 862 last week, hovering near its highest levels since March 2015.


CHART ANALYSIS


DAX

On the daily chart, we can see that the price had a bearish rally for the past six weeks until it reached the key support zone of 11900.8-11742.4

It’s also the lower side of the descending channel along with 88.6% Fibonacci

The price is technically expected to have its way up back again to the key resistance level 12582.46 which is the top of descending channel and the broken ascending trend


OIL

On the daily chart, the price is moving sideways between the support area 66.2-64.15 and the resistance area 74.45-72.45

After breaking the ascending trend, the price turned back to this support zone with bounce from an ascending trend as shown

The price now is retesting this zone with price action “pin bar”, to have a bullish movement again

So, it’s expected to go up to the resistance zone of 72.45-74.45


EUR/CHF

On the daily chart, the price is facing a punch of support levels that would it hike again due to:

firstly the key support zone 1.127-1.119, secondly the reversal pattern “wedge”, third the AB=CD harmonic pattern, and finally the divergence on RSI

the price is supposed to meet its first target at 1.1435


GBP/CHF

On the daily chart, the price had bounced from the key support level at 1.247 with engulfing price action, to reach the dash resistance level at 1.271 to retrace from it to 1.2595

the price is about to shape the second shoulder of the H&S reversal pattern, it will be assured if the price breaks through 1.271

followed by divergence on RSI, the price is expected to reach the resistance level 1.285 where to meet the upper edge of the descending channel


Categories
Forex Market Analysis

Daily: busy day of ECB, BoE, and US CPI


NEWS COMMENTARY


It’s a busy day with two central banks meetings along with the US consumer price index

But as always, starting with the trade war the major issue that moves the markets, China accepted an invitation by the United States to hold a new round of trade talks, raising hopes for a deal easing the tariff war between the world’s two biggest economies.

Chinese Foreign Ministry spokesman Geng Shuang said earlier that Beijing had received the invitation and welcomed it, adding that the two countries were in discussion about the details.

The Trump administration had invited Chinese officials to restart trade negotiations

This comes after President Donald Trump warned last week that there could more trade tariffs against Beijing totaling $267 billion, on top the already $200 billion in tariffs previously announced.


US consumer price is expected to have risen 0.3% last month and 2.8% over the prior year, according to estimates.

The U.S. central bank is widely expected to raise interest rates at its September meeting, but odds for another move in December have decreased in recent days.


The European Central Bank is all but certain to keep interest rates at their current record low levels, making only nuanced changes to its guidance to stay on course to end bond purchases this year and raise interest rates next autumn.

With Thursday’s decision, the ECB’s deposit rate, currently its primary interest rate tool, will remain at -0.40% while the main refinancing rate, which determines the cost of credit in the economy, will remain at 0.0%.


The Bank of England is also expected to hold fire after raising interest rates last month. If all goes as expected, the British central bank will keep rates at 0.75%

Investors will look closely at the breakdown of votes on the nine-member Monetary Policy Committee for further indications on the timing of the next rate increase.

Comments regarding the ongoing Brexit negotiations will also be in focus.

Expectations of another BoE rate hike are only seen in the second half of next year, given Britain’s plans to leave the European Union in March.


Positive data came from the Australian employment change which hiked up to 44.0K higher than expected 16.5K


CHART ANALYSIS


DAX

On the daily chart, we can see that the price had a bearish rally for the past six weeks until it reached the key support zone of 11900.8-11742.4

It’s also the lower side of the descending channel along with 88.6% Fibonacci

The price is technically expected to have its way up back again to the key resistance level 12582.46 which is the top of descending channel and the broken ascending trend


OIL

On the daily chart, the price is moving sideways between the support area 66.2-64.15 and the resistance area 74.45-72.45

After breaking the ascending trend, the price turned back to this support zone with bounce from an ascending trend as shown

The price now is retesting this zone with price action “pin bar”, to have a bullish movement again

So, it’s expected to go up to the resistance zone of 72.45-74.45


NZDJPY

On the daily chart, the pair is facing a punch of support levels

Firstly the key support zone 72.65-72.35, secondly the down side of the descending channel, third the AB=CD harmonic pattern, forth the double bottom reversal pattern, and finally the divergence on RSI

So, the price is supposed to get back up again to the resistance 74.01


CADCHF

On the daily chart, the pair is facing a punch of support levels

Firstly the key support level of 0.732, secondly the ascending trend from the low of 2016, third the Gartley harmonic pattern, forth the wedge reversal pattern, and finally the oversold on RSI

So, the price is supposed to get back up again to the resistance 0.762


Categories
Forex Market Analysis

Daily Review -US-EU Negotiations, Brexit Deal, UK Wages Hike, NAFTA Discussions


NEWS COMMENTARY


Markets stalled on Tuesday as uncertainty over a trade dispute between Washington and Beijing kept investors on edge.

U.S. President Donald Trump wants to impose tariffs on almost all imported Chinese goods .China’s foreign ministry said on Monday that it would respond to any new steps on trade.

.


US Trade Representative Robert Lighthizer just finished a meeting with European Trade Commissioner Cecilia Malmstrom in Brussels yesterday. Malmstrom said in a tweet that “Lighthizer discussed how the EU-US achieves concrete results in the short to medium term towards a free trade agreement.” And they’ll meet again at the end of September.

Lighthizer’s office described the talks as constructive. Also, work would be done in October to identify tariff and non-tariff barriers that could be cut. And trade chiefs of EU and US will follow up in November to finalize certain results.

However, a deal is not likely to be reached as soon as the White House administration would like


The euro rose on Tuesday as easing concerns about Italian debt boosted the single currency for a second day,

The euro was strengthened by a fall in Italian government borrowing costs this week after Economy Minister Giovanni Tria on Monday predicted yields would drop as the government lays out its much-anticipated budget for 2019


More upbeat talk from the EU negotiator sent sterling higher


Barnier said in a forum in Slovenia that “if we are realistic we are able to reach an agreement on the first stage of the negotiation, which is the Brexit treaty, within 6 or 8 weeks.” And, “taking into account the time necessary for the ratification process, the House of Commons on one side, the European Parliament and the Council on the other side … we must reach an agreement before the beginning of November. I think it is possible.”

What enhances the pound further that wages came strong at 2.6% higher than expected 2.4%, so it would be a confidence builder for pound longs


Canada and the US will restart high-level trade talks in Washington today. Whether it’s still NAFTA or not, the two sides reached a deadlock in three key issues, Canadian dairy market access, cultural exemption for Canada and Chapter 19 dispute resolution mechanism. Not much news is released regarding the discussions as both sides agreed not to negotiate in public.

Canadian Prime Minister Justin Trudeau just reiterated yesterday that “we continue to work hard and we are positively optimistic that we can get a win-win-win for all three countries.” Foreign Minister Chrystia Freeland, who’ll be in Washington today, said last week that the negotiation has entered into a “very intense phase” and the officials have been working 24-7.


CHART ANALYSIS


DAX

On the daily chart, we can see that the price had a bearish rally for the past six weeks until it reached the key support zone of 11900.8-11742.4

It’s also the lower side of the descending channel along with 88.6% Fibonacci

The price is technically expected to have its way up back again to the key resistance level 12582.46 which is the top of descending channel and the broken ascending trend


OIL

On the daily chart, the price is moving sideways between the support area 66.2-64.15 and the resistance area 74.45-72.45

After breaking the ascending trend, the price turned back to this support zone with bounce from an ascending trend as shown

The price now is retesting this zone with price action “pin bar”, to have a bullish movement again

So, it’s expected to go up to the resistance zone of 72.45-74.45


CADCHF

On the daily chart, the pair is facing a punch of support levels

Firstly the key support level of 0.732, secondly the ascending trend from the low of 2016, third the Gartley harmonic pattern, forth the wedge reversal pattern, and finally the oversold on RSI

So, the price is supposed to get back up again to the resistance 0.762


CADJPY

On the daily chart, the pair was moving bearish on the last two weeks, down from a strong resistance zone

Until it reached the key support of 83.75, followed by the ascending trend line from the low of 2018

After forming pin bar followed by bullish candle, the price is expected to hike again to the zone 86.15-86.9


Categories
Forex Market Analysis

Daily: Trade Tensions Continue, Non-Farm Payrolls, UK Growth


NEWS COMMENTARY


The U.S. dollar was lower against other currencies on Monday, as trade tensions put expectations for a Federal Reserve rate hike in September under pressure.

trade tensions with China continued, as U.S. President Donald Trump warned he would impose tariffs on $267 billion worth of Chinese imports, on top of an earlier promise of tariffs on $200 billion worth of Chinese goods.

China’s foreign ministry said on Monday that it would “respond to any news steps on trade”.

“If the U.S. side obstinately clings to its course and takes any new tariff measures against China, then the Chinese side will inevitably take countermeasures to resolutely protect our legitimate rights,” Foreign Ministry spokesman Geng Shuang said.

The US index was down despite Friday’s upbeat jobs report increasing expectations of a fed rate hike in at its next meeting September 25-26.

US non farm payrolls were close to expectations but the market is entirely focused on wages and the report showed hourly wages up 0.4% higher than 0.2% expected.

It was a different story in Canada where employment fell  to 51.6K jobs compared to +5.0K expected. Hourly wages there also fell to 2.6% compared to 3.0% previously and 3.5% two months ago

The British economy posted the fastest expansion in nearly a year as the services sector remained powerful  in the three months through July. Growth beat economist estimates to come at 0.6 & with construction output and retail also providing an enhancement. Separate figures showed the trade deficit in goods narrowed to a five-month low of 9.97 billion pounds ($13 billion) in July.


chart analysis


DAX

On the daily chart, we can see that the price had a bearish rally for the past six weeks until it reached the key support zone of 11900.8-11742.4

It’s also the lower side of the descending channel along with 88.6% Fibonacci

The price is technically expected to have its way up back again to the key resistance level 12582.46 which is the top of descending channel and the broken ascending trend


OIL

On the daily chart, the price is moving sideways between the support area 66.2-64.15 and the resistance area 74.45-72.45

After breaking the ascending trend, the price turned back to this support zone with bounce from an ascending trend as shown

The price now is retesting this zone with price action “pin bar”, to have a bullish movement again

So, it’s expected to go up to the resistance zone of 72.45-74.45


CHFJPY

On the daily chart, the pair is facing a punch of resistance levels

Firstly the key resistance 116, secondly the weekly descending line from the high of 2015, third the up side of the ascending channel which is considered as a flag, and finally the overbought on RSI

So, the piece is expected to turn back down to the support 112.8


NZDJPY

On the daily chart, the pair is facing a punch of support levels

Firstly the key support zone 72.65-72.35, secondly the down side of the descending channel, third the AB=CD harmonic pattern, forth the double bottom reversal pattern, and finally the divergence on RSI

So, the price is supposed to get back up again to the resistance 74.01


Categories
Forex Market Analysis

Markets’ Attention On Summer


Weekly Update (July 9th – 13th)


Macroeconomic Outlook

Summer is in focus now, and with it, the attention on the multiple factors that will condition whether it will be a good summer for the markets or a bad one.

Nevertheless, all these factors that unnerve investors are reaching a final outcome.

  • Last week, the markets performed better as the matters that block them improved slightly.
    • European policy and German politics have reached an outcome.
    • Then oil, which is still a problem.
    • And protectionism which is something more bilateral between China and USA rather than global.
      • When the market realises that, it will care less about it.

We were expecting a hard summer, however, the markets are starting to react in a positive way sooner than expected.

This week has three main references:

  • On Tuesday, the German ZEW Economic Sentiment which is expected to be negative again for the fourth month in a row.
    • It is relevant enough to watch out for but nothing especially important as the overall German economy has been increasing recently at 2.5% in the last trimester, which is really good.
  • On Thursday, there is US Core CPI which is forecasted to rebound from 2,2 to 2,3. This issue depends mostly on oil prices.
    • Over-inflated data may hurt bonds, nevertheless structurally it will not be a real matter which could be solved in 2 or 3 months.
  • And the third reference is American corporate results which start, among the big ones, on Tuesday with Pepsi Co.
    • And on Friday, three big banks publish results
      • Citi / +23%
      • JP Morgan / +30%
      • Wells Fargo / +11% and with some legal problems
    • They are expected to be really solid which will support markets.

Hence, this week looks like where a more positive sentiment towards markets can be consolidated.

  • German political turmoil looks clearer than before.
    • Even though it will come back in October with the elections.
  • Regarding oil, American pressures regarding an increase in production are graspable which will lead to Saudi Arabia producing more, and reducing oil prices.
    • This will reduce inflation related concerns.
  • Then, there is the protectionism which is mostly between the USA and China, being something more local rather than something global.
    • So that, when the market realises that along with strong corporate results, a good economic growth and a lot of liquidity, it will lead to an overall favourable economic cycle which will support the markets.
Categories
Forex Market Analysis

USA VS China Trade, Inflation and Quarterly Results


Macroeconomic Outlook

Three references for the markets this week

1)      Trade relation between China and USA

  1. Last Friday it was agreed what it could be the beginning of talks that will take time
  2. Rather a constructive agreement than a bad one

2)      Inflation

  1. American inflation is the key variable this week
  2. It is expected to increase to 2.5% from previous 2.4%
  3. Currently is above the 2% target and this creates certain anxiety and can have some effect on bonds
  4. Might consider the option of a lower than expected inflation (<2.4%)
  5. Payrolls data, which was published on Friday, was 2.6% instead of 2.7% moving away from the 3% barrier
  6. The option of a lower inflation rate provides a less stressful outlook

3)      Quarterly Results

  1. Really good so far in the USA
  2. Partly because of the tax reform
  3. EPS had increased to an average of 24,8% when at the beginning it was expected to be around 17%
  4. Good so far too in Europe
  5. More European companies will publish results this week

Hence, bearing in mind a decent agreement between USA and China, the possibility of lower inflation and good corporate results, the markets should bounce and rise a little this week.

Furthermore, if the inflation turns out to be lower, it could be good for bonds and could contribute to a weaker US Dollar wich has increased significantly recently.


Technical Analysis

US Dollar Index

Daily Chart

It is possible to appreciate how the US Dollar Index, after tumbling for a couple of weeks, broke all the resistances and increased significantly. The most important resistances generated from its monthly bearish trend have been broken in one strong movement upward. Including, also, its 200-day EMA which is retesting right now. The only significant resistance that is facing now is at the 93.5 which will be the next target leaving some space for a longer run.

EURUSD

Daily Chart

After testing for the third time the bearish trend line on the top it dropped,  strongly breaking its two supports below it. Not only it fell after testing its resistance and breaking the upcoming supports but also, on Wednesday it broke below the third support which is currently retesting. This can be either a fake breakout or another shorting opportunity.


GBPUSD

Daily Chart

After breaking the support, which has been holding price during its bullish trend line, it is eyeing the next solid resistance which is at a level of 1.34 more or less. After breaking the 200-day EMA, it is taking a rest. It may either retest the recent support broken which is hard as the bullish trend was really steep or test the next resistance which is closer and extending the bearish move.


USDJPY

Daily Chart

The dollar broke both resistances after doing a fake breakout and bouncing back from the monthly support. It has created a small bullish trend in the short term where it can be holding on until it reaches its next target which is the monthly bearish trend, currently situated at a level of 111.5. Either that or starts going sideways for the next days until it breaks one of the monthly trends.

Crude Oil

Daily Chart

Recent geopolitical events and tensions in Syria have created volatility in the markets, and consequently, the price of oil has been on the rise. After holding to the bullish trend line and breaking above $65 it did a retest of the recent resistances it just broke above. Without more resistances ahead, it has just reached the expected target of $70 per barrel. There are not any significant resistance above which leaves the door open for a longer bullish run.

DAX

Daily Chart

It bounced back from the monthly bearish trend which was the strongest one and consequently in the recent run it has just broken both two bearish weekly resistances. Last Friday it closed above the last resistance which leaves the door open for a continuation, possibly at less slow pace, of the recent bullish trend formed from testing the resistances and breaking the supports.

©Forex.Academy

Categories
Forex Market Analysis

Volatility moves towards Europe

Hot Topics:

  • S. Core PPI (YoY) reaches the highest level since 2012.
  • Volatility moves towards Europe.
  • The pound rally continues due to the weakness of the dollar.
  • Jinping reduces risks of a Trade War.
  • Oil Brent reaches the highest level since 2014.

U.S. Core PPI (YoY) reaches the highest level since 2012.

The signs of strength in the economic growth of the United States continue, the Underlying Producer Price Index (YoY) reached 2.7% in the March period, the highest level since June 2012. The Core PPI (MoM) index, for its part, it reached 0.3% on the expectations of analysts who projected 0.2%. According to the Bureau of Labor Statistics, 70% of the increase in final demand is attributed to a rise of 0.3% in the prices of final demand services, in the same way, transport and storage services for final demand increased by 0.6 %. The increases in the level of inflation for producers are expected to have an impact on the Consumer Price Index, which will be published this Thursday.

Despite these positive macroeconomic data, the greenback index continues its strong depreciation, which has lost 2.83% in the year. Today is closing with -0.25% of loses. We are paying attention to the zone between 89.15 and the 61.8% of Fibonacci retracement level, where the Index has found support.

Volatility moves towards Europe.

The risks of the Trade War between the United States and China are disappearing more and more with the bilateral attempts to resolve the conflict in a friendly way. However, in Europe, the scenario that seemed full of geopolitical stability is changing. This Sunday 08, Viktor Orban won the elections in Hungary for the fourth time in a row. With an utterly autocratic speech, the nationalist Prime Minister proposes an anti-immigrant policy and open attacks towards the European Union. Hungary refuses to comply with the agreed European migration policy, that is, accept quotas of Syrian refugees, in the same way as the United Kingdom raised in one of its arguments against Brexit. It should be added that Mr Orban is not alone in this political tendency; he has found allies in power in Poland, the Czech Republic, Slovakia and Italy. All of them are willing to reject the obligation to accept refugees and respect the right of free movement.

The euro has closed with gains for the third consecutive session with a 0.29% of advance. The pair shows a bullish move in the middle of a sideways formation. In the last trading session, the price has found resistance at 61.8% of Fibonacci retracement

The pound rally continues due to the weakness of the dollar.

The pound continues for the third consecutive session in a bullish rally advancing 0.64% in the week and has gained 0.35% in the last trading session. All this occurs in the context of the weakness of the dollar despite the excellent macroeconomic data of the United States. The level of support to be controlled is 1.4145; the key resistance level is 1.42 as a psychological level.

Jinping reduces risks of a Trade War.

Chinese President Xi Jinping has promised to reduce import tariffs by alleviating the fear generated by the escalation of bilateral tensions between the United States and China. In a speech held at the Boao Forum, President Jinping promised to open the Chinese economy further, protect the intellectual property of foreign companies. These words filled the market with optimism, leading the indexes to move positively, the Dow Jones Index advanced 1.48%, while the yen reduced its attractiveness as a refuge, leading the USD-JPY to close with 0.41% of earnings.

The USD-JPY pair is forming an ascending diagonal pattern, which still has space to follow a rally, the closest resistance levels are 107.49 and 108, and the support level to control is 106.64.

The Dow Jones index, which is within a descending channel, the price is for the control support level at 24,037.3 and is developing a possible upward diagonal formation whose closest resistance is at 24,630, a level that coincides with the Upper part of the bearish channel. Bullish positions are valued as long as they do not fall below the 23,749.3 level.

Oil Brent reaches the highest level since 2014.

The euphoria of the reduction of the economic tensions between the United States and China due to the sayings of Jinping, not only has motivated to the indices but also the oils. The Brent has reached its highest level since 2014, reaching the $ 71.03. Crude Oil, on the other hand, approached two-week highs reaching $ 65.76. The oil rally and the Dollar weakness also benefited to the pair USD-CAD (by inverse correlation) which closed at lowest levels since February testing the psychological level 1.26 approaching the level of Fibonacci retracement 61.8% at 1.2583.

Our central view for this highly correlated group has been bullish; but we currently prefer to maintain a neutral position considering that once the oils reach specific levels in the long term for their structures, they should make a significant corrective movement that will allow us to join to the trend. As long as Brent does not reach the area between $ 71.26 and $ 72.91, and Crude Oil does not come close to $ 69 and $ 70, we do not expect a start of a significative correction.

In the case of the USD-CAD pair, once it reaches the base of the channel, it is expected that a bullish move could begin.

©Forex.Academy


Categories
Forex Market Analysis

U.S. Core PPI (YoY) reaching its highest level since 2012

Hot Topics:

  • S. Core PPI (YoY) reaches the highest level since 2012.
  • Volatility moves towards Europe.
  • The pound rally continues due to the weakness of the dollar.
  • Jinping reduces risks of a Trade War.
  • Oil Brent reaches the highest level since 2014.

U.S. Core PPI (YoY) reaches its highest level since 2012.

Signs of strength in the United States economic growth continue showing up. The Underlying Producer Price Index (YoY) reached 2.7% growth in March, the highest level since June 2012. The Core PPI (MoM) index, on the other hand, went up 0.3% fulfilling analysts expectations who projected 0.2%. According to the Bureau of Labor Statistics, 70% of the increase in final demand is attributed to a rise of 0.3% in the prices of final demand services, in the same way, transport and storage services for final demand increased by 0.6 %. The producers’ inflation rise is expected to have an impact on the Consumer Price Index, which will be published this Thursday.

Despite these positive macroeconomic data, the greenback index continues its strong depreciation, losing 2.83% for the year. Today the greenback is closing with a loss of -0.25%. We are paying attention to the zone between 89.15% and 61.8%  Fibonacci retracements, where the Index has found support.

Volatility moves towards Europe.

The risks of a Trade War between the United States and China are disappearing more and more, with the bilateral attempts to resolve the conflict in a friendly way. However, in Europe, the scenario that seemed full of geopolitical stability is changing. This Sunday 08th, Viktor Orban won the elections in Hungary for the fourth time in a row. With an utterly autocratic speech, the nationalist Prime Minister proposes an anti-immigrant policy and open attacks towards the European Union. Hungary refuses to comply with the agreed European migration policy, that is, to accept Syrian refugees quotas in the same way the United Kingdom did as one of its arguments for Brexit. It should be added that Mr. Orban is not alone in this political tendency; he has found allies in power in Poland, the Czech Republic, Slovakia, and Italy. All of them are willing to reject the obligation to accept refugees and respect the right of free movement.

The euro has closed with gains for the third consecutive session with an advance of 0.29%. The pair shows a bullish move in the middle of a sideways formation. In the last trading session, the price has found resistance at 61.8% of Fibonacci retracement.

The pound rally continues due to the weakness of the dollar.

The pound continues for its third consecutive session in a bullish rally advancing 0.64% for the week and gaining 0.35% in the last trading session. All this occurs in a context of a weakness of the dollar, despite the excellent macroeconomic data of the United States. The level of support to be checked is 1.4145; the key resistance level is 1.42 as a psychological level.

Jinping reduces risks of a Trade War.

Chinese President Xi Jinping has promised to reduce import tariffs by alleviating the fear generated by the escalation of bilateral tensions between the United States and China. In a speech held at the Boao Forum, President Jinping promised to open further the Chinese economy and protect the intellectual property of foreign companies. These words filled the market with optimism, leading the indexes to move positively, the Dow Jones Index advanced 1.48%, while the yen reduced its attractiveness as a refuge, leading the USD-JPY to close with 0.41% of earnings.

The USD-JPY pair is forming an ascending diagonal pattern, which still has space to rally. Its closest resistance levels are 107.49 and 108, and the main support level to watch out is 106.64.


The Dow Jones index moves within a descending channel, its price looks to control a support level at 24,037.3 and is developing a possible upward diagonal formation whose closest resistance is at 24,630, a level that coincides with the Upper part of the bearish channel. Bullish positions are valued as long as price does not break the 23,749.3 level.


Oil Brent reaches the highest level since 2014.

The euphoria produced by the reduction of the economic tensions between the United States and China due to Jinping’s latest public speeches, not only has motivated a good mood on the indices but also on oils. The Brent Crude has reached its highest level since 2014: $ 71.03. Wes Texas Crude Oil, on the other hand, approached its two-week highs at $ 65.76. The oil rally and the Dollar weakness also benefited the USD-CAD pair (by inverse correlation), which closed at its lowest levels since February, and testing the psychological level 1.26,  approaching the 61.8% Fibonacci retracement level at 1.2583.


Our central view for this highly correlated group has been bullish; but we currently prefer to maintain a neutral position considering that once oils reach specific long-term levels on their structures, they should make a significant corrective movement that will allow us to join the trend. As long as Brent does not reach the area between $ 71.26 and $ 72.91, and Crude Oil does not come close to $ 69 and $ 70, we do not expect a significative correction to begin.

In the case of the USD-CAD pair, once it reaches the base of the channel,   we expect the beginning of a bullish move.


Categories
Forex Market Analysis

The Trade War could benefit South American Producers

DAILY UPDATE

Released: 5th April 2018.

Hot Topics:

  • The trade war could benefit South American producers.
  • The unemployment rate of European Union falls to 8.5%.
  • Climatic factor impacts on March PMI Construction.
  • The Bounce of the Stock Markets Boosts the Yen’s Crosses.
  • Indices rebound driven by possible bilateral talks between the United States and China.
  • The Canadian Dollar is showing an example of the alternation rule of the Elliott Wave theory.
  • Crude Oil Production falls to its lowest level in over a year.

The Trade War Could Benefit South American Producers.

Uncertainty due to the trade war between the United States and China continues. This time China has reacted by incorporating a 25% tariff on soybeans of US origin. It should be noted that China is the primary consumer of soybeans in the world. As a result of this increase in tariffs on American soy, it is estimated that China could turn to South American producers to meet the demand for the grain. Despite this pessimism in the economic context, the Dollar Index in the hourly chart is developing an inverted Head and Shoulder pattern as a bullish continuity configuration. The next control zone is in the range of 90.20 and 90.36, in case if we do not overcome the resistance of 90.36, we could see a potential retracement to the 89.15 area.

The Unemployment Rate of European Union Falls to 8.5%

The signs of recovery in the European economy continue. The unemployment rate of the European Union has fallen to 8.5% in February, down from 8.6% in January. According to the information provided by Eurostat, the labour market in the Eurozone has reached the lowest level since December 2008. This level of optimism has not been enough to push the Euro towards new highs. The single currency is within a range between 1.225 and 1.23, from where it could create a bottom around the levels 1.2213 and 1.224. A new bullish rally could start from here.

Climatic Factor Impacts on March PMI Construction.

The PMI of the Construction sector (MoM) plummeted sharply to 47 pts, compared to the 50.9 forecast, despite the weak data. It is the lowest level since July 2016, when it reached 45.9 pts in the context of the Brexit elections (June 23, 2016). The critical factor in the decrease in activity has been the climatic factor, remember that in March the worst snowfalls in recent years were recorded. Technically the pound is developing a pattern of Head-Shoulder, which could be contained in a more extensive setup of Head-Shoulders. This could lead to sterling up to 1.3922 in the first instance, and up to 1.3737 in the second instance. All this structure could correspond to a major degree lateral structure that takes us from the 1.373 area to reach new highs around 1.45.

The Bounce of the Stock Markets Boosts the Yen’s Crosses.

Yesterday, although tensions in the dispute of tariffs between the United States and China, the Bank of Japan (BoJ) disbursed 833 billion yen (about US $ 7.8 billion) in the purchase of Exchange-Traded Funds (ETFs). This level of expenditure is the highest level since September 2017, the month in which the BoJ spent 830 billion yen. This action earned the yen to start a turn in its trend; this can be seen both in the chart of the USD-JPY and EUR-JPY which have begun to show bullish patterns. For the USD-JPY pair, the closest key resistance level is 108; in the case of the EUR-JPY cross, the control level is 131.71, a level that if exceeded could lead to the price to exceed 133.5 with a maximum extension of 134.5 in the short term.

Indices Rebound Driven by Possible Bilateral Talks Between The United States and China.

Through his Twitter account, President Trump stressed that the United States is not in a trade war with China. The Trump administration indicated that it is willing to negotiate with China on the escalation of tensions between the two countries. The most significant problem as mentioned by the American President in his account on the social network is that the deficit in the American trade balance is $500 billion, which according to his words “When you’re already $500bn DOWN, you cannot lose.” With the fears of a commercial war between the Trump administration and the administration of Jinping, the indices began to recover confidence. They realised a V-turn pattern is taking the Dow Jones to close above the 24,000 pts in a day. It started lower in the global indexes. The level of resistance to control is between 24,800 pts and 24,982 pts, an area from where in case of breaking up, could take us to levels close to 26,000 pts. The key support levels are 24,034 and 23,330 pts, which coincide with the base of a bearish channel.

The Canadian Dollar is Showing an Example of the Alternation Rule of the Elliott Wave Theory.

The Loonie has made a false rut beginning a downward cycle. It is developing a long-term bullish channel as a long-term bearish formation and is reaching a zone of 1.31 and coinciding with the upper guideline of the channel. Once started, this bearish cycle has been developing five clear movements. In this case, we will highlight the corrective formations or consolidation. According to the Elliott Wave theory, the alternating rule states that after a simple corrective structure, a complex structure should be presented and vice versa. By looking at the time chart of the USD-CAD, we can see this application. The conclusion that this case leads us to is to suspect that a recession is approaching, and that could take the price to levels around the area of the complex corrective structure and then return to develop new minimums in the long term.

Crude Oil Production Falls to Its Lowest Level in Over a Year.

The production of crude oil from the countries belonging to OPEC has fallen to the lowest level in a year and a half. This is mainly due to the problems plagued by the policy of Venezuela, where production decreased by 100,000 barrels per day since February, reaching 1.51 million barrels per day according to the survey conducted by Bloomberg News. The overall level of the output of the 14 OPEC member countries fell by 170,000 barrels to 32.04 million barrels per day in March. OPEC has helped stop production as of January 2017 with the aim of boosting the price of oil, which has been currently consolidating above $60 a barrel. Structurally in the hourly chart, we observed a Head-Shoulder formation that did not reach the technical target bouncing upwards. As long as oil does not lose levels below $60.2, the dominant trend continues to be bullish.

©Forex.Academy

Categories
Forex Educational Library

Changes in the Energy Model

 Abstract

The current energy model is based on fossil fuels which can be extracted quickly and throughout history have been abundant resources on earth. But with an increase in population and its consequent demand for energy, energy sources have been reduced which has led to the prices of coal, oil and other raw materials fluctuating drastically, leading to booms and falls that have affected many economies because their main source of income is the exploitation of these resources. As has happened throughout the history of mankind with changes in demand, energy models change. At present, there are problems in the environment caused by the exploitation of fossil fuels, which has led many analysts and economies to rethink on which energy model their economies should be based.


The conventional energy model has sustained economic growth since the first industrial revolution for over 150 years and has been based on the extraction and combustion of non-renewable and finite fossil fuels such as coal, oil and natural gas. With globalization, the distribution and exploitation of these resources have been achieved through multinationals that allow countries that do not have good reserves of fossil energy sources to access these resources through imports.

But this conventional energy model has some drawbacks such as the generation of wealth but distributed unevenly where multinationals benefit mainly, the impact on the environment and the emission of polluting gases, the externalization of environmental and social costs. As the extraction sector requires so much capital, it is a sector with a high entry barrier where some companies cannot compete due to high-value auctions of mines and wells where these resources are located, which generates a high concentration of business and this ends up generating a concentration of wealth in a small group of companies.

The consequences of this way of generating energy, such as the acceleration of resource depletion, social and economic imbalances, inefficiency in the way energy is generated and climate change has generated a debate about whether it is time to change the energy model by one friendlier with the environment and one more inclusive with the local communities that generate wealth more equitably. The problem to change the energy model is the vast amount of energy consumption that depends on conventional sources, so it will not be easy to change from one model to another.

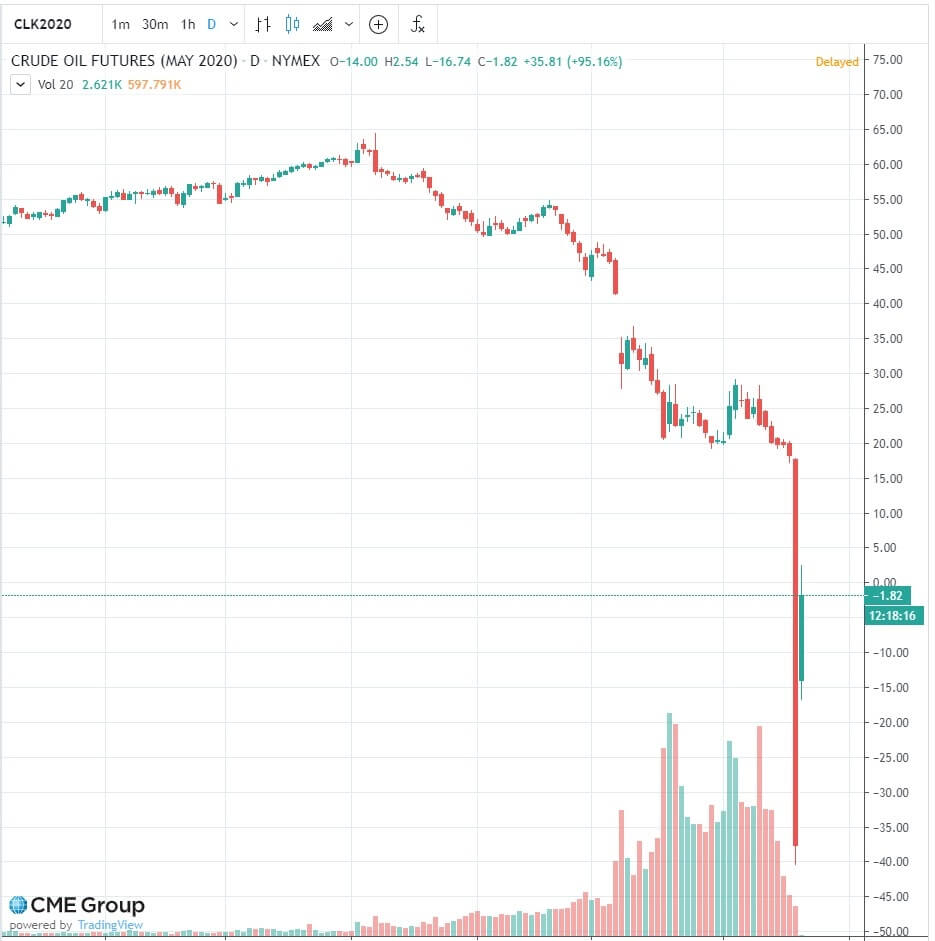
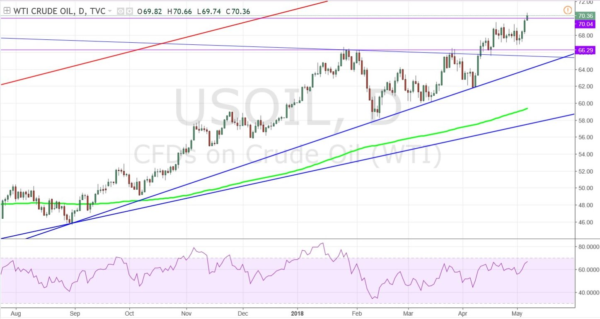
The main source of energy consumption in the world is non-renewable sources. The forecasts of the International Energy Agency speak of an oil demand of 116 million barrels per day for the year 2030 so with some forecasts it is believed that by 2050 there would be no more reserves. The same occurs with coal and natural gas that is estimated that the reserves will not reach more than 250 and 75 years respectively. It is for this reason that in the last years until 2014 the prices of raw materials had increased in an accelerated way showing that trend of reserves. What happened after 2014 was a decrease in demand in most commodities due to a change in the Chinese economic model as discussed in the article China and its economic predominance and the unconventional extraction of oil. In the next graph, you can see the price of gas and oil in the last years.

Graph 29. McGuire A. (2009, July 2). This Chart Compares Oil Price History to Natural Gas Price History. Retrieved November 25, 2017. From https://moneymorning.com/2015/07/02/this-chart-compares-the-oil-price-history-to-natural-gas-price-history/

The OPEC response to the crisis in commodity prices was to reduce the supply of oil to increase oil prices that reached below 40 dollars per barrel in 2016 when years before the crisis of 2007 came to be above $ 120 per barrel. OPEC had its beginnings in 1949 when Venezuela entered into talks with Iran, Iraq, Saudi Arabia, and Kuwait to exchange views and improve communication between countries regarding the oil market. Already in 1959, the need for cooperation became more evident because the multinationals that were in the producing countries began to pay less unilaterally to the producer countries in royalties which increased their profit margins but affected the countries that had the deposits.

After this behavior of the multinationals where they reduced the price of oil extracted in the countries with reserves to pay fewer royalties, but increased the price of refined oil, made the countries act forming a congress of producing countries where it was determined that this could not happen unilaterally if not that there should be negotiations prior to any decision. Such was the indignation of the producing countries that the Organization of the Petroleum Exporting Countries was constituted in 1960 by the governments of Venezuela, Kuwait, Saudi Arabia, Iran, and Iraq. The first thing OPEC did was to establish fixed royalty rates and the price that sold their product.

But the unrest continued due to the unfair behavior of the international oil companies, so they tried to establish state oil companies to compete. This was the first measure that was taken by the producing countries to control oil prices. From this measure and the OPEC interference in oil prices, many economists began to consider the oil market as an oligopoly where there are very few oil suppliers due to the power exercised by this organization and a high level of demand. But there is also another group of analysts who think that despite the existence of OPEC there are other factors that make the market competitive such as the reduction of reserves, the uncertainty of extraction of some countries and technological and environmental aspects.

What is true is that historically OPEC has not caused oil crises nor have generated sudden growth in oil prices. There may be news about the behavior of member countries of this organization that have an impact on financial markets and some volatility in assets linked to the price of oil. The drastic increase in oil prices between 2004 and 2008 was not due to OPEC’s organizational policies but to the uncertainty about the production capacity of the members.

The causes of the 2014 crisis in the oil market were mainly due to three factors. The first factor is the development of the extraction of unconventional hydrocarbons such as Fracking, which has allowed non-OPEC countries such as the United States to increase their production in an accelerated manner. In just six years the United States production increased close to 90% so that producing countries that found in this country as a net buyer of fuels now see it as competition from other markets such as Asia. In the following graphic, you can see a summary of how fracking works

Graph 30. (2017, March 17). Fracking. Retrieved November 25, 2017. From http://www.goveonline.com.au/fracking/

The second factor that determined the crisis of recent years was the decision of OPEC to maintain its production unaltered so as not to affect the market share of each country that was a member of the organization. This factor was added to the first, so the offer increased considerably.

And the third factor was the weak demand for raw materials including oil due to the change of the Chinese economic model and the weak demand of European countries, all products of the crisis of 2007 that affected the growth of most countries in the world and his recovery was very slow.

The winners of this oil crisis were the importing countries of oil and other raw materials since the low costs of these energies increased the purchasing power of the households generating an impulse in the local consumption of each country. The losing countries obviously were the exporting countries due to the reduction in extraction royalties and therefore the revenues of the governments. Given the above, there were taxation pressures and some countries entered crises like Venezuela that needed higher prices to be able to carry a huge social expenditure.

The prospect of the future of raw materials is complicated. In 2017 prices have recovered slightly but far from reaching the prices reached by the raw material before the crisis thanks to the reduction of supply by the countries belonging to the OPEC. Given the unstoppable proliferation of unconventional extraction platforms, the evolution of the supply will depend on the next agreements that the members of the organization can reach to control production.

Currently, although the OPEC countries are complying with the cuts promised in the offer, the number of new platforms in the United States is such that prices have seen prices above $ 50 a barrel, but not beyond this point due to the low production costs that non-conventional producers need to have benefits in their activity. Fracking is a technique used to extract oil and gas that has been impregnated with rocks and is difficult to obtain with conventional methods. For this purpose, water and chemicals that expel hydrocarbons to the surface are injected into the subsoil.

The measures taken by OPEC have had a negative aspect in their interests since as the price has risen with the agreements they have reached, the opening of wells in the United States and other non-member countries that previously were not profitable has been propitiated, but with the new prices, they generate economic benefits.

But as has happened throughout history since industrial development, energy transitions occur when the behavior of people changes. In the first epochs of mankind in the underdeveloped agrarian economies, the basic needs of food were satisfied by simple forms of agriculture that had an energy source, solar energy. As the economies develop, they become more complex and depending on these changes, the uses and sources of energy also change.

Each stage of economic development has been accompanied by an energy transition from one source to another. That is why, in the 21st century, we are seeing a transition in the energy sources from fossil fuels to renewable energy sources and this change is mainly due to the concern about environmental impacts, the limits in the reserves of fossil fuels, prices of raw materials and technological changes. The lifetimes of fossil fuels could be extended thanks to the technological innovations that are more efficient and make the extraction activity more profitable, but what could be decisive when changing the energy model is the concern about the impact on the environment that humans have caused.

Because much of the capital invested and the infrastructure of the economic system of the main modern economies are based on the extraction and use of fossil fuels, the total change of infrastructure for new technologies will not be easy or cheap. The financial and private markets will play a crucial role in this process due to the large amount of money that is needed as well as the help of the governments of each country.

Up to a certain point renewable energy are unlimited since their sources are provided by nature and you can have a daily supply such as solar energy and wind energy that has no limit. But not all countries are the most suitable to have any type of energy since they also depend on their geographical location. In some states of the United States, solar energy is more appropriate than in Africa and the Middle East. Unlike other countries in Europe, South America and part of the United States that should implement wind energy.

What is certain is that all countries in the world have some renewable energy resources, although the availability and cost of use are variable. But after the economies achieve the coupling to new technologies renewable energies will help to save money due to lower costs since it is a constant source of energy. They will also compensate for the effect that unemployment generates due to the disuse of non-renewable energies since in the transition new types of employment will have to be created, specializing in clean energies.

In conclusion, we are in a time of change where the rethinking of the energy model is not abnormal. This has happened periodically throughout history since energy models correspond mainly to the needs of people and the technologies available in its time. The current situation of the extraction sectors is complicated due to two main factors, which are the new global awareness of environmental care and the appearance of new technologies such as Fracking. We are in a moment of transition where society has considered the cost-benefit of the use of non-renewable energies and it’s clear that the cost generated using these sources is quite high to continue with the current model.

 ©Forex.Academy