Categories
Forex Market Analysis

Russell 2000 Technical Overview

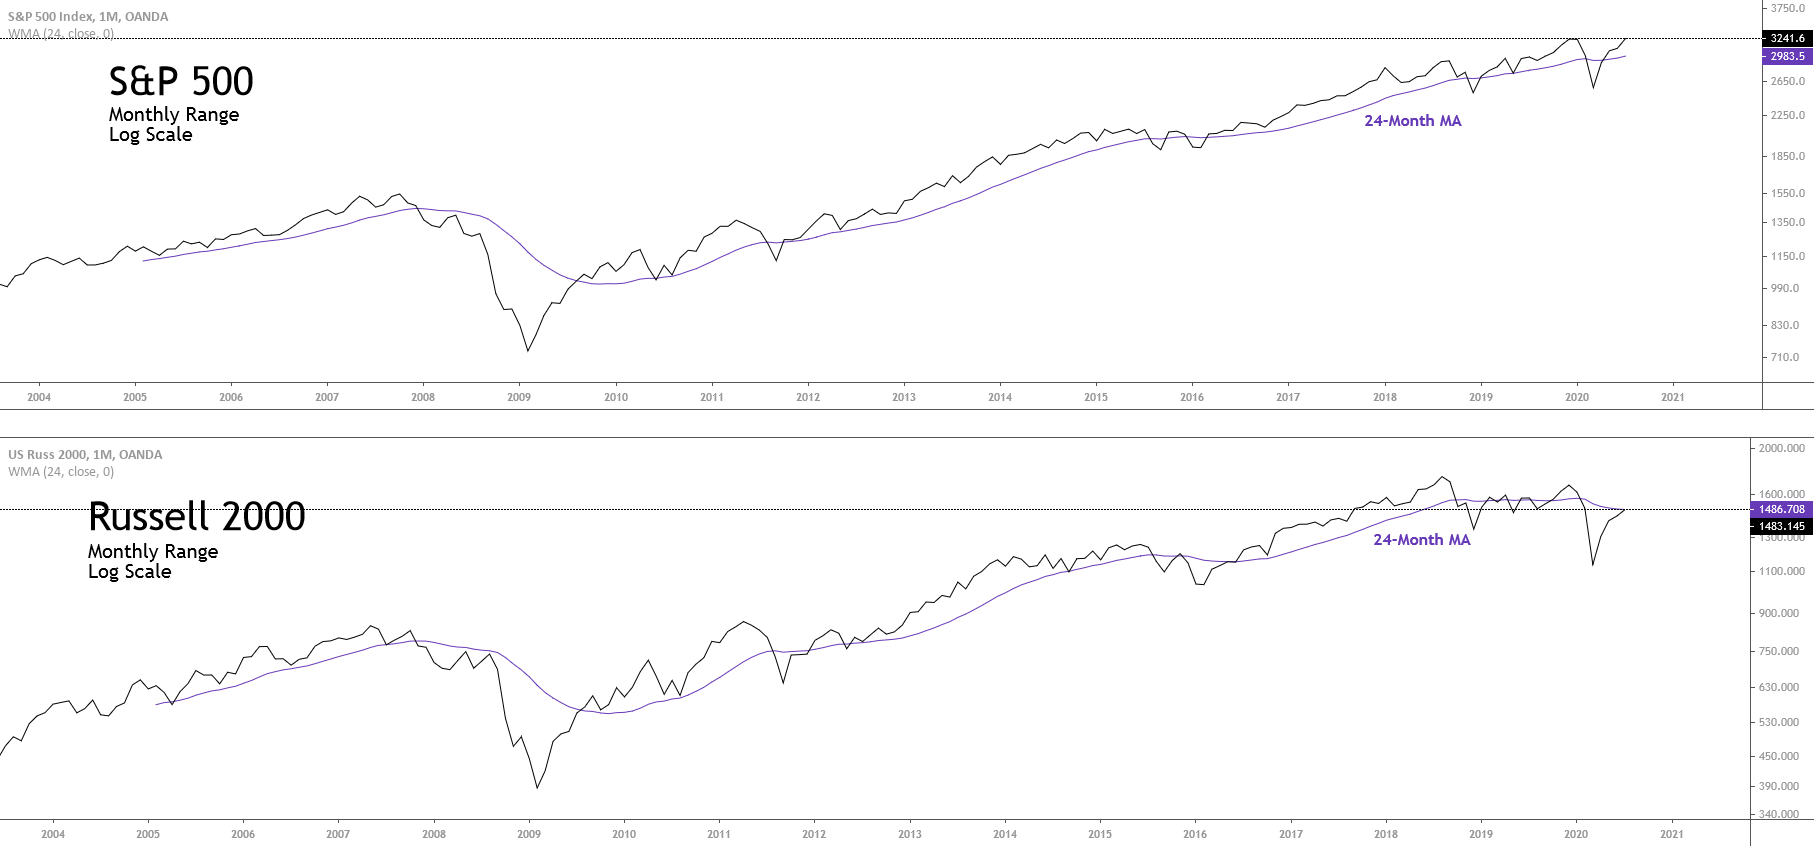
The U.S. stock index Russell 2,000 and the S&P 500 shows a divergence in its long-term trend. While the S&P 500 reaches fresh highs recovering from its 2020’s losses, the Russell 2000 index remains negative.

As the previous chart illustrates, Russell 2000 continues moving below its 24-month moving average while the S&P 500 already moves on the bullish side. This market context could lead Russell 2000 to see more declines in the coming weeks, although, currently the short-term bias is still hinting to further advances.

Market Sentiment Overview

This year, the index that groups the 2,000 most prominent small-cap U.S. companies sheds near 11.5% (YTD), dragged by the pandemic lockdown.

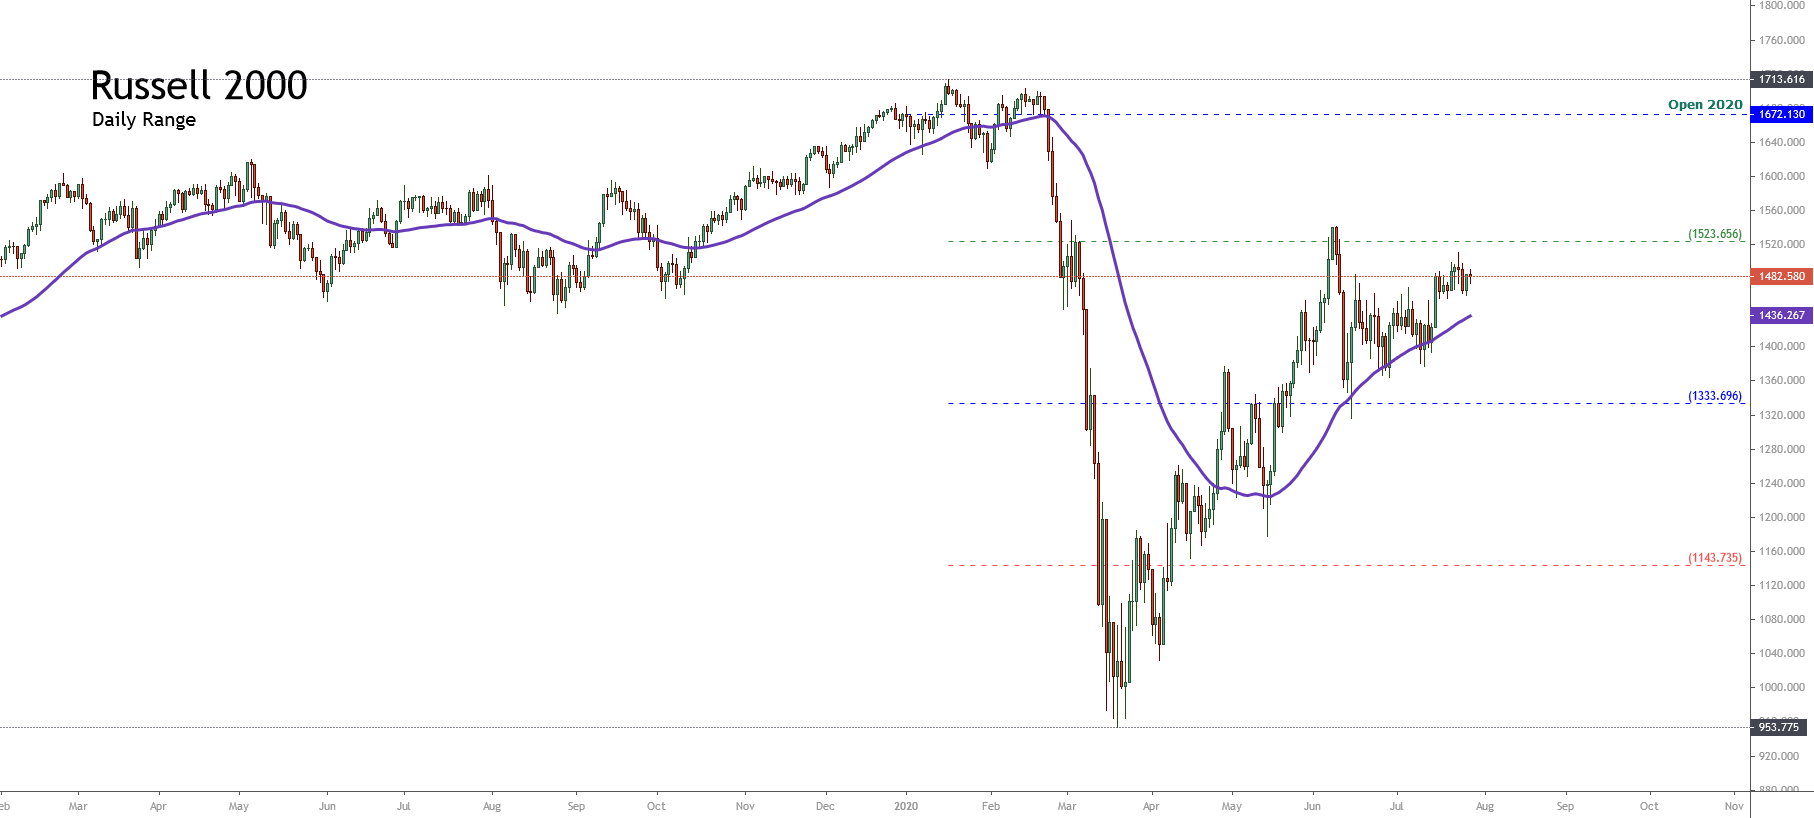
The following chart exposes to Russell 2000 in its daily timeframe. On the figure, we distinguish the price moving above the 60-day moving average, which leads us to conclude that the short-term bias still remains on the bullish side.

At the same time, from the 52-week high and low range, we note the price action continues moving bellow the 1,523.65 pts, which makes us hold our bullish bias. In this context, the possibility of a strike over the 1,523.65 pts could reveal an extreme bullish sentiment on the Russell 2000 index.

On the other hand, the absence of a bearish reversal pattern discards, for now, the probability of a plummet in the U.S. stock market.

Elliott Wave Outlook

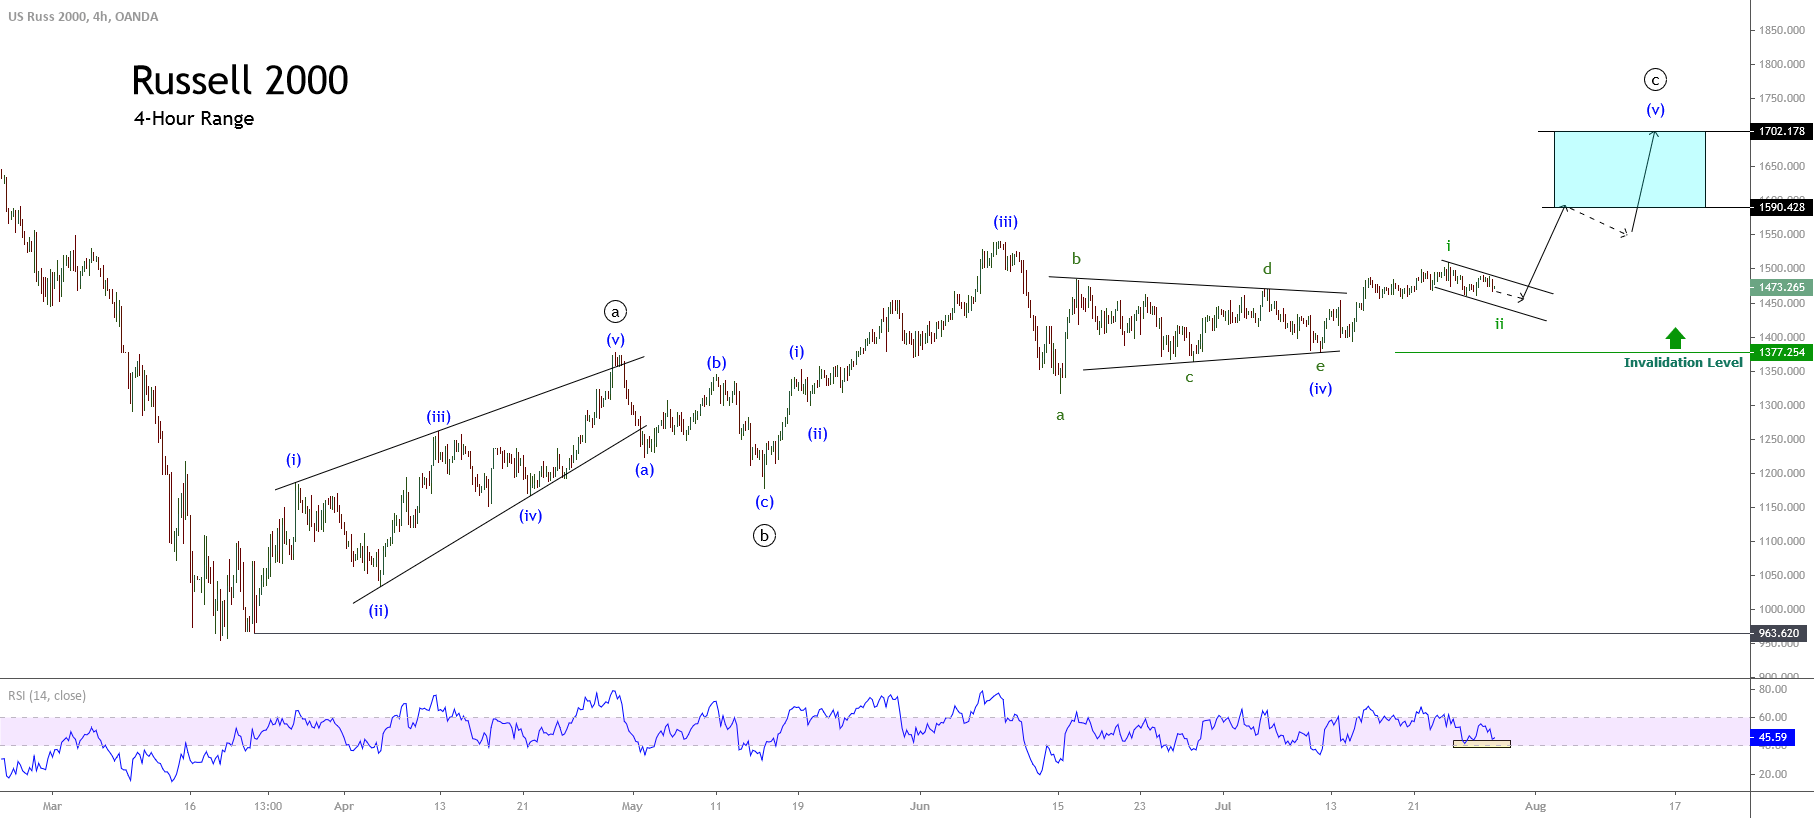
The short-term Elliott wave perspective of the Russell 2000 index exposed in its 4-hour chart reveals the recovery experienced by the U.S. stock market from last March 23rd when the price found fresh buyers at 963.62 pts.

In the previous chart, we observe a first five-wave structural sequence corresponding to a leading diagonal pattern identified as wave ((a)) of Minute degree labeled in black. The first five-wave sequence topped at 1,376.52 pts where the price started to develop a corrective move in three waves corresponding to wave ((b)) in black, which found support at 1,177.26 pts on May 14th.

Once the second wave ended, the price began a new rally, which remains in progress. After the third wave of Minuette degree labeled in blue, Russell 2000 developed a correction identified as a triangle pattern. After the breakout of the upper guideline b-d, the U.S. index resumed its short-term upward trend.

Currently, the price action remains consolidating in a wave ii of Subminuette degree identified in green. In this context, the RSI oscillator continues moving above the 40-level, which leads us to confirm the retracement and the bullish bias of Russell 2000.

Finally, the upward continuation could drive to Russell 2000 toward 1,590.42 and even extend its gains until 1,702.17 pts. On the other hand, the bullish scenario will remain valid while the price continues above 1,377.25 pts.

Categories
Crypto Videos

Bitcoin vs. Gold and S&P 500: Correlation analysis


Bitcoin vs. Gold and S&P 500: Correlation analysis


While many want to believe that Bitcoin is a non-correlated asset, that doesn’t seem to be the truth. Though Bitcoin’s correlation with gold is diminishing, the asset’s correlation with the S&P 500 index is on the rise, as reported by the researchers at the crypto exchange Kraken.
Kraken Intelligence, which is a research part of major US cryptocurrency exchange, Kraken, has released a “Bitcoin Volatility Report” for the month of June 2020.


Bitcoin’s volatility 

The new report shows a 31% drop in Bitcoin trading, resulting in a 6-month low of Bitcoin’s annualized volatility.
The significant decline in volumes, as well as volatility, marked June as the least volatile month since February 2020.


Correlation with gold drops 

Bitcoin’s 30-day correlation with gold went down and passed its one-year average of 0.24 to the downside. This signified a four-month low correlation of -0.49, the researchers announced. The move towards the downside followed a modestly positive trend that started in the second half of May (and ended above a one-year average of 0.50).


Correlation with the S&P 500 on the rise

While Bitcoin is showing fewer signs of correlation with gold, the cryptocurrency’s correlation with the stock market indexes such as the S&P 500 seems to be growing. Kraken Intelligence reported that the trend reversal caused Bitcoin’s correlation with the S&P 500 to climb to the highs of up to 0.65.
Kraken’s data on Bitcoin and S&P 500 correlation is not a “lone wolf” since other exchanges’ research shows the same. OKCoin posted data earlier this week, saying that the exchange witnessed high levels of Bitcoin and S&P 500 1-month realized correlation. Daniel Koehler, liquidity manager at OKCoin, said that “The last time we saw SPX and BTC 1-month realized volatility spread being this low was prior to the March 12th BTC price crash”.

Categories
Forex Market Analysis

Daily: New Episode of Trade War, Brexit Negotiations, U.S & South Korean Summit


NEWS COMMENTARY


U.S. President Donald Trump and South Korean leader Moon Jae-in will meet in New York on Monday to discuss how to move forward on a formal declaration of the end of the Korean War. Moon met with North Korean leader Kim Jong Un last week. “Chairman Kim expressed his wish to finish complete denuclearization at an early date and focus on economic development,” Moon said of his meeting with the North Korean leader in Pyongyang.

The Organization of the Petroleum Exporting Countries and Russia pushed back against a call last week by U.S. President Donald Trump to lower prices. “I do not influence prices,” Saudi Energy Minister Khalid al-Falih told reporters as OPEC and non-OPEC energy ministers gathered in Algiers. The group of oil producers is in discussion about rising output to counter falling Iranian supplies due to U.S. sanctions but made no formal recommendation for any additional supply boost at its Sunday meeting.

British Prime Minister Theresa May is under attack from several fronts over her Brexit plan. Members of her own party launched an alternative plan for leaving the European Union which would involve ditching her Chequers deal for a cleaner break with the bloc. The main opposition Labour Party are holding their annual conference where members will decide on whether to back a second referendum on the issue. There were also reports over the weekend of a possible snap election in November. Relations with the EU side, meanwhile, continue to be strained.


CHART ANALYSIS


OIL

Last week price continued its ranging move between support at 66.2-64.15 and resistance at 74.45-72.45. After having breached the ascending trend, price turned back to the support zone with a bounce from an ascending trend as shown on the daily chart below. As we expected, price is now “pin bar” reaching the main resistance zone with touching 72.45, we expect bullish momentum to build up towards the 74.45 level. and then wait for a bounce or a break to determine the next move


S&P 500

On the daily chart, the price has broken the key resistance level at 2875.58 and stayed above it to reinforce the bullish bias.

However, we should highlight significant reversal signs, including:

1. Elliot’s Wave 5 has formed;
2. AB=CD harmonic pattern in play.
3. A Wedge reversal pattern remains active.
4. RSI Divergence.

Thus, if price breaks through support at 2875.58 we should witness a correction towards 2797.82.


AUD/USD

On the daily chart, the Aussie is clearly reflecting a bearish bias as it descends down a channel that started forming since the beginning of this year; reaching support at 0.71 where some clear sign of reversal showed up.

We expect reversal/consolidation to develop further as:

1. Price has bounced from the support zone between 0.71-0.716.
2. An AB=CD harmonic pattern is rather suggestive.
3. A Wedge reversal pattern.
4. RSI divergence.

the price manages to stay above 0.7225,then it has the potential of reaching 0.733 and 0.745


USD/CAD

On the daily chart, we observe the Loonie to follow a descending channel since June this year, with a false 2 weeks reversal before continuing its way down.

As we expected before that the price fell further to 1.289 and meet the ascending trend line from March’s Low, coupled with the 200 Exponential Moving Average (EMA)

Now the price located at the key support of 1.289 besides the ascending trend line from the low of 2017. so, any bounce here would expose the price back to 1.312. and any break beneath these levels would continue the bearish bias to 1.272


USD/JPY

On the daily chart, as expected, price is moving upwards to the 113 target, leaving 112 as near-term support. We expect an extension towards the 113 area before resumption of the downside towards at least 109,75.


Categories
Forex Market Analysis

What Happened Last Week and What Lies Ahead


Last Week Wrap-up


Economic Data Today:

UK

Last week started with a slightly upbeat UK Construction PMI report that slightly beat expectations and the Pound rallied on the news. Next day,  the Market Services PMI figure at 54.0, also beating the expectations continue pushing the Pound higher.

Euro-Zone

Meanwhile, April’s Euro-zone Producer Price Index (YoY) was 2.0%, below the expected 2.4%, while the Composite PMI came at 54.0, as expected.

Then, April’s Euro-zone Retail Sales (MoM) came slightly below expectations at 0.1%  but the year over Year figure kept steady at 1.7%.

What started moving the Euro up was an ECB spokesman’s announcement on June 5th’s “live” meeting discussion regarding QE, at their next June 14th meeting, sparkling the speculation about the end of massive bond purchases.


Dax and FTSE

The DAX and the FTSE 100 were having jumpy days, with gaps down that filled during the session. Investors were nervous seeing the FTSE at its near all-time highs, while German DAX suffering was caused by not so good numbers in production and factory orders in the negative territory growth (-2.5% MoM and -0.1% YoY).


Australia

June 6th woke up with the positive news about the Australian Economic Growth (YoY) soaring above analysts expectations for the first quarter, reaching 3.1%  above a forecasted 2.8%, and the Aussie jumped up on the news.


What lies ahead


G7 Meeting

The G7 meeting is the real news queen of this weekend, especially exciting after the verbosity depicted by US President Donald Trump and his tweet-driven messages complaining about his close allies for treating the US unfairly.

Trump, true to his style, refused to endorse a joint G7 declaration calling for a reduction of tariffs.


The best description of the meeting came from a fake Angela Merkel tweet:

https://twitter.com/Queen_Europe/status/1005483518271610882

What seems a sure thing is that the underlying trade war is alive and well, with 25% tariff on steel and 10% on aluminium from the EU, Canada and Mexico, after the expiration of the exemptions, and the speedy retaliation by the affected nations. This also raised the question about how alive the NAFTA space remains.

It is likely that this war on tariffs will remain active at least until mid-term elections in November.


Trump-Kim Summit

Expect the unexpected here. When two characters like these meet, the unexpected is common.  Trump says he’ll know if Kim is serious in less than 60 seconds and calls the summit a “one time shot” for the North Korean leader.

There is almost nothing at a stake here, as Kim Jon Un has already dismantled the North Korean Nuclear Testing Installations.


FED Rate Decision

It is widely expected that FED’s rate decision next Wednesday at 18:00 GMT+2 time will be a 0.25% increase that will put the FED funds rate between 1.75%-2%.

ECB Policy Meeting

The main theme, after the comments of chief economist Peter Praet, is whether the ECB plans to end the bond purchasing program will be announced.


Bank of Japan

Friday, June 15th will see the BoJ decision on rates, which the market expects to be kept on hold.  But everybody is expecting the words of BoJ governor Kuroda regarding inflation and quantitative easing.


Technical Analysis


S&P 500

The S&P 500 is behaving very bullishly. Friday’s close was near the high of the daily range and is heading towards its next resistance area marked in cyan. We have yet to see the effect of the news coming from the G7 meeting and Trump-Kim summit, but the overall picture is bullish.


 DAX

The DAX is not that optimist, although it is close to its 2018 peak. The price looked at on a weekly chart is moving at the top of what seems to be a descending channel, and Ehlers Adaptive Cyber Cycle shows that a potential bearish leg has started.


Last Friday, the daily chart showed an opening gap that was filled during the day helped by the strength in Wall Street, but the index broke the pennant formation down and the CyberCycle oscillator also signs a possible bearish continuation.


FTSE 100

The FTSE 100 has drawn three consecutive weekly bearish candles, but each one of them with less downward impulse than its preceding one. The price is within a triangular formation so it shows a corrective movement. The question now is whether it breaks up or down.  Ehlers Adaptive Cyber Cycle points to a bearish continuation, but it has to be confirmed by price action.


The daily chart doesn’t clarify the picture much. Last Friday’s candle is bearish but with a large lower shadow, which points to the bears weren’t in control, but the price moved below the blue trend line that was supporting the minor upward leg. We have to see weakness in the other side of the Atlantic for a confirmation of this bearish continuation.


Dollar Index

The Weekly chart of the DXI shows an Evening Star formation and the Cyber Cycle indicator has signs of a cycle change. Therefore my most probable scenario is for a bearish continuation on the Dollar. This means we will see strength in the Euro, the GBP and the JPY, and possibly in the Aussie and Kiwi as well.


The daily chart shows that the downward move is a bit oversold and it needs some days of retracement or sideways movement before a continuation. Last Friday’s price has drawn a bullish hammer and Thursday’s movement bounced off the 93.24 support.


Interesting Educational Charts from last week’s action


AUDUSD  and NZDUSD 60 min Charts

This is a classic Elliott Wave 5 waves upward movement within a large Pennant formation. The break of the pattern and the 5th wave is the start of the corrective downward movement. (click ‘play’ to watch the development)


The same pattern is seen in the NZDUSD:


AUDJPY

AUDJPY had a five-wave upward movement that went to its previous top, hitting resistance. A short setup was triggered then the price pierced the bullish trendline downwards.


BTCUSD

For those crypto junkies may I present a classical bearish pennant on the BTCUSD that showed a kind of exhaustion to the upside. The breaking of this triangular formation was a very good short setup.


Categories
Forex Market Analysis

Bullish Economy at a Crossroad: Free Trade against Protectionism


Underlying Events


Last week’s volatility was fueled early Monday by Italy’s political instability as Italian president Sergio Mattarella refused to appoint Giuseppe Conte, a Eurosceptic, as Finance Minister even though he has the backing of the majority of the parliament.

Then, on May 30, as fears about Italy eased the markets focused its attention on EU officials statements against the US imposed tariffs on steel and aluminium.

“The US is playing a dangerous game by slapping tariffs on European steel and aluminium,” said Cecilia Malmstrom, warning about the consequences for economic recovery on the EU as well as US industry. (source BBC)


 Last week’s Economic Calendar was full of interesting releases


US

May’s US Consumer Confidence figure is at its historic highs, at its estimated 128.0 level, non-farm unemployment is at 3.8%, and US GDP (QoQ) grew at 2.2% a tick below estimations, while US Advance Goods Trade Balance was below expectations at -68.2b.

On the consumer front, May 31 brought us the US PCE Core (YoY) that is stable at 1.8%, the Personal Income (APR) stable at 0.3%, and Pending Home Sales (MoM) below expectations at -1.3%, below the expected 0.4%.

On the Energy Front, crude oil inventories were -3620K well below the expected 450k, while the gasoline inventories were 634K, above the expected -1200K

Finally, the USD Manufacturing figures were a bit above expectations, at 58.7 over 58.2 expected.

Eurozone

German retail sales on April (MoM)grew 2.3% well above the expected 0.5% although the yearly figure fell to 1.2% growth, below the expected 1.6%.

On the unemployment front, Germany’s May unemployment change was -11K above the expectations, and the unemployment Claims rate dropped one centile to 5.2%.

Britain’s consumer credit grew to 1.84B, above the expected 1.3B, while the mortgage approvals slightly descended to 62.5K, below the expected 63.2K

Swiss’s main figure this week was its Gross Domestic Product (YoY) for the first quarter at 2.2%, slightly below the expected 2.3%.

Japan:

JPY retail trade (YoY) grew 1.6%, above the expected 1%, while JPY retail sales figure was down -0.8% below the expected 0.2%. Also, JPY industrial production for April was up 2.5%, below the expected 3.6%.

Canada:

Last week BoC kept its interest rate unchanged at 1.25%, as was expected. However, its GDP figure for the first quarter was a disappointing annualised 1.3%, below the expected 1.8%

The overall picture of this economic background is that of a strong US economy, a not so strong Eurozone, and a possible weakening of the Canadian economy. This is especially sensitive as both Europe and Canada have a potential tariffs war against the USA. We also see weakened Japanese industrial production.

All this make us think on the continuation of the strength of the US Dollar and a further weakening scenario for the Euro, the Pound, and the Yen.


Next Week


G7

Next week lacks major economic reports and no earnings news, so markets will possibly pay attention to political developments that will fill the headlines, such as President Trump’s trade wars, or the G7 summit by the end of the week in Canada. Mr Trump is expected to arrive on Friday and meet leaders from Germany, UK, France, Italy, and Japan. A statement of the other six members of the group showed their “unanimous concern” about US tariffs.


US Trade Data.

To be released on Wednesday (14:30 GMT+2). The forecasted deficit is 50.0 B from 49B in March.


China Trade Figures:

To be released in the early hours of Friday. The expectations are for an increase of the surplus figures to $32.5B, higher than last month’s $28.8 B.

It is expected that exports will grow by 6.3% and imports to rise 16%.


RBA Policy meeting:

Due on Tuesday early morning, it will likely keep its rates unchanged at 1.5%.

We should also pay attention to the New Zealand GDP release early Wednesday.


Technical Analysis


S&P 500

The S&P 500 behave very bullishly on a weekly basis, although it suffered some drawbacks during the week. Technically the price moves inside a very steep upward channel, but right now it is close to a resistance area that matches the opening of a large red candle drawn in March. We need to watch how the price reacts here. If it is crossed next week we see a free path to head for January highs, mid-term.


Ehlers Adaptive Moving Average MAMA and cycle indicator show a bullish momentum is developing. The only black cloud in the sky is that the price is facing a strong resistance area.


DAX

The weekly chart shows that the DAX and the Euro-zone are not confident of its economic outlook.  The Index has drawn two consecutive bearish candles and we see that it shows descending lows. Its Cycle Indicator also points to the downside.

We have to pay attention next week to the US index because the DAX is correlated to it, but if we only pay attention to the technical outlook, we are more in the side of the bearish scenario.


The daily chart doesn’t change its outlook. We see that the price broke the triangular formation to the downside and tested it three times last week without being able to break it. Last Friday, although the session closed with gains, the inside candle drawn shows indecision and doubt. The most probable scenario is for the DAX to head down to test the support at 12378 level.


US Dollar Index

The US Dollar Index weekly chart shows a Spinning Top candle, while Ehlers’ Cycle indicator has changed to bearish. This may indicate that last week’s correction isn’t finished yet and we may look for a test of the Fibo 0.38 or, even to a 50% retracement, although this is less probable.


The Dollar Index daily chart’s engulfing candle that happened on May 29 has been challenged but not successfully. The Cycle indicator also points to the bearish side. Therefore our expectation is for more drops next week.


This means the Euro and GBP could still be retracing their heavy drops that started mid-May.


USDJPY

On a weekly chart the pair made an engulfing candle two weeks ago, and last week it continues moving down toward its support zone, where it bounced sharply up creating a hammer.
The price is moving mainly by its fundamentals, and now it is heading to the resistance area (green rectangle ). We may see the pair moving between those two areas for some time.


Looking at the daily chart, the pair broke the triangle formation to the upside with a large candle. The cycle indicator also points upward.
The target level is at its recent highs.