Categories
Forex Market

Covid-19 and Dow Jones: Market Collapse and Prospects

The coronavirus epidemic appeared in January 2020, but markets reacted with a collapse only at the end of February. Until then, the epidemic once widespread in China was considered local. But after the emergence of an outbreak in Italy and many other new cases in Europe, it ended the patience of traders. If we look at the context of a profound fall in production, and a break in economic ties and, Dow Jones lost more than 20% in just 3 weeks. Has the fund been reached yet? Is the coronavirus so terrible? What are the Dow Jones’ prospects for the future? Let’s try to answer the questions raised in this article.

Dow Jones Crash: Stock Market Crash Due to Coronavirus Panic

From February 21 to March 12, in just under 3 weeks, Dow Jones has lost more than 20%, plummeting from an all-time high of 29551-29219 to 23553. During the last week of February, the world market lost 5 trillion dollars. In capitalization, the US stock market lost 1.7 trillion US dollars. Financial Times rated the first week of panic as the worst since the 2008 crisis.

Dow Jones and Coronavirus: Overview of Events

Finally, an imminent coronavirus epidemic was discussed in January this year, when China began to record a truly dramatic increase in the number of people infected. The epidemic partially affected several countries in Asia, but US stock markets did not respond to this, and on February 18, Dow Jones updated its record high to 29,551. Investors felt that the epidemic was local, not dangerous, and would soon be taken under control.

Expectations for a quick solution to the epidemic were not met. On 21 February, the Italian authorities reported the first six cases, the following day there were 50. This was enough, and investors immediately withdrew their capital from all world markets for fear of the further spread of coronavirus. The mass-selling panic continued during the following week.

“Misfortunes never come alone.”

At the end of February, it was hoped that the would almost reach and the thaw would begin. At that time, according to WHO, the number of new cases recorded daily was decreasing, and markets took the news positively. In early March, Dow Jones even climbed a bit. And perhaps the upward movement could continue, were it not for the dispute between OPEC and Russia.

Another OPEC meeting was held from 4 to 6 March, where it was decided to extend the agreement ending on 1 April to reduce oil production. There is no clear justification for why Russia flatly refused to extend the agreement, but more events took place as follows:

Saudi Arabia, interested in maintaining the agreement, practically declared a price war. Saudi Aramco Corporation was instructed to offer customers record discounts (6-8 dollars per barrel). As of April 1, Riyadh will dramatically increase oil production from 9.6 million to 10, 11, and 12 million barrels per day.

There is information indicating that Russia will seek to remove US oil shale production from the market, as it ceases to be profitable when the price of oil is less than USD 40. There were also vague indications in the Russian media recently that the rouble should weaken slightly. In other words, this scenario was predictable.

On March 9, many quotes from several markets, including Dow Jones, showed another record decline. On that same day, the Dow Jones dropped 7.79% in just one day, reaching a minimum of 52 weeks. The most stable stocks were those of Walmart Inc (-0.06%), Virizon Communications Inc (-1.83%), Pfizer Inc (-3.60%). The shares of Dow Inc (-21.66%), Chevron Corp (-15.37%), Caterpillar Inc (-14.28%) fell more than all.

What Steps Should Investors Take Now?

The current situation with the expansion of coronavirus in Europe is still quite tense today. According to WHO statements, in Europe cases are increasing. Italy remains the country most affected at the moment. On March 10, the country registered around 1000 new cases of the disease and 168 deaths, the country is now under lock and key. Ukraine, Poland, the Czech Republic are entering quarantine. Cases of the disease have already been reported in Turkey, Georgia, Bolivia, Panama, and Jamaica. Analysts believe that in developing countries (e.g., CIS), statistics could be even sadder because, for various reasons, coronavirus cases can be diagnosed as regular flu or simply hidden.

But not everything is so bad. China has officially declared that the coronavirus epidemic is fading in the country. The growth rate of the disease in recent days is 0.023%, the number of new cases of coronavirus is 10.03, 74% of those infected have already recovered, 16 temporary hospitals have been closed.

Although WHO has described the outbreak of coronavirus as a pandemic, the organization admits that the common flu occurs every year and that between 40 and 45 million people are infected, 600,000-650,000 of them die from the flu or its complications. WHO fights with new types of viruses every year, however, this does not result in such a dramatic collapse of markets, panic, and quarantine.

Based on the above, there are certain unknowns:

Who will benefit from the coronavirus-fueled panic? Corporations lose billions, transport communications (logistics, tourism) are interrupted, production volume decreases. But, if the coronavirus mortality rate is 3.4% (WHO data), and the flu/pneumonia mortality rate is 7.1% (CDC data, USA), could the problem be exaggerated? Although statistical data can be skilfully manipulated, only the coronavirus can be compared with influenza or tuberculosis.

Is the coronavirus the most important reason for the Dow Jones accident? Was the pandemic just a trigger? Could it be the last straw in the US stock market that had been pushed extremely hard before?
The solution to these unknowns will give us a clue about the future of the global stock market, including Dow Jones.

This looks like this:

Optimistic: It took China two months to fight the epidemic. The coronavirus is at its peak in Europe, so the situation will be uncertain for at least a month. During this time, the Dow Jones can lose another 10% or more in a panic and drop to 2018 levels. Given the performance of the index in recent years, things are not so bad.

WHO officials point out that the epidemic in China may have begun to decline due to warming, as the virus is supposed to die at high temperatures. The world community should therefore begin to calm down as early as May. Meanwhile, Russia and Saudi Arabia should agree on oil prices (no one benefits from current oil prices), so another problem of geopolitical and trade uncertainty will be solved. The US shares that reached the bottom in May should roll back to historic highs again, amid optimism, the resumption of trading and economic activities, and increased business activity. Although the shares will barely cover the losses quickly, investors, having entered long positions at the lows, will be able to earn 15-20% from Dow Jones alone.

Pessimistic: Panic in the midst of the coronavirus pandemic will fade, yet it will be remembered for a long time. Despite the injection of cash from central banks, the global community will not quickly restore the previous pace of economic growth. That’s why stock markets will recover very slowly if they do. Dow Jones’ situation is even more complicated. Analysts predict that the US stock market is overheated. According to wave theory, a long-term crisis should now begin. And if at the end of February the recession could be called local, there is now a bearish trend. The bearish trend could be strengthened in the midst of the US presidential election this fall. At best, Dow Jones will shrink further and consolidate at the bottom until the end of the year. In the most tragic scenario, the situation in 2008 can be repeated.

Categories
Crypto Market Analysis

Daily Crypto Review, Dec 26 – Youtube censoring crypto-related videos; content creators have spoken

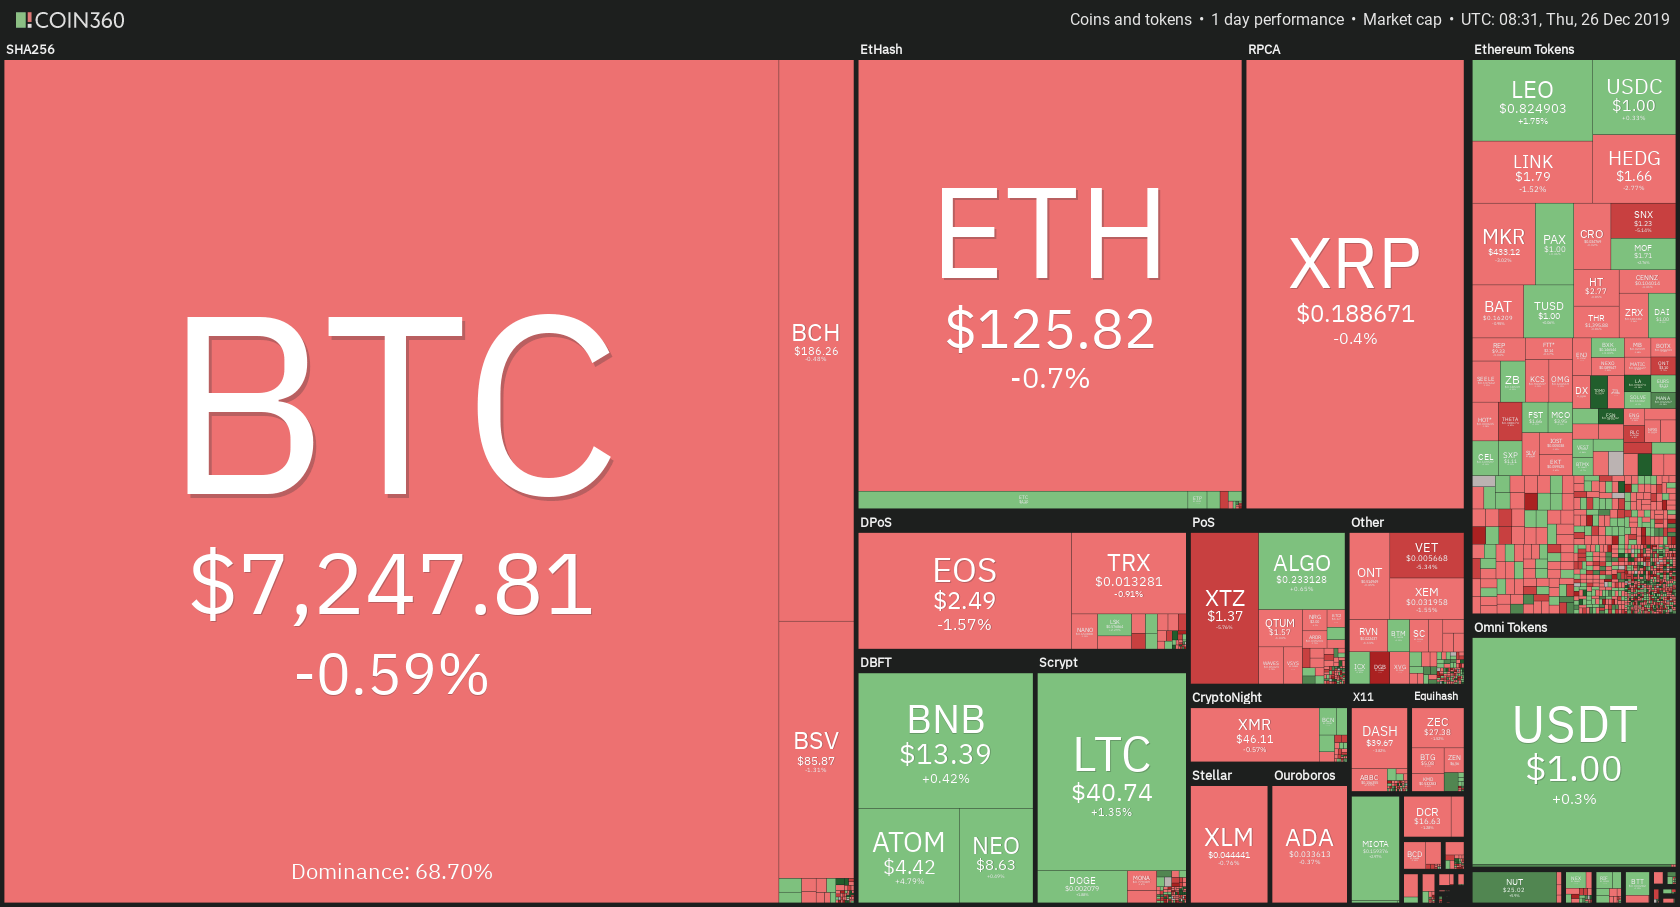
Bitcoin, along with the rest of the cryptocurrencies, didn’t move much during Christmas. The price tanked a bit due to a lack of volume, but the price drops are sporadic and negligible. Bitcoin’s price went down by 0.59% on the day. It is trading for $7,247 at the time of writing. Meanwhile, Ethereum lost 0.7%, while XRP lost 0.4%.

Tomo Chain gained 21.44% on the day, making it the biggest daily gainer. The biggest loser of the day was Silverway, which lost 7.88% of its value when compared to yesterday.

Bitcoin’s dominance gained half a percent during Christmas time. Its dominance is now at 68.7%, which represents an increase of 0.5% from when we last reported.

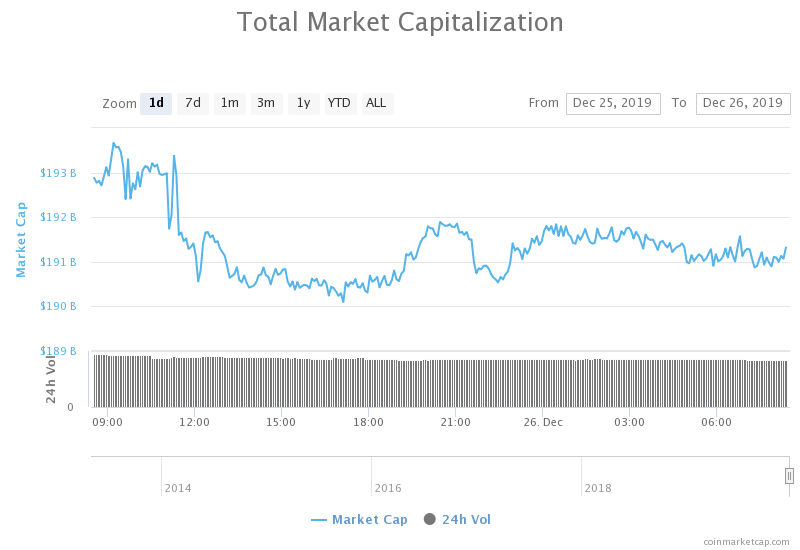
The cryptocurrency market capitalization lost around four billion dollars during Christmas. It is currently sitting at $191.32 billion at the time of writing. This represents a decrease of $3.69 billion when compared to the value it had 24 hours ago.

What happened in the past 24 hours

YouTube, the biggest video-sharing social media platform, has unexpectedly started to delete cryptocurrency-related content from the platform. Both big and small content creators are affected.

Countless Twitter and Reddit threads popped up, all about YouTube suddenly deleting a number of crypto-related videos Dec. 23. On top of the video deletion, YouTube sent out an official warning to content creators in the form of a “strike.” When the account gets “struck” 3 times, it gets shut down.

YouTube has yet to respond on why it censored these videos.

_______________________________________________________________________

Technical analysis

_______________________________________________________________________

Bitcoin

Bitcoin spent Christmas losing some value, but the loss is almost insignificant. Its price did fall under the 38.2% Fib retracement line of $7,260. After falling under the support level which now turned resistance, Bitcoin seems to have consolidated near the top of the range.


Bitcoin’s volume was quite low, which can be explained by the holidays. Its RSI was quite stable and around the middle of the value range.

Key levels to the upside                    Key levels to the downside

1: $7,260                                           1: $6,940

2: $7415                                            2: $6,640

3: $7,525                                           3: $6,415


Ethereum

Ethereum also spent Christmas losing some of its value. The price is still contained within the resistance of $128.1 and support of $122.5. The price is now consolidating in the middle of the range.


Ethereum’s RSI level is currently on the rise, with the volume being on the lower end of the spectrum.

Key levels to the upside                    Key levels to the downside

1: $128.1                                             1: $122.07

2: $130                                               2: $117

3: $141.15


Ripple

XRP’s broke a key support during Christmas. Its price dropped below $0.19 and could not make it back above. It is now consolidating just below this level, which currently acts as resistance. XRP has quite a free fall if it decides to drop in price. The next support level is at $0.178.


XRP’s volume is, just like Ethereum’s and Bitcoin’s, pretty low. This is, again, most likely due to fewer traders being involved with the market during the holidays. The key level of $0.19 is now acting as resistance.

Key levels to the upside                    Key levels to the downside

1: $0.19                                              1: $0.178

2: $0.198                                            2: $0.1678

3: $0.2058

Categories
Forex Forex Brokers

YLD FX Review

YLD FX is a Forex and CFD broker located offshore. There is no mention on their website of exactly where they are based which is rather strange, to say the least. A look on their Facebook page suggests that they are based in Saint Kitts and Nevis though. YLD FX was built by traders and for that reason, they claim to know exactly what traders want in a broker – tight spreads, good customer support, fast execution and most of all minimal slippage. There is no mention on their website as to when they were established.

Account Types

There are no tiered accounts with YLD FX so everyone trades under the same conditions.

Platforms

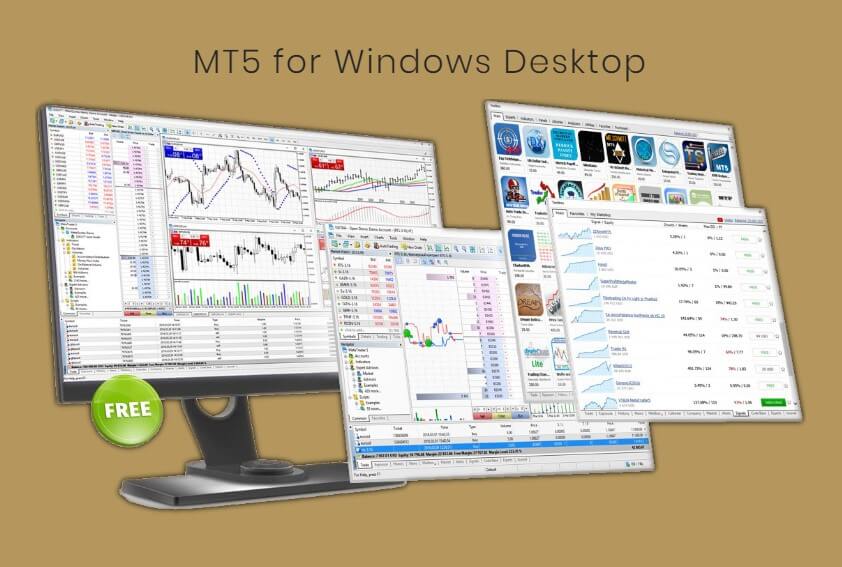
It appears that the only option available is MT5 which will probably turn a lot of potential new customers away as many traders prefer to use MT4. The MT5 platform can be downloaded to Windows desktops, Apple OSX desktops, and Android devices. MT5 also has a web browser option which can be accessed via any operating system.

Leverage

YLD FX offer Forex leverages of:

  • 1:50
  • 1:100
  • 1:200
  • 1:300
  • 1:400

Trade Sizes

There is no mention of minimum trade sizes anywhere on their website and as they don’t reply to emails or questions on their Facebook page this will remain a mystery.

Trading Costs

Again, not much information about this on their website so hard to say what (if any) the trading costs are.

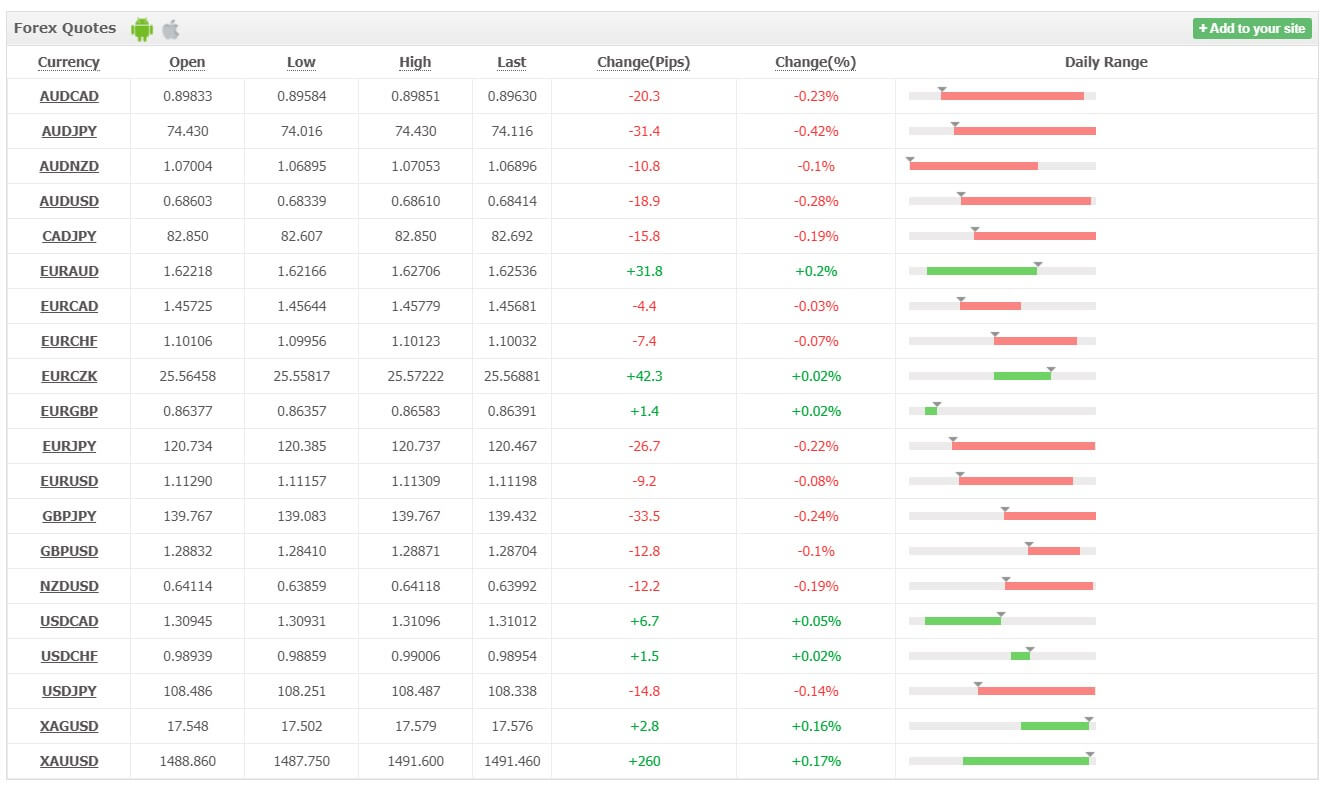
YLD FX’s Forex heat map.

Assets

Assets available to trade are the usual currency pairs, indices, commodities, precious metals, and stocks. I don’t see any sign of any crypto assets being available to trade.

Spreads

The spreads are not terrible and I’d say they were slightly lower than the industry average.

Liquidity Providers

YLD FX provides an (HFT) High-Frequency Trading liquidity provider to give minimal slippage and competitive spreads.

Minimum Deposit

Minimum account deposits are £200, $250 or €250. These are relatively high these days in my opinion.

Deposit Methods & Costs

Only one deposit option and that is by secure bank transfer. YLD FX does not charge any fees for account funding. They do not cover any of the fees your local bank may charge.

Withdrawal Methods & Costs

YLD FX offers secure bank transfer account withdrawals with zero % fees. They cover all outgoing bank fees that are visible to them. They do not cover any of the fees your local bank may charge.

Withdrawal Processing & Wait Time

There is no reference as to how long withdrawals take but given that the only withdrawal option is bank transfer then we can assume it will take days rather than hours.

Bonuses & Promotions

YLD FX does not offer deposit bonuses.

Educational & Trading Tools

YLD FX provides free educational support to assist the trader in growing their market knowledge and to perform to their best potential. I can find no evidence to support this on their website so it’s not immediately apparent how they provide this support.
They have an economic news section providing daily updates and a listing of upcoming news events which is always handy to see.

There is also a real-time price listing, heat map and Forex correlation charts showing the main pairs. Not sure how useful these are, to be honest. By far the most useless trading tool available is the YLD FX Desktop Wallpaper. This can be downloaded and installed on your desktop. There are claims that EA’s and indicators will be arriving soon.

Customer Service

YLD FX offers online chat but only during the London trading session which is a big negative. Live chat should be offered for the entire duration that traders are using the broker’s platform in my opinion. Another bad sign is their email support. I sent them an email asking some questions for the purpose of this review. At the time of writing that was 4 days ago. This is not good enough and gives the impression of an amateurish setup.

Demo Account

Demo accounts can be used with YLD FX. They appear to be free to use (and so they should be). One slight worry is that as soon as I applied for my demo account I was sent to a webpage where I was encouraged to open a live account while I was waiting for my demo account to be opened. Why would I want trade live before testing the water with a demo account and also why not just open my demo account straight away?

Countries Accepted

There is no mention of any restricted countries on the YLD FX website.

Conclusion

There is a serious lack of information about this broker on their website. Their Facebook and Twitter pages are also light on information in this regard. The customer support is poor and unresponsive. Not offering the popular MT4 platform is a big mistake in my opinion and having only one (and a slow one at that) deposit and withdrawal option is also a weak offering. On the plus side, their spreads appear to be ok and the leverages are quite high if that suits your trading style. Would I sign up with this broker?……erm No.

Categories
Forex Market

Contract For Difference (CFDs) Explained!

What is CFD?

A contract for difference (CFD) is a form of derivative trading. CFD allows a trader to speculate on prices of global financial markets such as shares, indices, commodities, and of course, currencies. While trading CFDs, a trader gets to bet on both upside and downside movements of the market. The profit and loss for CFD are calculated by taking the difference between the entry and exit prices and multiplying it by the number of units. CFDs always comes with an expiration date, before which you need to close your position. Trading these CFDs may appear sophisticated and complex in the beginning, but once you start trading them, it becomes easy to handle.

Leverage trading CFDs

CFDs are a leveraged product, which means a trader needs to maintain an optimum level of capital in their trading account to execute a trade. As it is leverage/margin trading, this capital can only be a small percentage of the full position’s value. While margin trading allows a trader to magnify their returns, losses will also be more as a trader will lose leverage times the capital he is betting on. Hence it is always recommended to go for less leverage. If you are a novice trader, we suggest you not to go beyond 2X leverage. And obviously, the gains and losses will be based on the value of a CFD contract.

Costs involved while trading CFDs

There are three types of costs a trader may incur while trading CFDs. Each of them is explained below.

Holding cost – At the end of each trading day (mostly at 5 PM New York time), if the positions are open in your account, it will be subject to a charge called ‘holding cost.’ Holding costs will depend on the CFD, direction of the position, and the holding rate.

Spread – CFDs always come with a spread, which is the difference between the buy and sell price. This price is decided by the broker, and it varies from broker to broker. A trader will have to enter a buy trade at the buy price quoted by the broker, and exit using the broker quoted sell price. The narrower the spread, the less the price needs to move in trader’s favor for their profits to start. These spreads are extremely competitive across all the brokers.

Market data charges – For getting live market feed and accurate prices, a trader must pay the relevant market data subscription fees. However, this fee is mostly applicable to stock CDFs and varies from broker to broker.

Things to remember

Like any other market, there are high risks involved in trading CFDs as well. CFDs are complex in nature (at least for novice traders), they carry a high risk, so it is important to do your research before you start trading. Also, since CFDs are leveraged products, losses can easily exceed your total investment. In volatile markets, your account balance can drop down to zero or even to a negative balance in no time. Following best trading practices like proper applying risk management to your trades will increase the chances of profiting.

We hope you find this article informative. Let us know if you have any questions in the comments below. Cheers!

Categories
Forex Course

5. How Large & Liquid Is The Forex Market?

When compared to other markets like the stock and commodity market, the foreign exchange market is the largest in the world in terms of size and liquidity. In this lesson, we shall go over some insights on the size and liquidity of the forex market.

Where is the Forex market headquartered?

The stock markets across the world have different central exchanges where all the transactions are processed. But, in the case of the forex market, there is no central exchange (physical counter) where the transactions can be processed. In fact, this market runs electronically, connected by a network of banks. This, in short, is called an interbank market or an over-the-counter (OTC) market. Hence, this enables traders to trade in the forex market from anywhere in the world. Also, this is one of the reasons for its high volume of trading.

Forex market’s volume

The amount of money traded in the forex market is humongous. Being the most traded market, the value of it reaches up to $3 trillion. The number is made up of all the types of transactions performed in the market. The amount of different transactions is listed as follows:

$1,005 billion comes from spot transactions

$1,714 billion is added from forex swaps

$362 billion accounts for outright forwards

$129 billion for estimated gaps

Currency distribution in the Forex market

There are about seven currencies on which most transactions take place. Out of these currencies, the US Dollar dominates with around 85% of all the operations in the forex market. Next up in the line stands EUR, which is then followed by JPY and GBP. A graphical representation for the same is given below.

Here, the sum of all the variables totals to 200%, as currencies are traded in pairs.

What are the Foreign Exchange Reserves?

They are the assets that comprise banknotes, bonds, deposits, etc. The central bank of a country holds these with two primary purposes. One to maintain the balance payments of a country and the second is to control the confidence in financial markets. These reserves can be held in more than one currency.

According to the International Monetary Fund (IMF), 64% of the world’s forex reserves are made up of the US Dollar. And after USD comes GBP, JPY, and EUR comprising of 4%, 4%, and 2% of the world’s FX reserves, respectively.

Liquidity of the Forex market

Liquidity is simply the possibility to square off a position smooth and quick without causing the market to make a drastic move. In simple terms, liquidity is the level of supply and demand in the market. So, when there are large numbers of buyers and sellers in the market, we can call this market to be highly liquid.

With respect to the Forex market, it is the most liquid market in the world. This implies that the forex market constitutes a large number of participants (buyers and sellers). With high liquidity, one can liquidate their positions much faster and at their quoted price. Moreover, high liquidity causes the prices to move smoothly, gradually, and in small steps. Hence, this even leads to more consistency in the quoting of prices.

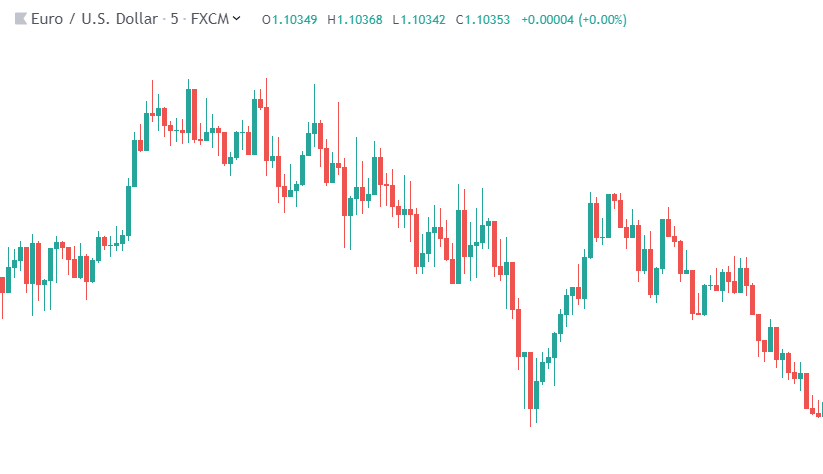
Below is the chart of EUR/USD on the 5-minute timeframe. We can see that the prices move smoothly in spite of being in a small timeframe.

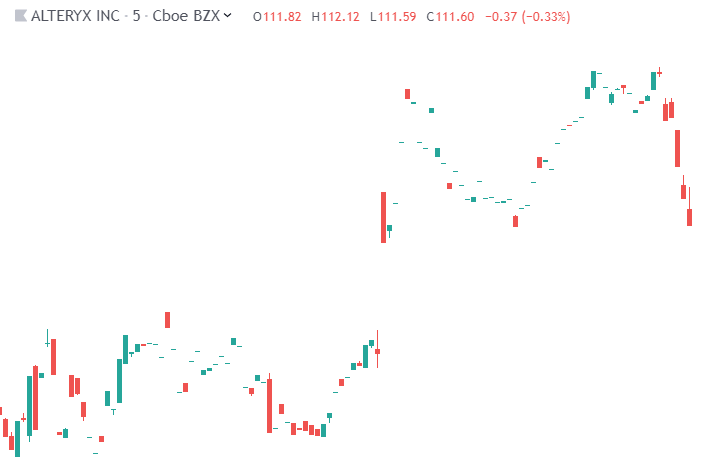
Below is the chart of a small-cap stock in the US. Here, we can see that the prices are not moving in a flow, and there are gaps between the prices. And this is solely due to the lack of liquidity in the market.

That’s about the liquidity of the Forex market. We hope you had a good read. Check your learnings by answering the below quiz.

[wp_quiz id=”42489″]
Categories
Forex Market Analysis

Markets’ Attention On Summer


Weekly Update (July 9th – 13th)


Macroeconomic Outlook

Summer is in focus now, and with it, the attention on the multiple factors that will condition whether it will be a good summer for the markets or a bad one.

Nevertheless, all these factors that unnerve investors are reaching a final outcome.

  • Last week, the markets performed better as the matters that block them improved slightly.
    • European policy and German politics have reached an outcome.
    • Then oil, which is still a problem.
    • And protectionism which is something more bilateral between China and USA rather than global.
      • When the market realises that, it will care less about it.

We were expecting a hard summer, however, the markets are starting to react in a positive way sooner than expected.

This week has three main references:

  • On Tuesday, the German ZEW Economic Sentiment which is expected to be negative again for the fourth month in a row.
    • It is relevant enough to watch out for but nothing especially important as the overall German economy has been increasing recently at 2.5% in the last trimester, which is really good.
  • On Thursday, there is US Core CPI which is forecasted to rebound from 2,2 to 2,3. This issue depends mostly on oil prices.
    • Over-inflated data may hurt bonds, nevertheless structurally it will not be a real matter which could be solved in 2 or 3 months.
  • And the third reference is American corporate results which start, among the big ones, on Tuesday with Pepsi Co.
    • And on Friday, three big banks publish results
      • Citi / +23%
      • JP Morgan / +30%
      • Wells Fargo / +11% and with some legal problems
    • They are expected to be really solid which will support markets.

Hence, this week looks like where a more positive sentiment towards markets can be consolidated.

  • German political turmoil looks clearer than before.
    • Even though it will come back in October with the elections.
  • Regarding oil, American pressures regarding an increase in production are graspable which will lead to Saudi Arabia producing more, and reducing oil prices.
    • This will reduce inflation related concerns.
  • Then, there is the protectionism which is mostly between the USA and China, being something more local rather than something global.
    • So that, when the market realises that along with strong corporate results, a good economic growth and a lot of liquidity, it will lead to an overall favourable economic cycle which will support the markets.
Categories
Forex Market Analysis

Bullish Economy at a Crossroad: Free Trade against Protectionism


Underlying Events


Last week’s volatility was fueled early Monday by Italy’s political instability as Italian president Sergio Mattarella refused to appoint Giuseppe Conte, a Eurosceptic, as Finance Minister even though he has the backing of the majority of the parliament.

Then, on May 30, as fears about Italy eased the markets focused its attention on EU officials statements against the US imposed tariffs on steel and aluminium.

“The US is playing a dangerous game by slapping tariffs on European steel and aluminium,” said Cecilia Malmstrom, warning about the consequences for economic recovery on the EU as well as US industry. (source BBC)


 Last week’s Economic Calendar was full of interesting releases


US

May’s US Consumer Confidence figure is at its historic highs, at its estimated 128.0 level, non-farm unemployment is at 3.8%, and US GDP (QoQ) grew at 2.2% a tick below estimations, while US Advance Goods Trade Balance was below expectations at -68.2b.

On the consumer front, May 31 brought us the US PCE Core (YoY) that is stable at 1.8%, the Personal Income (APR) stable at 0.3%, and Pending Home Sales (MoM) below expectations at -1.3%, below the expected 0.4%.

On the Energy Front, crude oil inventories were -3620K well below the expected 450k, while the gasoline inventories were 634K, above the expected -1200K

Finally, the USD Manufacturing figures were a bit above expectations, at 58.7 over 58.2 expected.

Eurozone

German retail sales on April (MoM)grew 2.3% well above the expected 0.5% although the yearly figure fell to 1.2% growth, below the expected 1.6%.

On the unemployment front, Germany’s May unemployment change was -11K above the expectations, and the unemployment Claims rate dropped one centile to 5.2%.

Britain’s consumer credit grew to 1.84B, above the expected 1.3B, while the mortgage approvals slightly descended to 62.5K, below the expected 63.2K

Swiss’s main figure this week was its Gross Domestic Product (YoY) for the first quarter at 2.2%, slightly below the expected 2.3%.

Japan:

JPY retail trade (YoY) grew 1.6%, above the expected 1%, while JPY retail sales figure was down -0.8% below the expected 0.2%. Also, JPY industrial production for April was up 2.5%, below the expected 3.6%.

Canada:

Last week BoC kept its interest rate unchanged at 1.25%, as was expected. However, its GDP figure for the first quarter was a disappointing annualised 1.3%, below the expected 1.8%

The overall picture of this economic background is that of a strong US economy, a not so strong Eurozone, and a possible weakening of the Canadian economy. This is especially sensitive as both Europe and Canada have a potential tariffs war against the USA. We also see weakened Japanese industrial production.

All this make us think on the continuation of the strength of the US Dollar and a further weakening scenario for the Euro, the Pound, and the Yen.


Next Week


G7

Next week lacks major economic reports and no earnings news, so markets will possibly pay attention to political developments that will fill the headlines, such as President Trump’s trade wars, or the G7 summit by the end of the week in Canada. Mr Trump is expected to arrive on Friday and meet leaders from Germany, UK, France, Italy, and Japan. A statement of the other six members of the group showed their “unanimous concern” about US tariffs.


US Trade Data.

To be released on Wednesday (14:30 GMT+2). The forecasted deficit is 50.0 B from 49B in March.


China Trade Figures:

To be released in the early hours of Friday. The expectations are for an increase of the surplus figures to $32.5B, higher than last month’s $28.8 B.

It is expected that exports will grow by 6.3% and imports to rise 16%.


RBA Policy meeting:

Due on Tuesday early morning, it will likely keep its rates unchanged at 1.5%.

We should also pay attention to the New Zealand GDP release early Wednesday.


Technical Analysis


S&P 500

The S&P 500 behave very bullishly on a weekly basis, although it suffered some drawbacks during the week. Technically the price moves inside a very steep upward channel, but right now it is close to a resistance area that matches the opening of a large red candle drawn in March. We need to watch how the price reacts here. If it is crossed next week we see a free path to head for January highs, mid-term.


Ehlers Adaptive Moving Average MAMA and cycle indicator show a bullish momentum is developing. The only black cloud in the sky is that the price is facing a strong resistance area.


DAX

The weekly chart shows that the DAX and the Euro-zone are not confident of its economic outlook.  The Index has drawn two consecutive bearish candles and we see that it shows descending lows. Its Cycle Indicator also points to the downside.

We have to pay attention next week to the US index because the DAX is correlated to it, but if we only pay attention to the technical outlook, we are more in the side of the bearish scenario.


The daily chart doesn’t change its outlook. We see that the price broke the triangular formation to the downside and tested it three times last week without being able to break it. Last Friday, although the session closed with gains, the inside candle drawn shows indecision and doubt. The most probable scenario is for the DAX to head down to test the support at 12378 level.


US Dollar Index

The US Dollar Index weekly chart shows a Spinning Top candle, while Ehlers’ Cycle indicator has changed to bearish. This may indicate that last week’s correction isn’t finished yet and we may look for a test of the Fibo 0.38 or, even to a 50% retracement, although this is less probable.


The Dollar Index daily chart’s engulfing candle that happened on May 29 has been challenged but not successfully. The Cycle indicator also points to the bearish side. Therefore our expectation is for more drops next week.


This means the Euro and GBP could still be retracing their heavy drops that started mid-May.


USDJPY

On a weekly chart the pair made an engulfing candle two weeks ago, and last week it continues moving down toward its support zone, where it bounced sharply up creating a hammer.
The price is moving mainly by its fundamentals, and now it is heading to the resistance area (green rectangle ). We may see the pair moving between those two areas for some time.


Looking at the daily chart, the pair broke the triangle formation to the upside with a large candle. The cycle indicator also points upward.
The target level is at its recent highs.


Categories
Forex Market Analysis

Weekly Update:markets on a positive evolution

Weekly Update / April 23rd – 27th

Macroeconomic Outlook

Last week closed positively since both indexes closed positively due mainly to:

  • Strong Quarterly Results from companies
  • Less relevance in regards to the risk factors that have been influencing the markets lately
Geopolitical tension has been reduced from:
  • That punctual attach from the USA over Syria
  • New tariff barriers have not been announced from both USA & China
  • The Technology sector has recovered following Netflix results

The increase in commodity prices which has induced a drop in bond prices

  • 7/8 basis points increased in both American and German bonds

We expect that markets to continue with a positive evolution from the past two weeks

  • Mainly because of a smaller relevance of geopolitical risks and more focus on the macroeconomics and business results
Macroeconomic Data
  • We do not expect them to be outstanding but solid enough to favour the financial markets
  • Relevant Macro Data

o   Consumer Confidence in USA

o   Business & Consumer Confidence + PMIs in the Eurozone

  • Will follow the trend from recent weeks

o   Won’t touch the highs attained during this year, but data will remain within fairy good levels which will confirm the expansive economic cycle that both USA and the Eurozone are enjoying.

o   USA GDP / Previous – 2.9% – Forecast – 2.2%

  • Normal to be weaker in the first trimester in USA and then recovers in the second one
  • Not a brilliant macro but good enough not to damage the markets

o   ECB Meeting on Thursday

  • Draghi will keep its expansive monetary policy due to
  • Protectionism
  • Strengthening from the Euro against the US Dollar
  • Triple P Strategy in a monetary policy that is giving good results
  • Persistent
  • Patient
  • Prudent
  • Hence, the macro environment can be a support for the upswing in financial markets along with the positive quarterly results reported from companies

o   Companies that have reported results from the S&P 500 so far have announced an increase in the profit per share of 18 %, higher than the 17% expected

o   Solid outlook from the biggest American banks last week

o   We expect this positive climate to hold this week

  • In USA big technologies company such as Alphabet, Google, Amazon or Facebook among others report results this week
  • Good results are expected

In summary, geopolitical risks (protectionism, trade wards…) cannot be forgotten. However, they hold less importance and focus this week on the good business results.  That will confirm the validity of the current cycle of economic expansion and will offer support for prices so that markets may remain in the bullish trend of the last weeks.


Technical Outlook

USD Index

Daily Chart

It is possible to appreciate how the USD Index is not only below the 200 EMA but also broke below the weekly support that has been retesting in the recent weeks and which has not been successful so far. In the short term is facing a bearish trend line caused by its recent devaluation.

It did not break the support which has been holding on for weeks, and now it is facing the key moment between a strong support and a strong resistance. We don’t mind where it breaks this week.  We’ll wait for a retest for confirmation.

USDJPY

Daily Chart

Moving into the USDJPY, it has just bounced from a monthly bullish trend after doing a fake breakout and consequently bouncing back. A bullish trend could be considered since there are not big resistances ahead except its 200 EMA and the recent bearish monthly trend. In the short term, there are two resistances not very strong but that may cause a small retracement. However, the monthly support is stronger than the resistance it is locked up between.

This week it opened on the edge right below the resistance, so a close on Monday above it may confirm the bullish trend line.


GBPUSD

Daily Chart

GBPUSD has taken a strong change of direction. From breaking up the resistance and having a clear path upwards to heavily break the support that once was a resistance, and opening the chance for a bearish trend. We´ll wait for a retest as confirmation of the downturn.

Crude Oil

Daily Chart

Recent political events, like the recent missile attack to Syria, have created volatility in the markets and consequently, the price of oil has been on the rise. After holding to the trend line and breaking above $65 it is possible to see a retest of the recent resistances it just broke above. Without more resistances ahead, our analysis hint for the next target at $70 per barrel.

So, as expected, on Tuesday it retested both supports it previously broke. Firstly, with the daily low it retested the down trend support and with the closing price second one. Here, it confirms the retest and instantly goes up leaving the door open to $70.

DAX

Daily Chart

Regarding technical, it just broke the resistance it was holding it from weeks. Now, after a clear retest, a bullish position can be taken.


© Forex.Academy


Categories
Forex Educational Library

Profitable Trading – Chapter 1: Market Anatomy

Introduction

In their pursuit of a profitable system or strategy, traders look at past behaviors as a forward indicator of prices.

Indeed, if the price movement is an objective manifestation of the average trader sentiment, then wherever in the future the same sentiment arises, a pattern might take place with a shape similar to the one drawn in the past.  From this belief, it follows that the study of patterns may be of help to find entry and exit points in our pursuit of profits.

There is a catch, though. The human brain is a natural pattern recognizing system. We see patterns everywhere. In ordinary life, that’s the way we recognize things: A round tire, a rectangular table, or a staircase shape. When random events enter into the equation, we continue seeing patterns, although not always, they may exist. Nowadays, Technical Analysis is evolving toward a more evidence-based framework, pushed by authors such as David Aronson, Robert Carver, and others.

I’ll deal with this framework in a future article series, but, throughout the following issues, we’ll deal with the standard TA framework as a foundation for the later. We will develop a base knowledge and the tools to trade the three different market types.

Please keep in mind that, here, we’re dealing with uncertain events, so nothing is 100% sure. Sometimes not even 50% sure. But our objective when trading isn’t being right, but profitable, so as long as our overall performance is positive, the technical signal is good.

Market classification

There are three basic market types:

  • Bull markets: broad ascending trends with sporadic retracements or sideways moves or channels.
  • Bear markets: broad, descending trends with sideways movements or strong and fast bear-trap retracements.

Of course, when trading currency pairs, a bearish market in one pair is a bullish market in its inverse pair, so the tools for bear and bull markets tend to be somewhat similar, and the situations encountered quite symmetric.

Sometimes, lateral markets aren’t perfectly horizontal. The main feature of a lateral market is its increased volatility and noise. The other trait is the seemingly cyclic nature of their movements.

Anatomy of a trend

In Fig 1, we may observe a bullish trend on the EUR/AUD, back in 2015. We may see that prices move in waves. However, the crest of a new wave goes higher than its preceding one. Similarly, its valley is more elevated than preceding valleys, as well.

So, a practical definition of an uptrend is a price pattern with higher highs and higher lows. Consequently, a bearish trend, or downtrend, is, then, a price pattern with lower highs and lower lows.

Trends happen on any time-frame. Even a single bar might be classified as a bull, bear, or lateral. A candlestick with a long white body and short shadows is, in fact, a bullish trend in its tiny time-frame while a long black candle with small shadows accounts as a bearish trend.

Lateral movements on a single bar happen when the candle presents a small body, or none at all, together with long upper and/or lower shadows.

Phases of a bullish trend:

The wavelike pattern, present in most trends, is the result of phases of accumulation, distribution, and sale that draw two different kinds of patterns: One impulsive and one corrective. Every one of these phases accounts as a trend (or lateral channel) in a shorter time frame, which might be composed, at the same time, by shorter trends with its own phases of accumulation, distribution, and selling.

Accumulation phase:

In the later stages of a wave valley, there is accumulation by smart traders who think there is an excellent opportunity with low risk, forming a support level. Sometimes, this support is briefly broken to the downside; stops are taken, and, then, the price back up, again, above support.

After this last trick to fool the weak hands, price starts to climb, slowly at first, faster as momentum grows. In the final moments of this phase, price moves quickly, with substantial price increases on higher volume.

Distribution phase:

In the final stage of an impulsive phase, selling begins by smart profit takers, while the price is still rising, then it reaches overbought levels. A kind of barrier seems to have been established: It’s called a resistance level.

At those levels, more traders are willing to sell than buyers can manage, so price stagnates. Latest bulls don’t have the strength to raise prices beyond that point, but this new leg high is higher than the one in the previous impulsive phase.

Selling phase:

Price moves in a declining channel. Traders that went long at its highs close at a loss. Thus, the price moves down. Then, price recovers as if a new leg up might happen, just to fade again a bit lower than before. Several push-pull phases take place, its pattern like a fading oscillation.

Price reached a new support, and a new accumulation phase begins. Usually, this support is at or near the high of the previous impulse high. This stage draws a corrective pattern.

Phases of a bearish trend

In stock and futures markets, there is a marked asymmetry between bull and bear markets. The former being orderly and, usually, less volatile, except at its beginning, while its ending depicts exuberance and extremely positive expectations. Conversely, bear markets depict much higher volatility, together with fast, bear-trap rallies.

Sell-offs drives prices down much faster than when they are rising. Bear markets tend to be short and fast, losing between 20 to 70% of its value. On stocks, it may lose up to 95% of its value, as it happened to some tech stocks back in 2000 or bank stocks in 2008.

Currency pairs, by its own nature -currency prices moving against each other- make bull and bear phases symmetrical. The discussion above may have been the same if we swap the pair. So A bearish trend in a currency pair has identical stages because it’s just a bullish trend looked from the short side.

What is essential to be aware of is that the impulsive pattern, be it up or down, is the one where we could make more profits with reasonable reward to risk ratios. And the corrective leg (2), the product of a selling phase, is harder to trade and presents more mediocre rewards for its risks.

Fig 2 shows this behavior. We may discover that the Reward to risk channel on the impulsive phase (1) is much broader than on the reactive leg (2) when traded to the short side.

On the impulsive leg, the potential reward is more than 2x its risk, while to the short side, on a corrective phase, it’s less than one, even in the ideal case of taking profits at the lowest low of the channel.

This is a good example of why we should never fight the trend. Instead, we might use a corrective leg to add to a position or entering near support, that is, near the bottom of the channel.

Upside down, this example applies to a bear trend. Here, the impulsive leg, of course, is downward.

There are trends where the channel is more extensive, and both phases, impulsive and corrective, are equally profitable. But those cases are comparable to a sideways market, so the same kind of strategies applies there.

Sideways channels

A sideways channel happens when the price oscillates between two levels that seldom move or move up or down very slowly.  If the channel is wide enough, it may offer trading opportunities, although, usually, volatility is higher, so it’s harder to trade.

Fig 3 shows a sideways channel that took place in the EUR/GBP from Nov. 2016 until Jun. 2017.  Here, we observe there’s a floor level and a ceiling level, where bounces occur.  On this sideways channel, we could split every leg and consider each leg as a bull or bear trend, and go to a shorter time frame to trade it.

But not always, this may be possible. Fig 4 shows the price behavior on the USD/CHF pair for the last five months, from the end of May 2017, till the beginning of October. We may observe that the high volatility that takes place in the last two legs makes it difficult to differentiate impulsive from corrective.  There we must switch to a shorter time frame in search of better behaved impulsive patterns.

A final word about time frames. We should use a higher-order time frame as our guide to decide which side to trade on the shorter frame, then mark support and resistance levels and potential entry points and stops to assess the reward and its risk.

Levels, breakouts, support, and resistance

I’ll tell you here my personal view about levels, support, resistance, and breakouts. People trade their beliefs about the markets. Price is continuously moving in a struggle of two sides, while a third side is watching.

The fight is between those who believe it’ll go up and those thinking it’s already too high and must go down. If the believers on one side are less than on the other hand, price moves against them until a new consensus is made where both parties have similar power.

At price levels where the power of bulls and bears is similar, the price cannot move up or down any longer, until one of the parties weaken or the other gets more strength. In the first case of a price going up and then stagnating, the level is called resistance. The case of a price falling and then stopping its downfall is called support.

On the occasions when the price is pushed beyond resistance, it’s called a breakout. If the price crosses a support level to the downside, it’s called a breakdown. Sometimes the breakout or breakdown is of short duration, price resuming to its previous levels after a few bars. In such cases, it’s called a failed breakout or a failed breakdown. Thus, the passing of time confirms the breakout or breakdown. As time goes, the strength of a support or resistance level increases.

Fig 5 shows a couple of support and resistance channels with two breakouts. Please note that on the second channel, supports are located at the peaks of the sideways channel that preceded the first breakout. This is quite usual, and a persistent pattern in trading charts. Current support levels were, first, resistance levels crossed by a price breakout, becoming supports. Similarly, current resistance levels were support places that were pierced down.

Support and resistance patterns are extraordinarily useful because of their rather good predictive value. Buying at support and selling at resistance is one of the better strategies around, and not only by its success rate but also because they are locations with excellent reward to risk ratio.

Channel contractions

Channel contractions are patterns sometimes called flags and sometimes pennants, wedges, triangles, etc. Although many books about trading patterns make a differentiation between them, they are the same corrective phase, after an impulsive leg.

The critical point to remember about this type of formations is that they are excellent places to trade following the breaking direction. We don’t care which one is it. Usually, it’s a trend continuation, but that doesn’t matter much because the second most important feature of a range contraction is that at those spots, the reward to risk is increased almost double compared to its beginning point.

Fig 6 shows an example of a channel contraction, where we will be able to observe at 1 the risk at its beginning and at 2 the risk at its end. We, also, are able to see that this type of formations is a trend continuation most of the time.

In the next issue, we’ll talk about trendlines, moving averages, and channels.

That’s all for today.

©Forex.Academy


References:

I took some ideas from Essential Technical Analysis, Tools, and Techniques to Spot Market Trends by Leigh Stevens. The rest is mine.

All charts are taken from the MT4 trading platform.