Categories
Forex Market Analysis

DAX Advances in an Ending Diagonal Pattern

Overview

The German benchmark index, DAX 30 advances in the extreme bullish sentiment zone accumulating gains over 60% after the German index gained support on the March’s low at 7,957.6 pts. In spite of the up-up-up market sentiment, the DAX develops an ending diagonal pattern that is still unfinished, suggesting the current upward trend’s exhaustion.

Market Sentiment Overview

DAX 30 continues its recovery following the German index drop to 7,957.6 pts, on March 23rd, which is the lowest level since late August 2013. From Mach’s low, DAX 30 advances over 60%.

The next DAX chart presents the German index in its daily timeframe illustrates the 52-week high and low range. The German index currently develops an upward movement in the extreme bullish sentiment zone. The short-term bullish sentiment is being confirmed by the 60-day moving average, which acts as support in the latest trading sessions.

The extreme bullish sentiment aided by the DAX surpassing the opening price of the year boosted the up-up-up sentiment in the news media added with the incomplete ascending wedge that remains in progress. These signals suggest the exhaustion of the current short-term bullish trend.

On the other hand, the daily chart of the DAX Volatility Index (VDAX) shows a mostly sideways movement in the extreme bearish zone. At the same time, the lateral consolidation pattern developed by VDAX, which remains unfinished, could experience a new decline raising the possibility of further upside in the German stock market.

Consequently, the German stock market sentiment is being dominated by extreme bullish bias. However, the incomplete ascending wedge pattern suggests the exhaustion of the upward movement.

Elliott Wave Outlook

The short-term outlook of the German stock market under the Elliott Wave perspective unveils the progress on an incomplete ending diagonal pattern, developing a new upward movement.

The DAX, in its 4-hour chart, exposes the progress of an upward corrective formation that follows an internal structure of a zigzag pattern of Minute degree labeled in back. The bullish move began in the March low when the German stock market plummeted until 7,957.6 pts. 

Currently, DAX advances in its fifth wave of Minuette degree labeled in blue, which, in turn, develops an ending diagonal pattern in its internal structure. This terminal formation, subdivided in a 3-3-3-3-3 sequence of Subminuette degree, identified in green, is seen advancing in its fifth wave. This pending upward movement agrees with the likely decline in the DAX Volatility Index.

Consequently, according to the Elliott wave perspective, our short-term outlook anticipates further upsides as long as the price stays above 12,737.5 pts. This potential upside could strike the 13,544.3 pts completing the wave ((c)) of Minute degree identified in black.

Categories
Forex Elliott Wave Forex Market Analysis

DAX Remains Bullish

The German index DAX 30 advances in an upward Elliott wave sequence that suggests more upsides in the following trading sessions.

DAX, in its mid-term Elliott wave outlook illustrated in the 4-hour chart, reveals the recovery that the German index develops in an incomplete zigzag pattern, which corresponds to wave B of Minor degree.

According to the Elliott Wave theory, a zigzag pattern is a corrective formation subdivided into a five-three-five sequence (5-3-5)

Once DAX 30 price had topped at its all-time high of 13,828.8 pts, it began a sharp selloff that ended on the March 19th low at 7,957.6 pts. Then, the German index began to show recovery signals, developing a bullish sequence into five waves of Minuette degree labeled in blue, which ended on April 30th at 11,340.1 pts. This movement led the DAX 30 to complete wave ((a)) of Minute degree labeled in black.

On the other hand, as the price advanced in the first part of the corrective wave, on the RSI oscillator, we observe that the leading indicator surpassed the 60 level and found support at 40, confirming the bullish bias of the corrective structure. At the same time, the progress in the wave ((b)) of Minute degree labeled in black pierced bellow the 40 level, leading us to confirm the end of the three-wave movement.

Once the German index completed its wave ((b)), the market participants kept pushing the price upwards, increasing the bullish momentum of wave (iii) of Minuette degree which jumped up to 12,398 pts on June 08th, reaching its highest level since February 26th. After this high, DAX 30 started to develop its wave (iv) that elapsed until June 29th when the price began to advance in a new upward sequence, which currently looks incomplete.

In the 4-hour chart, we distinguish the DAX30 moving in an incomplete bullish sequence, which could be advancing in its wave iii of Subminuette degree labeled in green. On the other hand, the bullish breakout and consolidation observed in the RSI oscillator over the 60-level lead us to maintain our outlook for further upsides on the German index for the following trading sessions.

The projection made using the Fibonacci extension from the wave ((a)) lead us to foresee a rally continuation that could find resistance at 13,544.3 pts, which coincides with the 100% of Fibonacci extension. In other words, this bullish continuation could complete the 100% of equal waves between waves ((a)) and ((c)). There exists a possibility that the German index continues advancing further to 14,464.3 pts, corresponding to 127.2% of the Fibonacci extension.

In conclusion, our main outlook foresees more upsides for the following trading sessions. Furthermore, the bullish outlook will be valid while the German index remains above 12,085.5 pts, which coincides with the end of wave ii of Subminuette degree identified in green. If this scenario happens, it would be indicative that the wave (iv) is incomplete, and DAX 30 will continue consolidating, as the bullish pressure would decrease over time.

Categories
Forex Market Analysis

Daily-Active Day for European Assets; Heaving Data Awaits!

NZD/USD

With this kind of clear ending diagonal on the last 5th wave and daily Doji candle confirmation, retrace up was highly anticipated, as you can see in our previous analysis we suggested buying NZD/USD at 0.6530, with the stop below the previous low and the target of at least 300 pips. On H1 chart the pair very precisely has drawn 5 legs up, and it retraced to Fibo 0.38% level, which is also very usual for the second wave retrace. The direction is UP, but alternatively, we could see some flat correction again to our entry point around 0.6835, which can bring us one more opportunity to add to the buying position. In any case, we do suggest to sit tight with this long position, stay patient, and wait for solid profit.


DAX

The index does not show a very clear picture. It is drawing more complex pattern a double tree, and it’s very tricky, but in any case, this recently retraces up, should come in at least 3 legs up. So we will track the scenario of an ABC pullback up like it is shown on the chart. Cautious required.


GBP/USD

Obviously, GBP/USD rebounding up. The only thing that we should calculate is our projection for this retrace ending. We do believe that current retrace could be labelled as wave 2, so we will expect to be done anywhere from 0,38% Fibonacci retracement. Our current projection, as it is shown on the chart is short-term long, and long-term short, so the pair brings opportunity for any tastes, wheater you are a long or short-term trader.


USD/JPY

Obviously, this is a weekly chart, and this is a long-term perspective. Currently, we are tracking the triangle, which is very usual for the 4th Elliott wave. Price action in this wave often tends to range, without a clear trend move. As you can see on the chart we have perfectly labelled a,b,c,d leg and we now expect pull back down for e leg, which will represent finish of the 4th wave, and we should expect resume of an uptrend for the wave 5 up.


EUR/USD

As we already highlighted we are tracking pullback leg 3 or C from the zigzag A-B-C pattern after 5 waves down were completed all the way down from the 24.January high in EUR/USD. The area around 50% Fibonacci retracement or 1.1930, is our targeted region for this long position. The reason behind it is that wave A and wave C tend towards equality in length, and that retracement for the pullback of the second wave usually comes to 0,50 to 0,618% Fibo levels. But, this pullback down, may not be done yet, and before we test our projected profit target of 1,1930, we may see pullback down below 1,1520.


Categories
Forex Market Analysis

Daily: Markets are Calmed Ahead of a New Fresh Wave of U.S Tariffs


NEWS COMMENTARY


The U.S.-China trade spat will likely remain a key driver of sentiment this week ahead after reports said U.S. President Donald Trump wants to move forward with tariffs on $200 billion in Chinese goods.

U.S.-China trade-war fears have been simmering for months. Neither side is showing any signs of backing off, fueling worries that the world’s two largest economies are spiraling towards a trade war that could shake the global economy.

Besides trade rhetoric, the U.S. will see a relatively quiet week in terms of economic releases, with a report on the housing sector expected to draw the most attention.

The tariff level will probably be about 10%, as the Wall Street Journal reported, quoting people familiar with the matter. This is below the 25% the administration said it was considering for this possible round of tariffs. The decision comes despite a Treasury invitation last week to senior Chinese officials, including Vice Premier Liu He, for further negotiations to reach a calm resolution of this matter. Trump has demanded that China cut its $375 billion trade surplus with the United States, end policies aimed at acquiring U.S. technologies and intellectual property and roll back high-tech industrial subsidies.

On other hand, in spite of disappointing inflation and retail sales data released on Thursday, the USD Index managed to recover some of the lost ground afterwards, closing the previous week with indecisiveness about future moves. However, such a recovery is expected to be short-lived as the underlying economic indicators lack of the strenght to represent any serious impact on monetary policy. In fact, last week we experienced a typical case of market participants using fundamentals as means to print more liquidity and to reposition themselves by given economics a contrarian reading


CHART ANALYSIS


EUR/GBP

On the daily chart, the price was moving strongly in ascending channel towards the key resistance 0.91 then it dropped to 0.8895 due to

1- breaking beneath the channel after completing the wave 5 (Eliot waves)

2- the AB=CD harmonic pattern

3- the overbought on RSI

The price is about to reach 0.8845 where the descending trend and moving average 200 collide

Then, it may retrace to the resistance 0.9025 before heading the C wave target at 0.873


GBP/CAD

On the daily chart, the pair has reached decisive resistance levels, as the zone 1.7165-1.7065 pushed the price lower along with the upper side of the descending channel from the high of 2018

An AB=CD harmonic pattern has been completed as the price stopped at the B level which is located at the same zone spot

An ascending channel had been formed as a reversal flag besides a divergence on RSI to reinforce the bearish bias to the support 1.657


Categories
Forex Market Analysis

Daily: Trade War Continues; Poor US Retail Sales Data; Sterling Hitting Highs Fueled by Carney’s Remarks


NEWS COMMENTARY


Trade war

Trade talk efforts between the U.S. and China cooled after U.S. President Donald Trump suggested that he was “under no pressure to make a deal with China, they are under pressure to make a deal with us”, Beijing was quick to shrug off the claim.

“The Trump administration should not be mistaken that China will surrender to the U.S. demands,” state run China Daily published on Friday.

“It has enough fuel to drive its economy even if a trade war is prolonged,” the paper insisted.


Retail sales data

Coming after Thursday’s weaker-than-expected inflation data, shopping takes the spotlight in economic indicators with numbers on retail sales and consumer sentiment arrived soft as well, as retail sales came 0.1% under expectations of 0.4%,  with core retail sales followed it to 0.3% less than forecast 0.5%. Increasing concerns that the Federal Reserve could ease its monetary policy.


Surging sterling

The pound hit a six-week high against the dollar on Friday as Bank of England governor Mark Carney reportedly warned that a no deal Brexit would likely mean higher interest rates.

Carney warned that if the UK and European Union were unable to forge trade deals that the result could be as bad as the 2008 financial crisis, driving the pound lower. The corresponding increase in inflation would likely require the BoE to tighten policy.

Oil

Oil prices recovered on Friday from the prior session’s sharp decline and remained on track for solid weekly gains as investors looked ahead to the latest gauge of U.S. production.

Both barrels were still on track for weekly gains of 1.8% and 2.0%, respectively, as traders await the latest data on U.S. crude production from Baker Hughes.

The U.S. rig count, an early indicator of future output, rose by 2 to 862 last week, hovering near its highest levels since March 2015.


CHART ANALYSIS


DAX

On the daily chart, we can see that the price had a bearish rally for the past six weeks until it reached the key support zone of 11900.8-11742.4

It’s also the lower side of the descending channel along with 88.6% Fibonacci

The price is technically expected to have its way up back again to the key resistance level 12582.46 which is the top of descending channel and the broken ascending trend


OIL

On the daily chart, the price is moving sideways between the support area 66.2-64.15 and the resistance area 74.45-72.45

After breaking the ascending trend, the price turned back to this support zone with bounce from an ascending trend as shown

The price now is retesting this zone with price action “pin bar”, to have a bullish movement again

So, it’s expected to go up to the resistance zone of 72.45-74.45


EUR/CHF

On the daily chart, the price is facing a punch of support levels that would it hike again due to:

firstly the key support zone 1.127-1.119, secondly the reversal pattern “wedge”, third the AB=CD harmonic pattern, and finally the divergence on RSI

the price is supposed to meet its first target at 1.1435


GBP/CHF

On the daily chart, the price had bounced from the key support level at 1.247 with engulfing price action, to reach the dash resistance level at 1.271 to retrace from it to 1.2595

the price is about to shape the second shoulder of the H&S reversal pattern, it will be assured if the price breaks through 1.271

followed by divergence on RSI, the price is expected to reach the resistance level 1.285 where to meet the upper edge of the descending channel


Categories
Forex Market Analysis

Daily: busy day of ECB, BoE, and US CPI


NEWS COMMENTARY


It’s a busy day with two central banks meetings along with the US consumer price index

But as always, starting with the trade war the major issue that moves the markets, China accepted an invitation by the United States to hold a new round of trade talks, raising hopes for a deal easing the tariff war between the world’s two biggest economies.

Chinese Foreign Ministry spokesman Geng Shuang said earlier that Beijing had received the invitation and welcomed it, adding that the two countries were in discussion about the details.

The Trump administration had invited Chinese officials to restart trade negotiations

This comes after President Donald Trump warned last week that there could more trade tariffs against Beijing totaling $267 billion, on top the already $200 billion in tariffs previously announced.


US consumer price is expected to have risen 0.3% last month and 2.8% over the prior year, according to estimates.

The U.S. central bank is widely expected to raise interest rates at its September meeting, but odds for another move in December have decreased in recent days.


The European Central Bank is all but certain to keep interest rates at their current record low levels, making only nuanced changes to its guidance to stay on course to end bond purchases this year and raise interest rates next autumn.

With Thursday’s decision, the ECB’s deposit rate, currently its primary interest rate tool, will remain at -0.40% while the main refinancing rate, which determines the cost of credit in the economy, will remain at 0.0%.


The Bank of England is also expected to hold fire after raising interest rates last month. If all goes as expected, the British central bank will keep rates at 0.75%

Investors will look closely at the breakdown of votes on the nine-member Monetary Policy Committee for further indications on the timing of the next rate increase.

Comments regarding the ongoing Brexit negotiations will also be in focus.

Expectations of another BoE rate hike are only seen in the second half of next year, given Britain’s plans to leave the European Union in March.


Positive data came from the Australian employment change which hiked up to 44.0K higher than expected 16.5K


CHART ANALYSIS


DAX

On the daily chart, we can see that the price had a bearish rally for the past six weeks until it reached the key support zone of 11900.8-11742.4

It’s also the lower side of the descending channel along with 88.6% Fibonacci

The price is technically expected to have its way up back again to the key resistance level 12582.46 which is the top of descending channel and the broken ascending trend


OIL

On the daily chart, the price is moving sideways between the support area 66.2-64.15 and the resistance area 74.45-72.45

After breaking the ascending trend, the price turned back to this support zone with bounce from an ascending trend as shown

The price now is retesting this zone with price action “pin bar”, to have a bullish movement again

So, it’s expected to go up to the resistance zone of 72.45-74.45


NZDJPY

On the daily chart, the pair is facing a punch of support levels

Firstly the key support zone 72.65-72.35, secondly the down side of the descending channel, third the AB=CD harmonic pattern, forth the double bottom reversal pattern, and finally the divergence on RSI

So, the price is supposed to get back up again to the resistance 74.01


CADCHF

On the daily chart, the pair is facing a punch of support levels

Firstly the key support level of 0.732, secondly the ascending trend from the low of 2016, third the Gartley harmonic pattern, forth the wedge reversal pattern, and finally the oversold on RSI

So, the price is supposed to get back up again to the resistance 0.762


Categories
Forex Market Analysis

Daily Review -US-EU Negotiations, Brexit Deal, UK Wages Hike, NAFTA Discussions


NEWS COMMENTARY


Markets stalled on Tuesday as uncertainty over a trade dispute between Washington and Beijing kept investors on edge.

U.S. President Donald Trump wants to impose tariffs on almost all imported Chinese goods .China’s foreign ministry said on Monday that it would respond to any new steps on trade.

.


US Trade Representative Robert Lighthizer just finished a meeting with European Trade Commissioner Cecilia Malmstrom in Brussels yesterday. Malmstrom said in a tweet that “Lighthizer discussed how the EU-US achieves concrete results in the short to medium term towards a free trade agreement.” And they’ll meet again at the end of September.

Lighthizer’s office described the talks as constructive. Also, work would be done in October to identify tariff and non-tariff barriers that could be cut. And trade chiefs of EU and US will follow up in November to finalize certain results.

However, a deal is not likely to be reached as soon as the White House administration would like


The euro rose on Tuesday as easing concerns about Italian debt boosted the single currency for a second day,

The euro was strengthened by a fall in Italian government borrowing costs this week after Economy Minister Giovanni Tria on Monday predicted yields would drop as the government lays out its much-anticipated budget for 2019


More upbeat talk from the EU negotiator sent sterling higher


Barnier said in a forum in Slovenia that “if we are realistic we are able to reach an agreement on the first stage of the negotiation, which is the Brexit treaty, within 6 or 8 weeks.” And, “taking into account the time necessary for the ratification process, the House of Commons on one side, the European Parliament and the Council on the other side … we must reach an agreement before the beginning of November. I think it is possible.”

What enhances the pound further that wages came strong at 2.6% higher than expected 2.4%, so it would be a confidence builder for pound longs


Canada and the US will restart high-level trade talks in Washington today. Whether it’s still NAFTA or not, the two sides reached a deadlock in three key issues, Canadian dairy market access, cultural exemption for Canada and Chapter 19 dispute resolution mechanism. Not much news is released regarding the discussions as both sides agreed not to negotiate in public.

Canadian Prime Minister Justin Trudeau just reiterated yesterday that “we continue to work hard and we are positively optimistic that we can get a win-win-win for all three countries.” Foreign Minister Chrystia Freeland, who’ll be in Washington today, said last week that the negotiation has entered into a “very intense phase” and the officials have been working 24-7.


CHART ANALYSIS


DAX

On the daily chart, we can see that the price had a bearish rally for the past six weeks until it reached the key support zone of 11900.8-11742.4

It’s also the lower side of the descending channel along with 88.6% Fibonacci

The price is technically expected to have its way up back again to the key resistance level 12582.46 which is the top of descending channel and the broken ascending trend


OIL

On the daily chart, the price is moving sideways between the support area 66.2-64.15 and the resistance area 74.45-72.45

After breaking the ascending trend, the price turned back to this support zone with bounce from an ascending trend as shown

The price now is retesting this zone with price action “pin bar”, to have a bullish movement again

So, it’s expected to go up to the resistance zone of 72.45-74.45


CADCHF

On the daily chart, the pair is facing a punch of support levels

Firstly the key support level of 0.732, secondly the ascending trend from the low of 2016, third the Gartley harmonic pattern, forth the wedge reversal pattern, and finally the oversold on RSI

So, the price is supposed to get back up again to the resistance 0.762


CADJPY

On the daily chart, the pair was moving bearish on the last two weeks, down from a strong resistance zone

Until it reached the key support of 83.75, followed by the ascending trend line from the low of 2018

After forming pin bar followed by bullish candle, the price is expected to hike again to the zone 86.15-86.9


Categories
Forex Market Analysis

Daily: Trade Tensions Continue, Non-Farm Payrolls, UK Growth


NEWS COMMENTARY


The U.S. dollar was lower against other currencies on Monday, as trade tensions put expectations for a Federal Reserve rate hike in September under pressure.

trade tensions with China continued, as U.S. President Donald Trump warned he would impose tariffs on $267 billion worth of Chinese imports, on top of an earlier promise of tariffs on $200 billion worth of Chinese goods.

China’s foreign ministry said on Monday that it would “respond to any news steps on trade”.

“If the U.S. side obstinately clings to its course and takes any new tariff measures against China, then the Chinese side will inevitably take countermeasures to resolutely protect our legitimate rights,” Foreign Ministry spokesman Geng Shuang said.

The US index was down despite Friday’s upbeat jobs report increasing expectations of a fed rate hike in at its next meeting September 25-26.

US non farm payrolls were close to expectations but the market is entirely focused on wages and the report showed hourly wages up 0.4% higher than 0.2% expected.

It was a different story in Canada where employment fell  to 51.6K jobs compared to +5.0K expected. Hourly wages there also fell to 2.6% compared to 3.0% previously and 3.5% two months ago

The British economy posted the fastest expansion in nearly a year as the services sector remained powerful  in the three months through July. Growth beat economist estimates to come at 0.6 & with construction output and retail also providing an enhancement. Separate figures showed the trade deficit in goods narrowed to a five-month low of 9.97 billion pounds ($13 billion) in July.


chart analysis


DAX

On the daily chart, we can see that the price had a bearish rally for the past six weeks until it reached the key support zone of 11900.8-11742.4

It’s also the lower side of the descending channel along with 88.6% Fibonacci

The price is technically expected to have its way up back again to the key resistance level 12582.46 which is the top of descending channel and the broken ascending trend


OIL

On the daily chart, the price is moving sideways between the support area 66.2-64.15 and the resistance area 74.45-72.45

After breaking the ascending trend, the price turned back to this support zone with bounce from an ascending trend as shown

The price now is retesting this zone with price action “pin bar”, to have a bullish movement again

So, it’s expected to go up to the resistance zone of 72.45-74.45


CHFJPY

On the daily chart, the pair is facing a punch of resistance levels

Firstly the key resistance 116, secondly the weekly descending line from the high of 2015, third the up side of the ascending channel which is considered as a flag, and finally the overbought on RSI

So, the piece is expected to turn back down to the support 112.8


NZDJPY

On the daily chart, the pair is facing a punch of support levels

Firstly the key support zone 72.65-72.35, secondly the down side of the descending channel, third the AB=CD harmonic pattern, forth the double bottom reversal pattern, and finally the divergence on RSI

So, the price is supposed to get back up again to the resistance 74.01


Categories
Forex Market Analysis

Weekly Technical Overview

US Dollar Index


US Dollar Index is resuming its bullish trend. Nevertheless, even though it has left behind many resistances now it is facing a horizontal resistance that will decide whether it creates a double top or breaks it and continues its run. For now, we wait to see its reaction the following week.


EURUSD


EURUSD has been moving sideways recently, mostly due to the uncertainty of the trade war between China and USA. However, in the upcoming days it should resume its bearish trend without any support ahead in the near term.


DAX


After weeks of moving sideways and without a clear direction, both fundamentals and technicals give positive reasons to be bullish at the indexes. Not only that the macroeconomic figures are forecasted to be strong but so are the quarterly results from both European and American corporations. Hence, we reopen a bullish position looking to profit the upcoming bull market.


GBPUSD 


GBPUSD is beginning the bearish trend we were waiting for. However, there is still a long way to go until it reaches the profit target. It can either resume the bearish trend or start moving sideways due to uncertainty. The next few weeks will be key to watch what happens both fundamentally and technically. For now, we remain bearish.


USDJPY


After weeks of waiting for the breakout, it is finally confirmed. Open positions have been opened waiting for the continuation of the bullish trend. It can either continue or do a retest which will eventually lead to a stronger confirmation of the breakout and the beginning of a bull run.


US Oil


Between resistances and supports there is not a clear path for oil prices apart from the many fundamental variables surrounding it. For now remain neutral awaiting a clear signal.


Categories
Forex Market Analysis

What Happened Last Week and What Lies Ahead


Last Week Wrap-up


Economic Data Today:

UK

Last week started with a slightly upbeat UK Construction PMI report that slightly beat expectations and the Pound rallied on the news. Next day,  the Market Services PMI figure at 54.0, also beating the expectations continue pushing the Pound higher.

Euro-Zone

Meanwhile, April’s Euro-zone Producer Price Index (YoY) was 2.0%, below the expected 2.4%, while the Composite PMI came at 54.0, as expected.

Then, April’s Euro-zone Retail Sales (MoM) came slightly below expectations at 0.1%  but the year over Year figure kept steady at 1.7%.

What started moving the Euro up was an ECB spokesman’s announcement on June 5th’s “live” meeting discussion regarding QE, at their next June 14th meeting, sparkling the speculation about the end of massive bond purchases.


Dax and FTSE

The DAX and the FTSE 100 were having jumpy days, with gaps down that filled during the session. Investors were nervous seeing the FTSE at its near all-time highs, while German DAX suffering was caused by not so good numbers in production and factory orders in the negative territory growth (-2.5% MoM and -0.1% YoY).


Australia

June 6th woke up with the positive news about the Australian Economic Growth (YoY) soaring above analysts expectations for the first quarter, reaching 3.1%  above a forecasted 2.8%, and the Aussie jumped up on the news.


What lies ahead


G7 Meeting

The G7 meeting is the real news queen of this weekend, especially exciting after the verbosity depicted by US President Donald Trump and his tweet-driven messages complaining about his close allies for treating the US unfairly.

Trump, true to his style, refused to endorse a joint G7 declaration calling for a reduction of tariffs.


The best description of the meeting came from a fake Angela Merkel tweet:

https://twitter.com/Queen_Europe/status/1005483518271610882

What seems a sure thing is that the underlying trade war is alive and well, with 25% tariff on steel and 10% on aluminium from the EU, Canada and Mexico, after the expiration of the exemptions, and the speedy retaliation by the affected nations. This also raised the question about how alive the NAFTA space remains.

It is likely that this war on tariffs will remain active at least until mid-term elections in November.


Trump-Kim Summit

Expect the unexpected here. When two characters like these meet, the unexpected is common.  Trump says he’ll know if Kim is serious in less than 60 seconds and calls the summit a “one time shot” for the North Korean leader.

There is almost nothing at a stake here, as Kim Jon Un has already dismantled the North Korean Nuclear Testing Installations.


FED Rate Decision

It is widely expected that FED’s rate decision next Wednesday at 18:00 GMT+2 time will be a 0.25% increase that will put the FED funds rate between 1.75%-2%.

ECB Policy Meeting

The main theme, after the comments of chief economist Peter Praet, is whether the ECB plans to end the bond purchasing program will be announced.


Bank of Japan

Friday, June 15th will see the BoJ decision on rates, which the market expects to be kept on hold.  But everybody is expecting the words of BoJ governor Kuroda regarding inflation and quantitative easing.


Technical Analysis


S&P 500

The S&P 500 is behaving very bullishly. Friday’s close was near the high of the daily range and is heading towards its next resistance area marked in cyan. We have yet to see the effect of the news coming from the G7 meeting and Trump-Kim summit, but the overall picture is bullish.


 DAX

The DAX is not that optimist, although it is close to its 2018 peak. The price looked at on a weekly chart is moving at the top of what seems to be a descending channel, and Ehlers Adaptive Cyber Cycle shows that a potential bearish leg has started.


Last Friday, the daily chart showed an opening gap that was filled during the day helped by the strength in Wall Street, but the index broke the pennant formation down and the CyberCycle oscillator also signs a possible bearish continuation.


FTSE 100

The FTSE 100 has drawn three consecutive weekly bearish candles, but each one of them with less downward impulse than its preceding one. The price is within a triangular formation so it shows a corrective movement. The question now is whether it breaks up or down.  Ehlers Adaptive Cyber Cycle points to a bearish continuation, but it has to be confirmed by price action.


The daily chart doesn’t clarify the picture much. Last Friday’s candle is bearish but with a large lower shadow, which points to the bears weren’t in control, but the price moved below the blue trend line that was supporting the minor upward leg. We have to see weakness in the other side of the Atlantic for a confirmation of this bearish continuation.


Dollar Index

The Weekly chart of the DXI shows an Evening Star formation and the Cyber Cycle indicator has signs of a cycle change. Therefore my most probable scenario is for a bearish continuation on the Dollar. This means we will see strength in the Euro, the GBP and the JPY, and possibly in the Aussie and Kiwi as well.


The daily chart shows that the downward move is a bit oversold and it needs some days of retracement or sideways movement before a continuation. Last Friday’s price has drawn a bullish hammer and Thursday’s movement bounced off the 93.24 support.


Interesting Educational Charts from last week’s action


AUDUSD  and NZDUSD 60 min Charts

This is a classic Elliott Wave 5 waves upward movement within a large Pennant formation. The break of the pattern and the 5th wave is the start of the corrective downward movement. (click ‘play’ to watch the development)


The same pattern is seen in the NZDUSD:


AUDJPY

AUDJPY had a five-wave upward movement that went to its previous top, hitting resistance. A short setup was triggered then the price pierced the bullish trendline downwards.


BTCUSD

For those crypto junkies may I present a classical bearish pennant on the BTCUSD that showed a kind of exhaustion to the upside. The breaking of this triangular formation was a very good short setup.


Categories
Forex Market Analysis

Bullish Economy at a Crossroad: Free Trade against Protectionism


Underlying Events


Last week’s volatility was fueled early Monday by Italy’s political instability as Italian president Sergio Mattarella refused to appoint Giuseppe Conte, a Eurosceptic, as Finance Minister even though he has the backing of the majority of the parliament.

Then, on May 30, as fears about Italy eased the markets focused its attention on EU officials statements against the US imposed tariffs on steel and aluminium.

“The US is playing a dangerous game by slapping tariffs on European steel and aluminium,” said Cecilia Malmstrom, warning about the consequences for economic recovery on the EU as well as US industry. (source BBC)


 Last week’s Economic Calendar was full of interesting releases


US

May’s US Consumer Confidence figure is at its historic highs, at its estimated 128.0 level, non-farm unemployment is at 3.8%, and US GDP (QoQ) grew at 2.2% a tick below estimations, while US Advance Goods Trade Balance was below expectations at -68.2b.

On the consumer front, May 31 brought us the US PCE Core (YoY) that is stable at 1.8%, the Personal Income (APR) stable at 0.3%, and Pending Home Sales (MoM) below expectations at -1.3%, below the expected 0.4%.

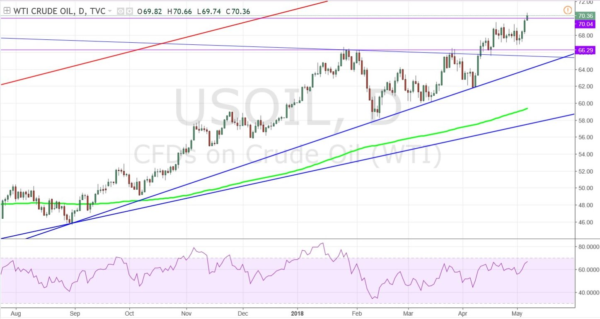
On the Energy Front, crude oil inventories were -3620K well below the expected 450k, while the gasoline inventories were 634K, above the expected -1200K

Finally, the USD Manufacturing figures were a bit above expectations, at 58.7 over 58.2 expected.

Eurozone

German retail sales on April (MoM)grew 2.3% well above the expected 0.5% although the yearly figure fell to 1.2% growth, below the expected 1.6%.

On the unemployment front, Germany’s May unemployment change was -11K above the expectations, and the unemployment Claims rate dropped one centile to 5.2%.

Britain’s consumer credit grew to 1.84B, above the expected 1.3B, while the mortgage approvals slightly descended to 62.5K, below the expected 63.2K

Swiss’s main figure this week was its Gross Domestic Product (YoY) for the first quarter at 2.2%, slightly below the expected 2.3%.

Japan:

JPY retail trade (YoY) grew 1.6%, above the expected 1%, while JPY retail sales figure was down -0.8% below the expected 0.2%. Also, JPY industrial production for April was up 2.5%, below the expected 3.6%.

Canada:

Last week BoC kept its interest rate unchanged at 1.25%, as was expected. However, its GDP figure for the first quarter was a disappointing annualised 1.3%, below the expected 1.8%

The overall picture of this economic background is that of a strong US economy, a not so strong Eurozone, and a possible weakening of the Canadian economy. This is especially sensitive as both Europe and Canada have a potential tariffs war against the USA. We also see weakened Japanese industrial production.

All this make us think on the continuation of the strength of the US Dollar and a further weakening scenario for the Euro, the Pound, and the Yen.


Next Week


G7

Next week lacks major economic reports and no earnings news, so markets will possibly pay attention to political developments that will fill the headlines, such as President Trump’s trade wars, or the G7 summit by the end of the week in Canada. Mr Trump is expected to arrive on Friday and meet leaders from Germany, UK, France, Italy, and Japan. A statement of the other six members of the group showed their “unanimous concern” about US tariffs.


US Trade Data.

To be released on Wednesday (14:30 GMT+2). The forecasted deficit is 50.0 B from 49B in March.


China Trade Figures:

To be released in the early hours of Friday. The expectations are for an increase of the surplus figures to $32.5B, higher than last month’s $28.8 B.

It is expected that exports will grow by 6.3% and imports to rise 16%.


RBA Policy meeting:

Due on Tuesday early morning, it will likely keep its rates unchanged at 1.5%.

We should also pay attention to the New Zealand GDP release early Wednesday.


Technical Analysis


S&P 500

The S&P 500 behave very bullishly on a weekly basis, although it suffered some drawbacks during the week. Technically the price moves inside a very steep upward channel, but right now it is close to a resistance area that matches the opening of a large red candle drawn in March. We need to watch how the price reacts here. If it is crossed next week we see a free path to head for January highs, mid-term.


Ehlers Adaptive Moving Average MAMA and cycle indicator show a bullish momentum is developing. The only black cloud in the sky is that the price is facing a strong resistance area.
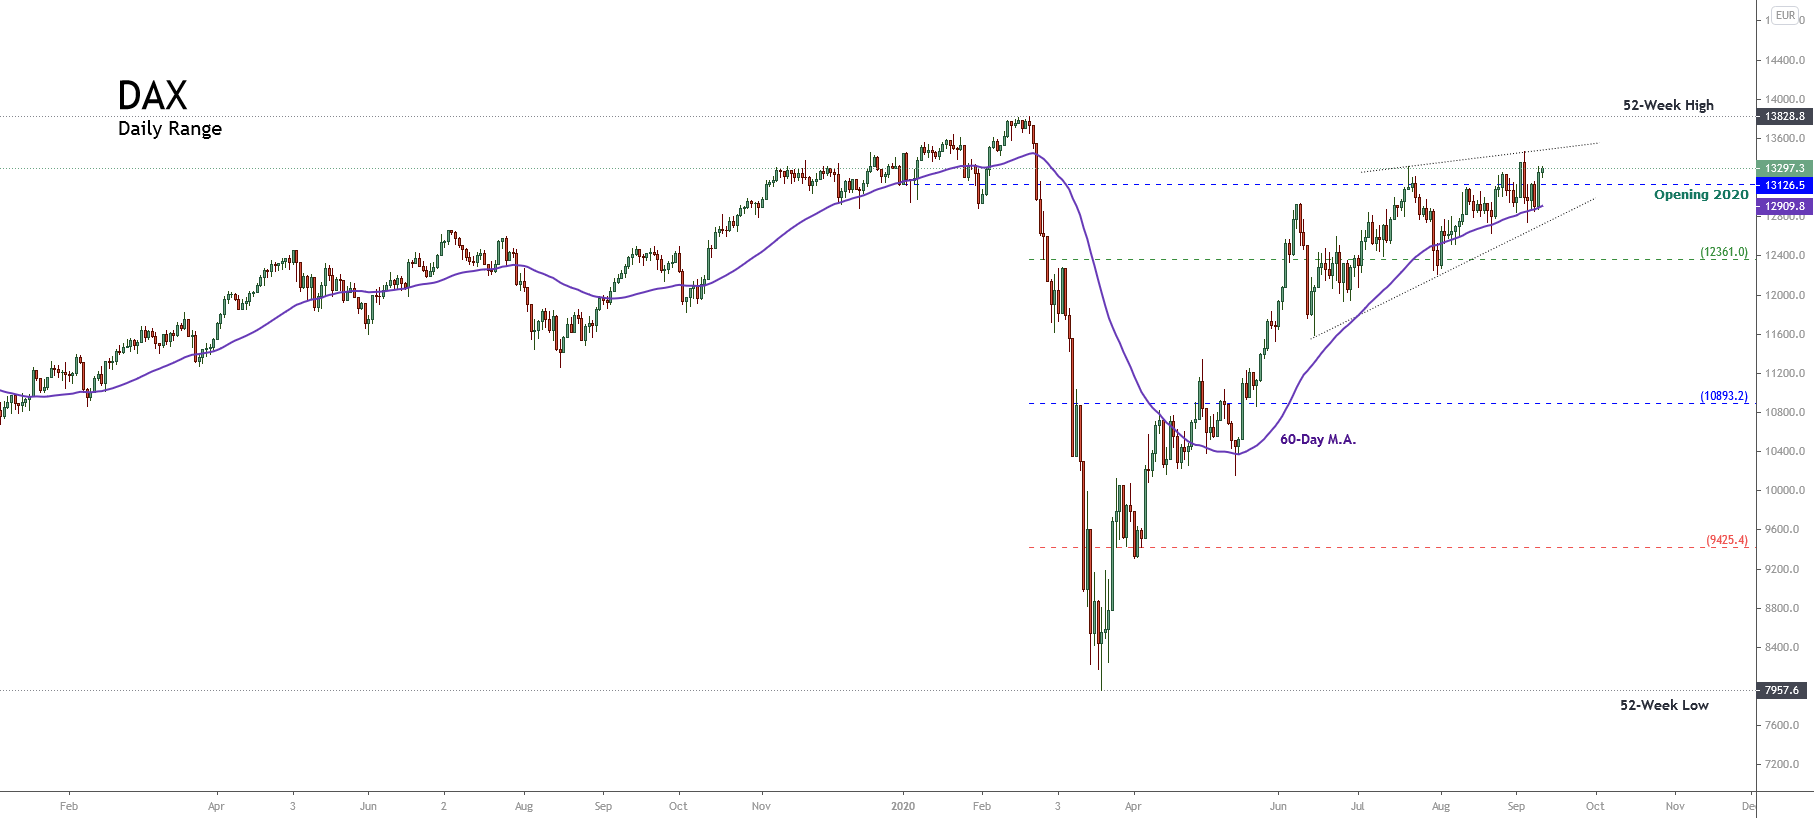
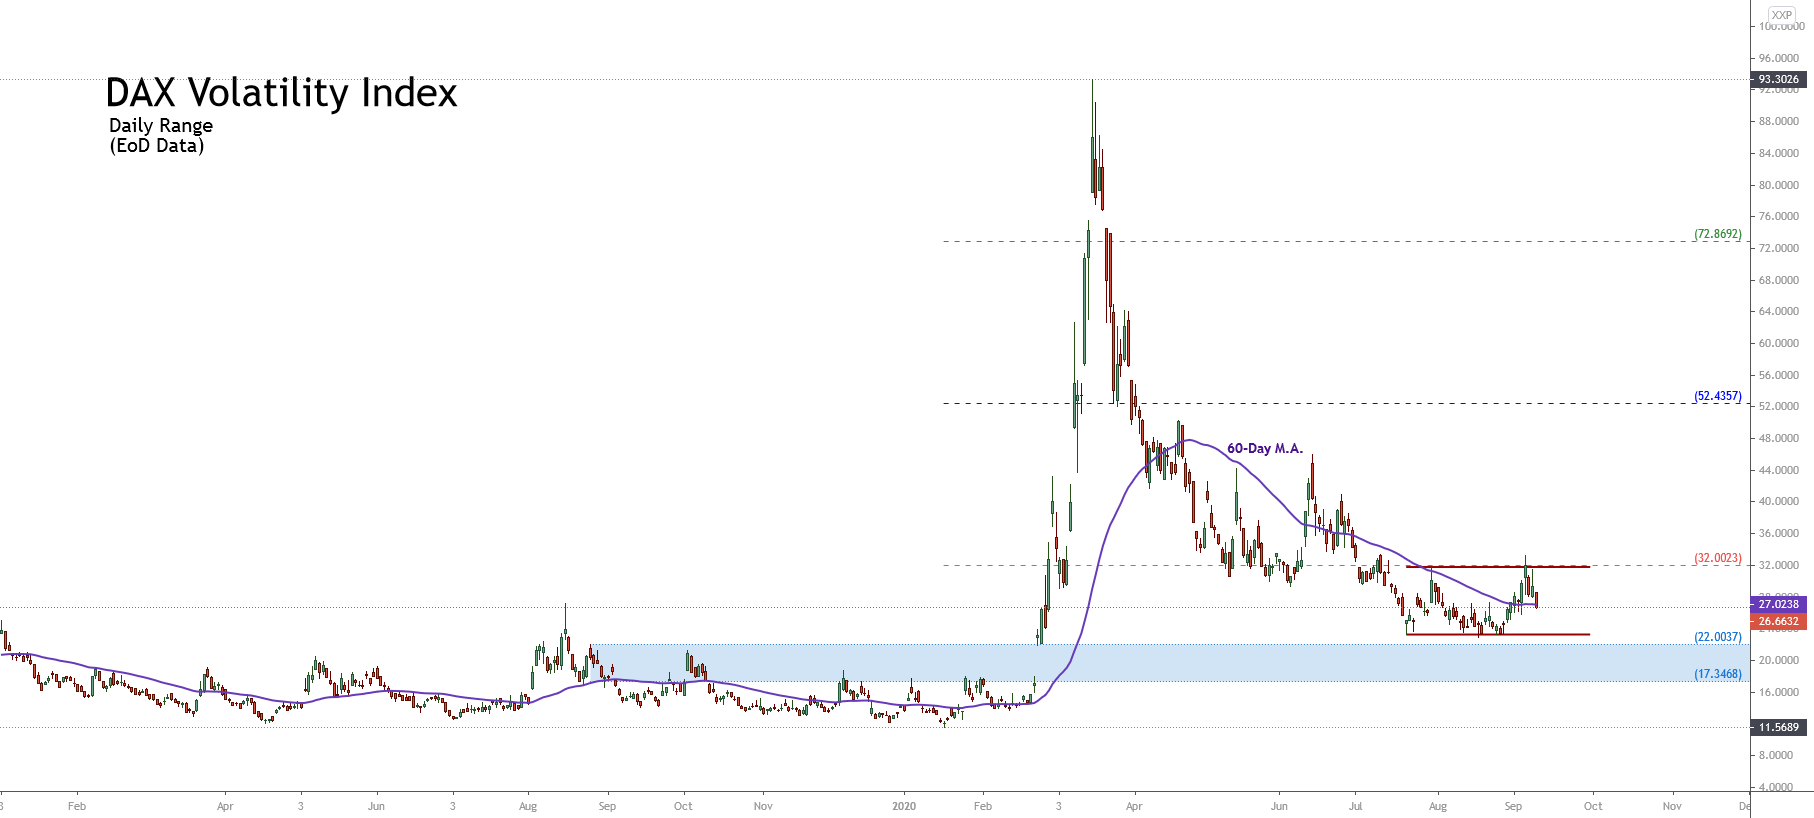
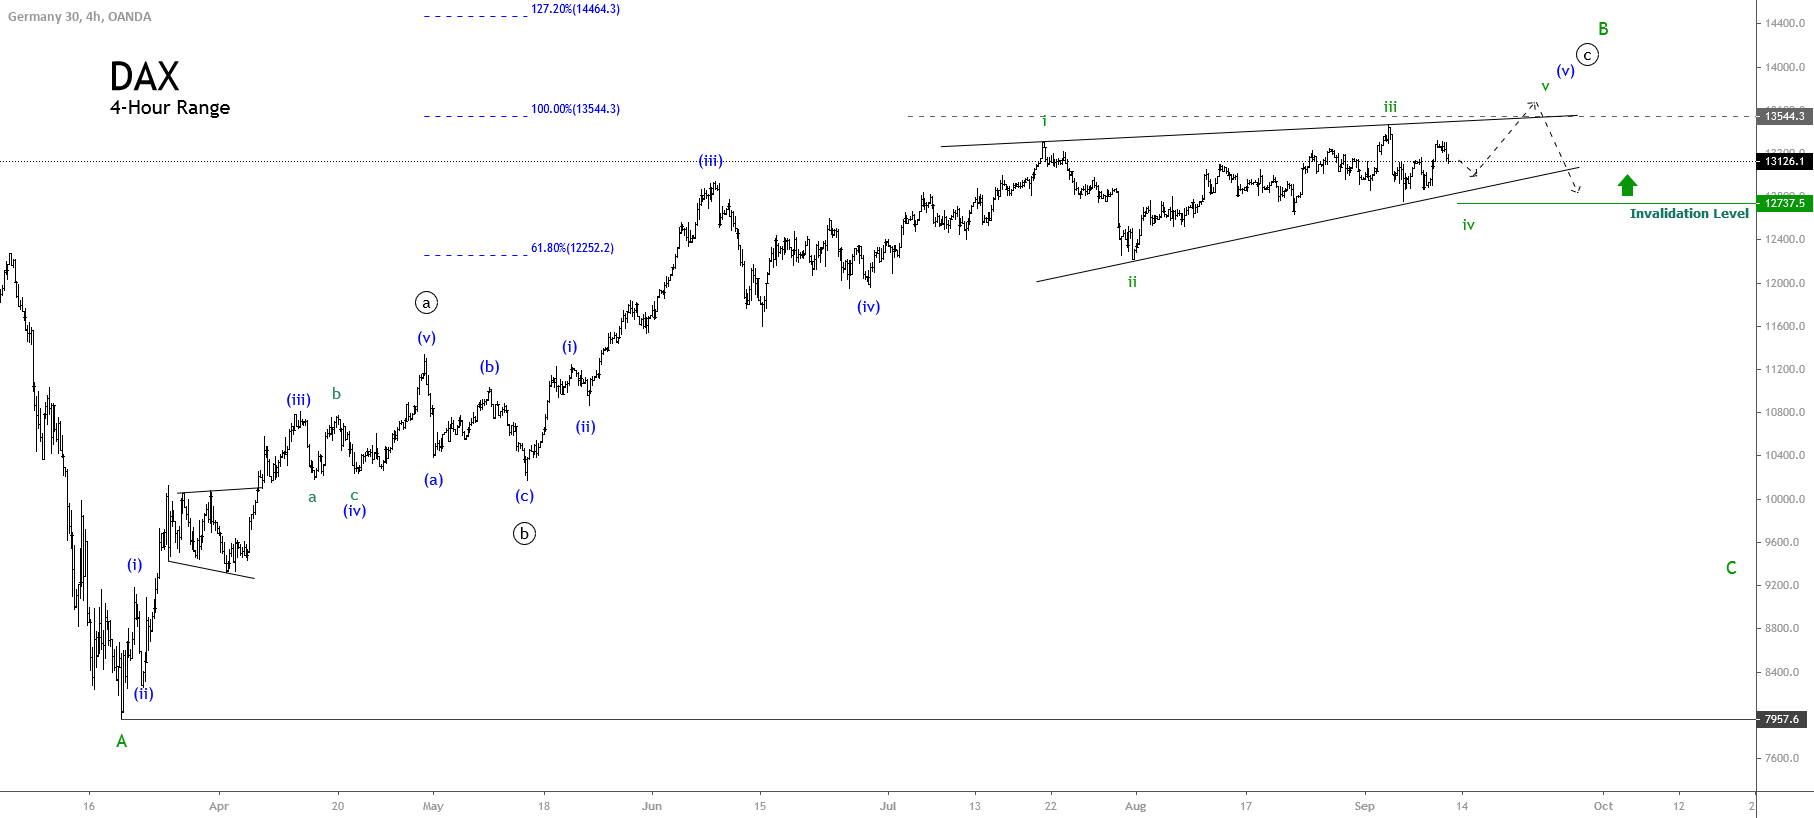
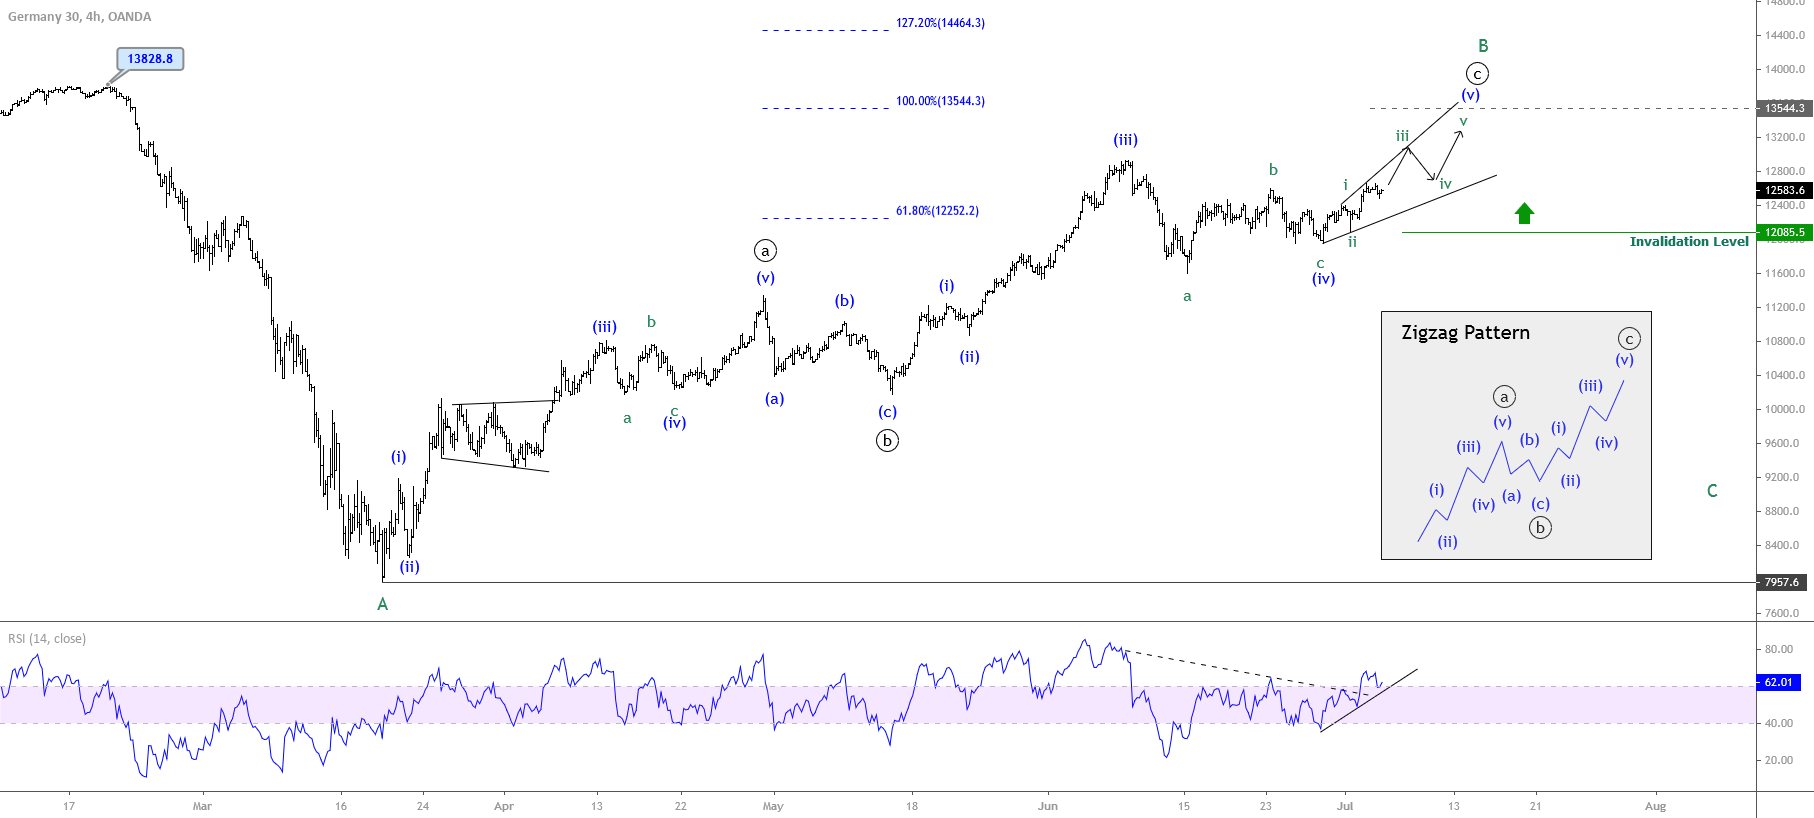


DAX

The weekly chart shows that the DAX and the Euro-zone are not confident of its economic outlook.  The Index has drawn two consecutive bearish candles and we see that it shows descending lows. Its Cycle Indicator also points to the downside.

We have to pay attention next week to the US index because the DAX is correlated to it, but if we only pay attention to the technical outlook, we are more in the side of the bearish scenario.


The daily chart doesn’t change its outlook. We see that the price broke the triangular formation to the downside and tested it three times last week without being able to break it. Last Friday, although the session closed with gains, the inside candle drawn shows indecision and doubt. The most probable scenario is for the DAX to head down to test the support at 12378 level.
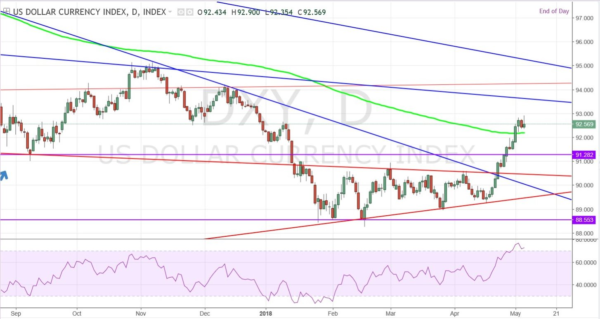


US Dollar Index

The US Dollar Index weekly chart shows a Spinning Top candle, while Ehlers’ Cycle indicator has changed to bearish. This may indicate that last week’s correction isn’t finished yet and we may look for a test of the Fibo 0.38 or, even to a 50% retracement, although this is less probable.


The Dollar Index daily chart’s engulfing candle that happened on May 29 has been challenged but not successfully. The Cycle indicator also points to the bearish side. Therefore our expectation is for more drops next week.


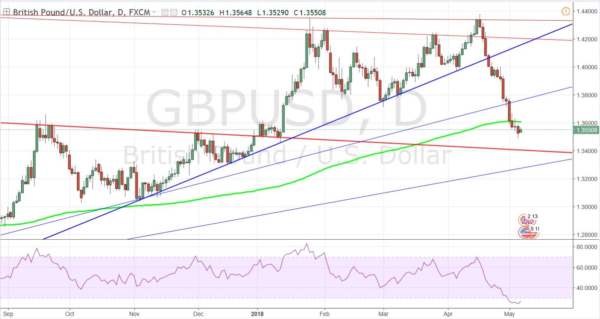
This means the Euro and GBP could still be retracing their heavy drops that started mid-May.
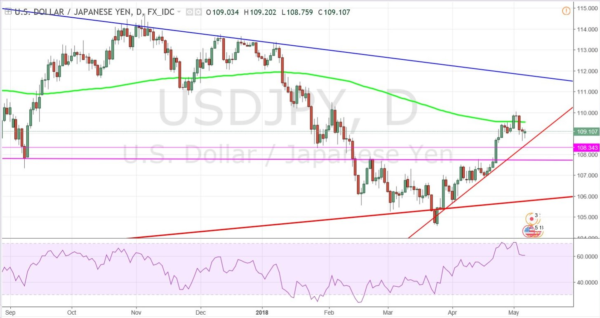
 

USDJPY

On a weekly chart the pair made an engulfing candle two weeks ago, and last week it continues moving down toward its support zone, where it bounced sharply up creating a hammer.
The price is moving mainly by its fundamentals, and now it is heading to the resistance area (green rectangle ). We may see the pair moving between those two areas for some time.


Looking at the daily chart, the pair broke the triangle formation to the upside with a large candle. The cycle indicator also points upward.
The target level is at its recent highs.


Categories
Forex Market Analysis

Transitioning Week


Macroeconomic Outlook


Bearing in mind the  current situation of the markets, it would be necessary to take positions in line with the three P strategy:

  • Priority
  • Preserve
  • Patience

It is still a good moment to take long positions, to buy banks after sell-offs, to buy retail companies and to buy industrials and technologies.

As references, this week we have:

  • Oil Price: Risk that inflation goes up with oil prices again as Central Banks act in a very dovish way every time there is a risk. Markets in the short term will be conditioned to this risk.
  • Geopolitics: Politics, tariffs and trade deals will condition the markets.

o   In the end, this situation will lead to observe if the USA realises that it does not need China as an intermediary for North Korea which will put pressure on the markets in the short term.

o   On the other side, it is politics. European politics are making a bigger noise with the uncertainty about the Italian government which is not that big, and the risk of a vote of no confidence in Spain.

o   So, bearing this in mind, the immediate influence over the markets is high. Therefore the markets slow down. However, it should not concern us that much as politics have less weight on the economies with time.

Moving to macroeconomics, there are a couple of indicators this week. Most relevant are:

  • Wednesday we have American GDP which should remain at 2.3%
  • Thursday, we have European inflation that should increase to 1.6%
  • Then on Friday, we have American wages which should go to 2.6% – 2.7%

o   Ideally 2.6%

The probability that all this happens is low plus New York and London are closed on Monday leading to a slow start. It will be a week of transition, observing all this information and digesting it to know what the reaction of the markets will be. It will be intense in the short term, but as said in the beginning, it is important to persist, have patience and remain where we are.

  • Indexes should be the place where we should remain since the expansive economic cycle continues, politics have low influence on economics, and we are in a period where global growth is happening in a positive synchronised way.


Technical Outlook


US Dollar Index


As expected, the US Dollar Index retested the recent resistance it broke it, confirming the bull trendline. For now, as we got the retest as confirmation, we remain with our bullish position.

EURUSD


After catching the first bearish wave, we are capturing the second one. We were waiting for a retest of the support for confirmation, but we did not even need it as it continued falling without chance of retesting the support. Remain bearish for now unless unexpected circumstances arise.


GBPUSD


After breaking the strong monthly support on Friday, it opens space for a short position. We were waiting for a rebound, but instead of that, we got a strong breakout which gives us the confirmation of the strength of the bearish trend. Hence, it would be convenient to change the position into a bearish one with a huge risk-reward. As for now, we leave the profit taking open until the next monthly support.

USDJPY


We will remain on the side this week as USDJPY is in a dead space between supports and resistance. Hence, we do not take any position, remain neutral and await what direction it takes.

Crude Oil


We took profits and now it is time to wait on the sides to see what happens. We’ll look closely to see which trendline it gets closer to if it continues the bullish run or breaks any near support. Looking at its reaction, we’ll take another position next week.

DAX


Retest confirmation is on its way creating another good time to enter. We remain bullish as there is nothing to be concerned about for now.


Categories
Forex Market Analysis

USA VS China Trade, Inflation and Quarterly Results


Macroeconomic Outlook

Three references for the markets this week

1)      Trade relation between China and USA

  1. Last Friday it was agreed what it could be the beginning of talks that will take time
  2. Rather a constructive agreement than a bad one

2)      Inflation

  1. American inflation is the key variable this week
  2. It is expected to increase to 2.5% from previous 2.4%
  3. Currently is above the 2% target and this creates certain anxiety and can have some effect on bonds
  4. Might consider the option of a lower than expected inflation (<2.4%)
  5. Payrolls data, which was published on Friday, was 2.6% instead of 2.7% moving away from the 3% barrier
  6. The option of a lower inflation rate provides a less stressful outlook

3)      Quarterly Results

  1. Really good so far in the USA
  2. Partly because of the tax reform
  3. EPS had increased to an average of 24,8% when at the beginning it was expected to be around 17%
  4. Good so far too in Europe
  5. More European companies will publish results this week

Hence, bearing in mind a decent agreement between USA and China, the possibility of lower inflation and good corporate results, the markets should bounce and rise a little this week.

Furthermore, if the inflation turns out to be lower, it could be good for bonds and could contribute to a weaker US Dollar wich has increased significantly recently.


Technical Analysis

US Dollar Index

Daily Chart

It is possible to appreciate how the US Dollar Index, after tumbling for a couple of weeks, broke all the resistances and increased significantly. The most important resistances generated from its monthly bearish trend have been broken in one strong movement upward. Including, also, its 200-day EMA which is retesting right now. The only significant resistance that is facing now is at the 93.5 which will be the next target leaving some space for a longer run.

EURUSD

Daily Chart

After testing for the third time the bearish trend line on the top it dropped,  strongly breaking its two supports below it. Not only it fell after testing its resistance and breaking the upcoming supports but also, on Wednesday it broke below the third support which is currently retesting. This can be either a fake breakout or another shorting opportunity.


GBPUSD

Daily Chart

After breaking the support, which has been holding price during its bullish trend line, it is eyeing the next solid resistance which is at a level of 1.34 more or less. After breaking the 200-day EMA, it is taking a rest. It may either retest the recent support broken which is hard as the bullish trend was really steep or test the next resistance which is closer and extending the bearish move.


USDJPY

Daily Chart

The dollar broke both resistances after doing a fake breakout and bouncing back from the monthly support. It has created a small bullish trend in the short term where it can be holding on until it reaches its next target which is the monthly bearish trend, currently situated at a level of 111.5. Either that or starts going sideways for the next days until it breaks one of the monthly trends.

Crude Oil

Daily Chart

Recent geopolitical events and tensions in Syria have created volatility in the markets, and consequently, the price of oil has been on the rise. After holding to the bullish trend line and breaking above $65 it did a retest of the recent resistances it just broke above. Without more resistances ahead, it has just reached the expected target of $70 per barrel. There are not any significant resistance above which leaves the door open for a longer bullish run.

DAX

Daily Chart

It bounced back from the monthly bearish trend which was the strongest one and consequently in the recent run it has just broken both two bearish weekly resistances. Last Friday it closed above the last resistance which leaves the door open for a continuation, possibly at less slow pace, of the recent bullish trend formed from testing the resistances and breaking the supports.

©Forex.Academy

Categories
Forex Market Analysis

Opposing forces drive the markets in the upcoming week

Weekly Update

Regarding fundamentals, we are expecting opposing forces drive the markets in the upcoming week. Volatility has sparked bearing in mind the recent intervention of the USA in Syria. However, stock futures are up, and oil is down on hopes Syria attack a one-off.

Thus, we’ll focus on the most foreseeable variables. There are three variables that are mainly moving the markets

  • Protectionism
    • A less negative pressure in the short term as fears erase
    • Recent formal declarations by Chinese president rise expectations of a friendlier trade
    • There are still two months until Trump takes in action any tariff measure
  • Technology
    • Recent testimony by Mark Zuckerberg leaves good feelings and calms the markets
    • Relieves pressure on technology companies
  • Quarterly results
    • 2018 benefits are revised downwards
    • However, 1st quarter is expected to be robust with strong corporate volumes and margins which will be positive in the short term
Macro Data

This week there is no major macroeconomic event that will affect considerably the markets.

On Monday we have American Retail Sales which are expected to increase to 0.4% from the last- 0.1%. This can benefit the US Dollar. On Tuesday, the German ZEW Economic Sentiment can have some impact on the Euro and DAX. It is expected to decrease to -0.8 from 5.1. Finally, on Thursday, the American Manufacturing Index is released, and it is expected to decrease around one point.

In general, the macro outlook is more pessimist than positive. However, the previous three variables provide a more positive outlook and provide a better understanding than the macroeconomics events on how the markets will act this week. So that, we could expect a stabilization phase in the markets after the recent volatility. In general, slightly more positive than negative.


 USD Index

Weekly Chart


In the weekly chart, it is possible to appreciate how the USD Index is not only below the 200 EMA but also broke below the weekly support that has been retesting in the recent weeks and which has not been successful so far. In the short term is facing a bearish trend line caused by its recent devaluation.

During the first half of this week, there are not big news. However, on Wednesday, American Inflation numbers come out. It is forecasted that the core CPI will increase to 2.1% from previous 1.8%. Furthermore, on Friday, Moody’s published its USA rating, which right now has the highest rating possible with stable perspective. Hence, recent controversial policies from the American government making protectionism and a trade war a reality can alter the expectations for the mention economic events. In case the forecast does not vary the USD should not be hurt. However, an unexpected increase in the Core CPI and a rating downgrade from Moody’s can really hurt the Dollar.

Daily Chart 

The daily chart is similar to the weekly chart. The retest cannot break above the recently broken support and is facing more bearish pressure ahead. Nevertheless, it just formed double bottom pattern followed by a short-term bullish trendline. This week will be critical to know whether the bearish support is strong enough or it holds on to the current bullish trend.

EURUSD

Daily Chart

Regarding the EURUSD, it has been flat since February. Last month it broke its monthly bullish trend, and the consequently retest it.  From there, it has remained flat with no major fluctuations. However, with the recent uncertainties facing both the Eurozone and the USA it will not be surprising to see the EURUSD leaning towards a side. For now, it is holding at a strong resistance that dates back to September of 2017.  It is facing a couple of support and resistance which will help to know towards what side it will lean and leave the rectangle it is in now.

USDJPY

Daily Chart

Moving into the USDJPY, it has just bounced from a monthly bullish trend after doing a fake breakout and consequently bouncing back. A bullish trend could be considered since there are not big resistances ahead part from the 200 EMA and the recent bearish monthly trend. In the short term, there are two resistances not very strong, but that may cause a small retracement. However, the monthly support is stronger than the resistance it is locked up between.

GBPUSD

Daily Chart

GBPUSD seems to have no limits. At the beginning of the year, the Pound broke an important bearish trendline holding to its current bullish trendline. Moreover, last week just broke another key resistance. With no more important resistance ahead it has a clear path to keep up with the current upward trend. Maybe it is possible to do small retest as we saw with the previous one.

Crude Oil

Daily Chart

Recent political events, like the recent issue of the missile attack against Syria, have created volatility in the markets and consequently, the price of oil has been on the rise. After holding to the trendline and breaking above $65 it is possible to see a retest of the recent resistances it just broke above. Without more resistances ahead, analyst set that next target is $70 per barrel.

DAX

Daily Chart

Regarding technical, it is within a bearish trend that can be prolonged as there is still uncertainty in terms of politics and the recent macroeconomics event have not been reaching the forecasted ones. However, an improvement in the economic sentiment and political stability can help the DAX to break the ahead resistance and enter a bullish trend, leaving the current flat to bearish trend it is involved in now.

As commented at the beginning, on Tuesday the German ZEW Economic Sentiment is released. Hence, it can major point to decide whether it breaks the recent resistance and follows the daily bearish trend.

© Forex.Academy