Categories
Forex Signals

CADCHF Breakout of Triangle Pattern – Who’s Up for Buy Position? 

The CAD/CHF pair is trading with a bullish bias at 0.7020 level, having violated the resistance level of 0.7000 level. It seems like the improved crude oil prices and reduced demand for safe-haven swiss franc is brining buyers for the CAD/CHF pair. 

The increased hopes for a quick global economic recovery emerged after a potential vaccine trial for COVID-19 was reported on Tuesday, which increased the risk appetite in the market. The new developments in Brexit talks, which were reported earlier in the day, showed that the EU was ready to give up its demand for access to the UK’s fishing water added in the risk appetite. Adding in the risk-sentiment was also the easing of restrictions across the globe fromCOVID-19 lockdown, weighed on US dollar.


The CAD/CHF broke out of the ascending triangle pattern, providing resistance at 0.7000 level. A bullish breakout of this level is likely to lead the pair prices towards the next resistance level of 0.7066 as the MACD and RSI both are supporting an upward trend. At the same, the bullish engulfing around 0.7005 level has also driven a strong bullish sentiment for the pair. 

Entry Price – Buy 0.70174    

Stop Loss – 0.69724    

Take Profit – 0.70674    

Risk to Reward – 1.11

Profit & Loss Per Standard Lot = -$450/ +$500

Profit & Loss Per Micro Lot = -$45/ +$500

Categories
Forex Assets

Fundamentals Of CAD/CHF Forex Currency Pair

Introduction

CAD/CHF is a currency pair where two currencies, namely, the Canadian dollar and the Swiss franc, are involved. It is a cross-currency pair. Here, CAD is called the based currency, and CHF is called the quote currency.

Understanding CAD/CHF

The current market price of CADCHF tells the value of CHF equivalent to one CAD. It is represented as 1 CAD per X CHF. For example, if the value of CADCHF in the market is 0.7372, then one must pay 0.7372 Swiss francs to buy one Canadian dollar.

Spread

In simple terms, the spread is the difference between the bid price and the ask price set by the brokers. It is not a fixed value and differs from time to time and broker to broker. It also varies based on the type of execution model.

ECN: 1 | STP: 2

Fees

The fee is the commission that is levied by the broker on each trade a trader takes. This, too, like the spread, differs from broker to broker and the type of their execution model. Fee on ECN accounts is 6-10 pips, while it is nil on STP accounts.

Slippage

Slippage is the difference between the trader’s executed price and the price he actually received from the broker. There is always this difference due to the volatility of the market and the broker’s trade execution speed. Note that slippage only happens on market orders.

Trading Range in CAD/CHF

Apart from analyzing the direction of the market, one must predetermine their risk and reward based on the volatility and the timeframe. Knowing how much a trader will gain or lose in a given time frame is a vital trade management tool. And below is a table through which one can determine their profit/loss that can be made in a specified timeframe. For example, the average pip movement on the 1H timeframe is 6.8. So, a trader can expect to be in a profit of $68.34 or in a loss of the same amount.

Procedure to assess Pip Ranges

  1. Add the ATR indicator to your chart
  2. Set the period to 1
  3. Add a 200-period SMA to this indicator
  4. Shrink the chart so you can assess a large time period
  5. Select your desired timeframe
  6. Measure the floor level and set this value as the min
  7. Measure the level of the 200-period SMA and set this as the average
  8. Measure the peak levels and set this as Max.

CAD/CHF Cost as a Percent of the Trading Range

An application to the above volatility table is to find the cost differences on trades by considering the volatility and the total cost on a trade. Below is the table that illustrates the variation in cost on a trade, in terms of percentage. The comprehension of it is discussed in the subsequent topic.

ECN Model Account

Spread = 1 | Slippage = 2 |Trading fee = 1

Total cost = Slippage + Spread + Trading Fee = 2 + 1 + 1 = 4

STP Model Account

Spread = 2 | Slippage = 2 | Trading fee = 0

Total cost = Slippage + Spread + Trading Fee = 2 + 2 + 0 = 2

The Ideal way to trade the CAD/CHF

The higher the magnitude of the percentage, the higher is the cost of the trade.

The values in the table are least in the min column and highest in the max column. This simply means that the costs are high when the volatility of the market is low and vice versa.

In the average column, the values are not as low as in the max column, and not as high as in the max column. The volatility here is moderate too. Hence, this becomes our ideal time of the day to trade in the market.

To sum it up, one must trade during those times of the day when the volatility is more or less near the average values. This will ensure decent volatility as well as minimal costs.

There is another simple technique to reduce costs on trade. When trades are executed using limit order instead of market orders, the slippage becomes nil. So, this brings down the total cost of the trade by a significant value.

Categories
Forex Market Analysis

Daily: busy day of ECB, BoE, and US CPI


NEWS COMMENTARY


It’s a busy day with two central banks meetings along with the US consumer price index

But as always, starting with the trade war the major issue that moves the markets, China accepted an invitation by the United States to hold a new round of trade talks, raising hopes for a deal easing the tariff war between the world’s two biggest economies.

Chinese Foreign Ministry spokesman Geng Shuang said earlier that Beijing had received the invitation and welcomed it, adding that the two countries were in discussion about the details.

The Trump administration had invited Chinese officials to restart trade negotiations

This comes after President Donald Trump warned last week that there could more trade tariffs against Beijing totaling $267 billion, on top the already $200 billion in tariffs previously announced.


US consumer price is expected to have risen 0.3% last month and 2.8% over the prior year, according to estimates.

The U.S. central bank is widely expected to raise interest rates at its September meeting, but odds for another move in December have decreased in recent days.


The European Central Bank is all but certain to keep interest rates at their current record low levels, making only nuanced changes to its guidance to stay on course to end bond purchases this year and raise interest rates next autumn.

With Thursday’s decision, the ECB’s deposit rate, currently its primary interest rate tool, will remain at -0.40% while the main refinancing rate, which determines the cost of credit in the economy, will remain at 0.0%.


The Bank of England is also expected to hold fire after raising interest rates last month. If all goes as expected, the British central bank will keep rates at 0.75%

Investors will look closely at the breakdown of votes on the nine-member Monetary Policy Committee for further indications on the timing of the next rate increase.

Comments regarding the ongoing Brexit negotiations will also be in focus.

Expectations of another BoE rate hike are only seen in the second half of next year, given Britain’s plans to leave the European Union in March.


Positive data came from the Australian employment change which hiked up to 44.0K higher than expected 16.5K


CHART ANALYSIS


DAX

On the daily chart, we can see that the price had a bearish rally for the past six weeks until it reached the key support zone of 11900.8-11742.4

It’s also the lower side of the descending channel along with 88.6% Fibonacci

The price is technically expected to have its way up back again to the key resistance level 12582.46 which is the top of descending channel and the broken ascending trend


OIL

On the daily chart, the price is moving sideways between the support area 66.2-64.15 and the resistance area 74.45-72.45

After breaking the ascending trend, the price turned back to this support zone with bounce from an ascending trend as shown

The price now is retesting this zone with price action “pin bar”, to have a bullish movement again

So, it’s expected to go up to the resistance zone of 72.45-74.45


NZDJPY

On the daily chart, the pair is facing a punch of support levels

Firstly the key support zone 72.65-72.35, secondly the down side of the descending channel, third the AB=CD harmonic pattern, forth the double bottom reversal pattern, and finally the divergence on RSI

So, the price is supposed to get back up again to the resistance 74.01
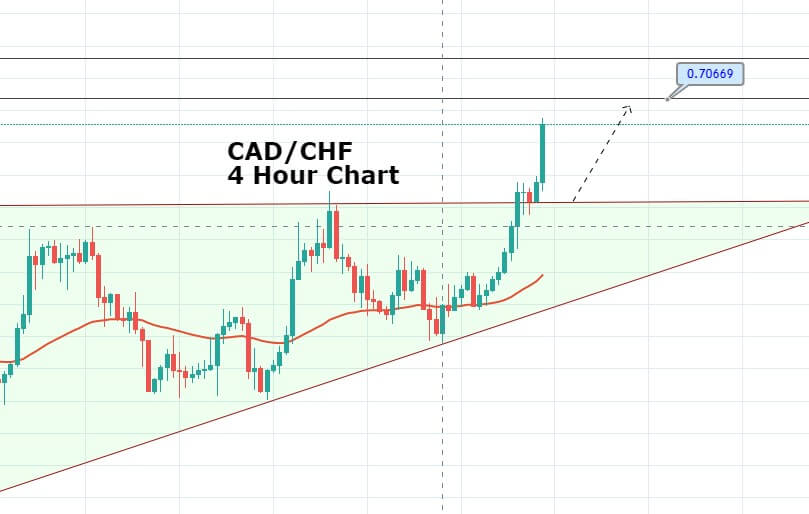


CADCHF

On the daily chart, the pair is facing a punch of support levels

Firstly the key support level of 0.732, secondly the ascending trend from the low of 2016, third the Gartley harmonic pattern, forth the wedge reversal pattern, and finally the oversold on RSI

So, the price is supposed to get back up again to the resistance 0.762


Categories
Forex Market Analysis

Daily Review -US-EU Negotiations, Brexit Deal, UK Wages Hike, NAFTA Discussions


NEWS COMMENTARY


Markets stalled on Tuesday as uncertainty over a trade dispute between Washington and Beijing kept investors on edge.

U.S. President Donald Trump wants to impose tariffs on almost all imported Chinese goods .China’s foreign ministry said on Monday that it would respond to any new steps on trade.

.


US Trade Representative Robert Lighthizer just finished a meeting with European Trade Commissioner Cecilia Malmstrom in Brussels yesterday. Malmstrom said in a tweet that “Lighthizer discussed how the EU-US achieves concrete results in the short to medium term towards a free trade agreement.” And they’ll meet again at the end of September.

Lighthizer’s office described the talks as constructive. Also, work would be done in October to identify tariff and non-tariff barriers that could be cut. And trade chiefs of EU and US will follow up in November to finalize certain results.

However, a deal is not likely to be reached as soon as the White House administration would like


The euro rose on Tuesday as easing concerns about Italian debt boosted the single currency for a second day,

The euro was strengthened by a fall in Italian government borrowing costs this week after Economy Minister Giovanni Tria on Monday predicted yields would drop as the government lays out its much-anticipated budget for 2019


More upbeat talk from the EU negotiator sent sterling higher


Barnier said in a forum in Slovenia that “if we are realistic we are able to reach an agreement on the first stage of the negotiation, which is the Brexit treaty, within 6 or 8 weeks.” And, “taking into account the time necessary for the ratification process, the House of Commons on one side, the European Parliament and the Council on the other side … we must reach an agreement before the beginning of November. I think it is possible.”

What enhances the pound further that wages came strong at 2.6% higher than expected 2.4%, so it would be a confidence builder for pound longs


Canada and the US will restart high-level trade talks in Washington today. Whether it’s still NAFTA or not, the two sides reached a deadlock in three key issues, Canadian dairy market access, cultural exemption for Canada and Chapter 19 dispute resolution mechanism. Not much news is released regarding the discussions as both sides agreed not to negotiate in public.

Canadian Prime Minister Justin Trudeau just reiterated yesterday that “we continue to work hard and we are positively optimistic that we can get a win-win-win for all three countries.” Foreign Minister Chrystia Freeland, who’ll be in Washington today, said last week that the negotiation has entered into a “very intense phase” and the officials have been working 24-7.


CHART ANALYSIS


DAX

On the daily chart, we can see that the price had a bearish rally for the past six weeks until it reached the key support zone of 11900.8-11742.4

It’s also the lower side of the descending channel along with 88.6% Fibonacci

The price is technically expected to have its way up back again to the key resistance level 12582.46 which is the top of descending channel and the broken ascending trend


OIL

On the daily chart, the price is moving sideways between the support area 66.2-64.15 and the resistance area 74.45-72.45

After breaking the ascending trend, the price turned back to this support zone with bounce from an ascending trend as shown

The price now is retesting this zone with price action “pin bar”, to have a bullish movement again

So, it’s expected to go up to the resistance zone of 72.45-74.45


CADCHF

On the daily chart, the pair is facing a punch of support levels

Firstly the key support level of 0.732, secondly the ascending trend from the low of 2016, third the Gartley harmonic pattern, forth the wedge reversal pattern, and finally the oversold on RSI

So, the price is supposed to get back up again to the resistance 0.762


CADJPY

On the daily chart, the pair was moving bearish on the last two weeks, down from a strong resistance zone

Until it reached the key support of 83.75, followed by the ascending trend line from the low of 2018

After forming pin bar followed by bullish candle, the price is expected to hike again to the zone 86.15-86.9


Categories
Forex Educational Library

Forex.Academy 2018-2019 Outlook – CAD Group


Summary


Forex Daily News: In this post, we analyse the Canadian Dollar group against their main currencies. As a summary, the second half of the year and 2019, we foresee a corrective movement in the Canadian currency, which could come supported for a correction in oil prices to, then, give way to a new rally. After this correction, our central vision for the Canadian Dollar is a new appreciation scenario.

Additionally, we observe that it is likely that GBP and EUR would show the best performance against the CAD; on the opposite side, the Japanese currency and the Swiss Franc could have the worst performance against the Canadian Dollar.


USDCAD

The USDCAD is developing a complex corrective structure of a second bullish impulsive wave. The corrective structure has a bearish bias, which could find support in the area between 1.29607 to 1.28371. The key level to watch out is 1.2884, this level should convert on a critical pivot level (HHL).


EURCAD

EURCAD cross in the short-term has a bearish bias, probably could see new lows in 1.50 zone. In the mid-term, the cross moves sideways as a complex corrective. In the long-term, we foresee that the EURCAD could find fresh lows in the area between 1.47822 to 1.45662, from where the cross could start a new rally as a fifth bullish wave. Invalidation level is at 1.4442.


GBPCAD

Probably the GBPCAD cross shows the clearest movement of the CAD Group. The price is moving in a bearish A-B-C sequence, which could find support at 1.6410 level, from where the price could create a new connector and then initiate a rally. The new bullish sequence has a target the area between 1.8533 and 1.9266. Invalidation level is at 1.5837.


CADJPY

The CADJPY cross has been commented in a previous analysis, and we maintain the main idea which consists in to seek only long positions with a long-term profit target in the area between 94.69 and 95.30. Is probably that the cross makes a retrace to the area between 85.45 to 83.73 from where we could find new opportunities to incorporate us into the trend. Invalidation level is located at 82.17.


CADCHF

In the CADCHF cross, the lemma is “Buy the Dips” or “Watch the Breakout.” CADCHF is running sideways in an upper degree consolidation structure. The key level to control is 0.7636, after the breakout of this level, we expect more upsides to the zone between 0.7992 and 0.8245. In case that the price makes a false breakdown to the area between 0.7394 and 0.7289, it could be an attractive opportunity to look for the long side. Invalidation level is at 0.7124.


NZDCAD

In the long-term, NZDCAD is running sideways and making lower highs. The long-term pivot level is at 0.8640. For this cross, we expect only short positions; if the price makes a bullish move, the potential movement is limited to the area between 0.9253 to 0.9461. The long-term target area is between 0.8401 to 0.8098.


AUDCAD

Probably the AUDCAD cross is the less attractive to trade. As we can see in the weekly chart, it is running sideways since the second half of 2013. The price is moving inside a bearish cycle, which could find support in the “long-term pivot level” at 0.8919, from where AUDCAD could start to bounce. The invalidation level for the bearish cycle is at 1.0397.


Forex Daily News: Finally, as a technical note, considering that the AUDCAD is mostly bearish, by correlation, the CAD should perform better than the AUD for the period foreseen.