Introduction
CADJPY is the abbreviation for the currency pair, the Canadian dollar against the Japanese yen. This pair is one of the most extensively traded cross currency pairs. In CADJPY, CAD is referred to as the base currency and JPY as the quote currency.

Understanding CAD/JPY
The value of CADJPY is the value of JPY, which is required to purchase one CAD. It is quoted as 1 CAD per X JPY. For example, if the current market price of this pair is 82.651, then these many units of Japanese yen are needed to buy one Canadian dollar.
Spread
The bid price is the price used to sell a currency, and ask price is the price used to buy a currency. There is always a difference between the two prices. This difference is called the spread. It varies from broker to broker and also the type of their execution model.
ECN: 1.1 | STP: 2
Fees
Similar to stockbrokers, there are forex brokers who charge a few pips of fee on each position a trader opens and closes. This fee is no different from the commission brokers levy. On STP accounts, the fee is nil, while on ECN accounts, it is between 6-10 pips depending on the broker one is using.
Slippage
Slippage in trading is the difference between the price requested by the trader and the price he actually received. The two factors responsible for slippage are,
- The volatility of the market
- Broker’s execution speed
Trading Range in CAD/JPY
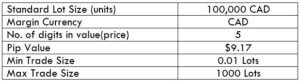
A trading range is a tabular representation of the number of pips a currency pair moved in a given timeframe. It represents the minimum, average as well as the maximum pip movement in six different timeframes. These values prove to be important for assessing one’s risk on a trade. For example, if the minimum pip movement in CADJPY on the 4H timeframe is ten pips, then a trader can expect to lose $917 in about 4H.
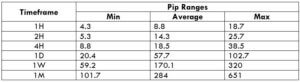
Procedure to assess Pip Ranges
- Add the ATR indicator to your chart
- Set the period to 1
- Add a 200-period SMA to this indicator
- Shrink the chart so you can determine a large period
- Select your desired timeframe
- Measure the floor level and set this value as the min
- Measure the level of the 200-period SMA and set this as the average
- Measure the peak levels and set this as Max.
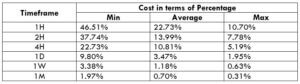
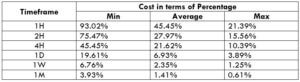
CAD/JPY Cost as a Percent of the Trading Range
As already mentioned, there is a fee for every trade you take. And knowing the percent fee on the trades you are taking is important, as it depends on the volatility of the market and the timeframe you are trading.
Below is a representation of the total cost variation on trade in terms of percentages. Since costs on ECN accounts are different from STP accounts, we have two separate tables for this concept.
ECN Model Account
Spread = 1.1 | Slippage = 2 |Trading fee = 1
Total cost = Slippage + Spread + Trading Fee = 2 + 1.1 + 1 = 4.1
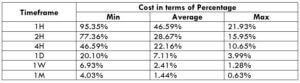
STP Model Account
Spread = 2 | Slippage = 2 | Trading fee = 0
Total cost = Slippage + Spread + Trading Fee = 2 + 2 + 0 = 4
The Ideal way to trade the CAD/JPY
Before getting right into it, let us comprehend the above tables. The higher the values of the percentages, the higher are the costs on the trade. It is pretty evident from the table that, percentage values are on the higher side in the min column and comparatively lower in the max column. This means that the costs are high when the volatility of the market is low and vice versa. Also, the trades that are taken based on a long term perspective, the costs are considerably low.
One may trade the high volatility markets to minimize your costs, or trade during low volatility by paying high costs. However, it is ideal to enter during those times of the day when the volatility is close to the average values. During these times, one can expect comparatively low costs with enough volatility as well.
On a further note, another simple and effective way to reduce costs is by trading using limit orders. This entry method will take slippage out of the total costs and bring down its value considerably. An example of the same is given below.
Spread = 2 | Slippage = 0 | Trading fee = 0
Total cost = Slippage + Spread + Trading Fee = 2 + 0 + 0 = 2