Categories
Forex Elliott Wave Forex Market Analysis

AUDNZD: Profiting from its Intraday Triangle Pattern

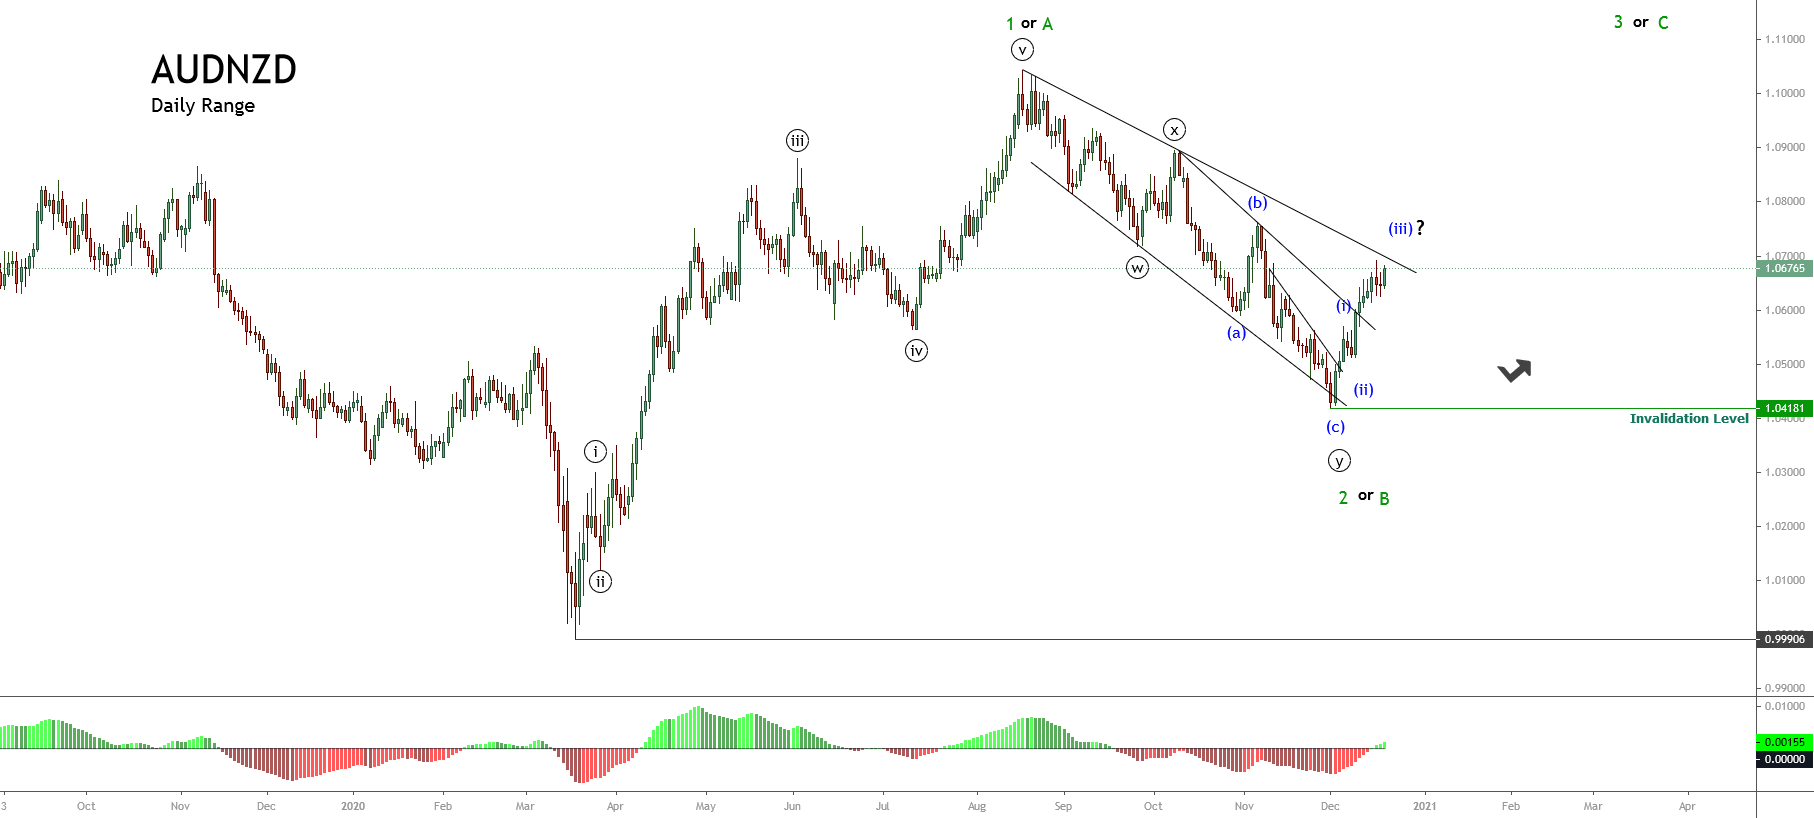
The AUDNZD cross seems to start a movement in wave 3 of Minor degree labeled in green after completing its second corrective wave of the same degree, which found its bottom at 1.04181 on December 01st.

Technical Overview

The big picture of the AUDNZD cross and under the Elliott Wave perspective and illustrated in the following daily chart reveals the bullish sequence of Minor degree that began last March 09th, when the price pierced the parity level, dropping to 0.99906.

Once the price found fresh buyers, the Oceanic cross climbed in five internal movements of Minute degree, identified in black, until 1.10438, where the cross completed its first wave in green. After this completion, AUDNZD dropped in a complex corrective formation identified as a double-three pattern, which found support at 1.04181 on December 01st. From there, it bounced up to the current levels. 

On the other hand, the breakout of the short-term descending trendline that connects the end of wave ((x)), in black, with the end of wave (b), in blue, suggests the end of the second wave of Minor degree.

Short-term Technical Outlook

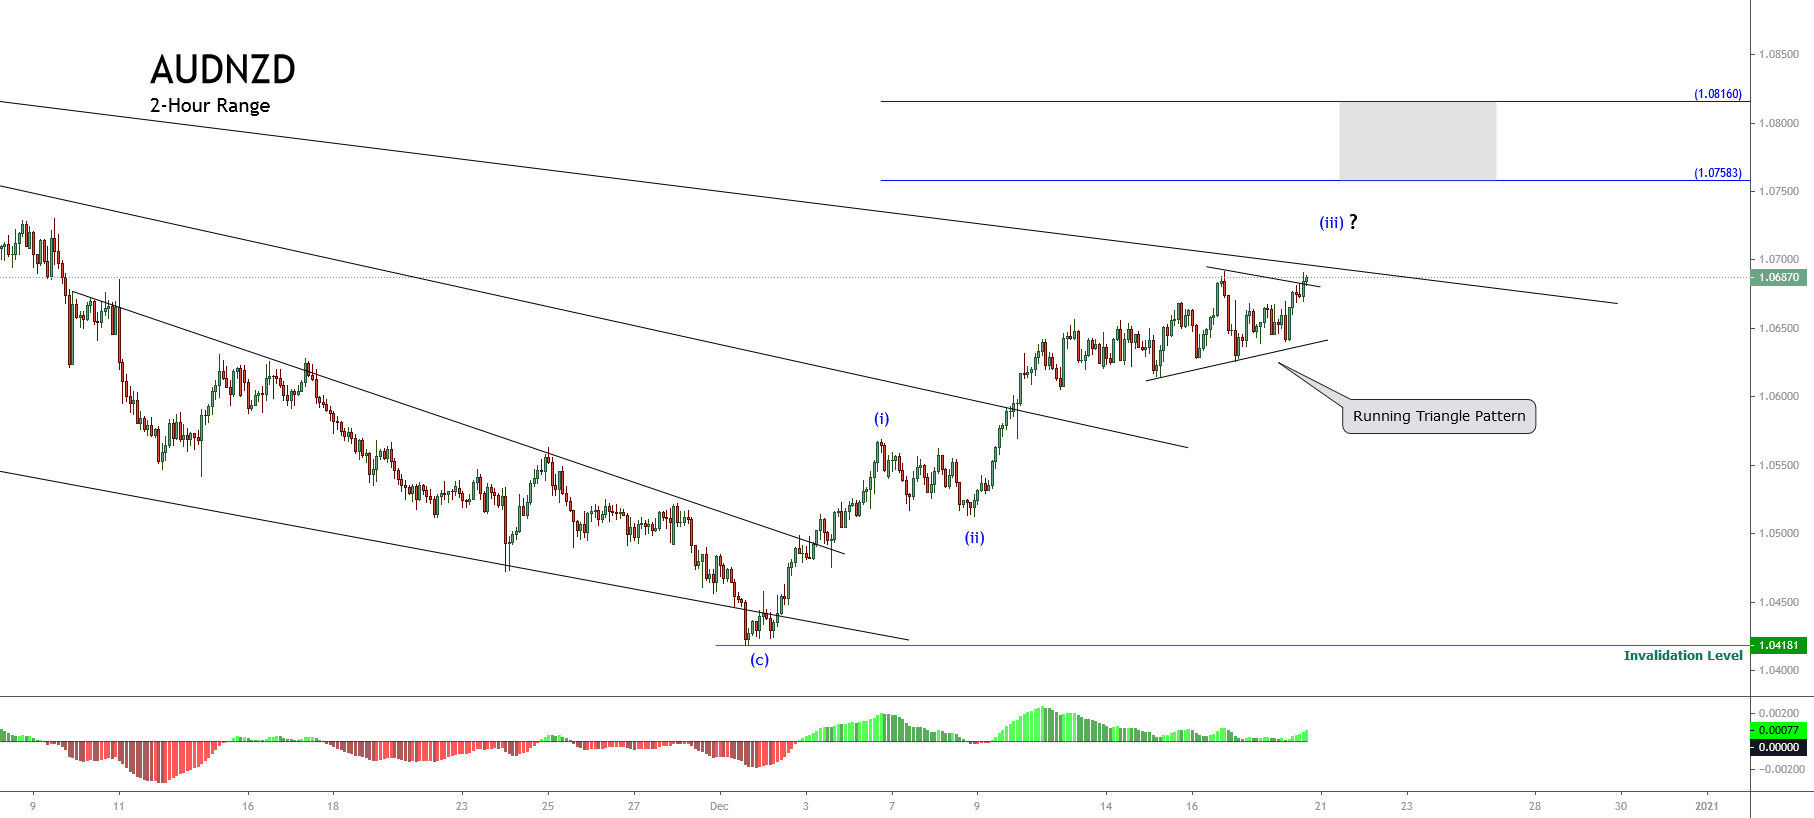
The intraday view unfolded in the next 2-hour chart shows the rally that remains in progress since December 01st when the cross found fresh buyers at 1.04181 suggesting further upsides in the following trading sessions.

The previous chart shows the wave (iii) movement of the Minuette degree labeled in blue, which currently looks consolidating its internal structure in a potential running triangle pattern. 

According to the Elliott Wave theory, practically all running triangle patterns tend to be confused with ending diagonals driving retail traders to open trades in the opposite direction to the current trend instead of considering the pattern as a continuation of the trend. Therefore under this scenario, our main bias remains on the bullish side. In this regard, this triangular pattern makes us think that the Oceanic cross might continue extending its movement until the potential target zone between 1.0758 and 1.0816, where the price could complete its third wave, in blue.

In summary, the AUDNZD cross completed its second wave of Minor degree subdivided in a descending three-wave sequence calling for a new upward movement in favor of the first rally, which should follow a five-wave sequence. In this context, the internal structure shows the progress in the third wave of an impulsive wave, which looks consolidating in a running triangle pattern. The potential target of the current rally is located between 1.0758 and 1.0816. On the other hand, the bullish scenario’s invalidation level is set at 1.04181, corresponding to the origin of the current upward sequence.

Categories
Forex Elliott Wave Forex Technical Analysis

EURJPY Consolidates Expecting Further Upsides

Technical Overview

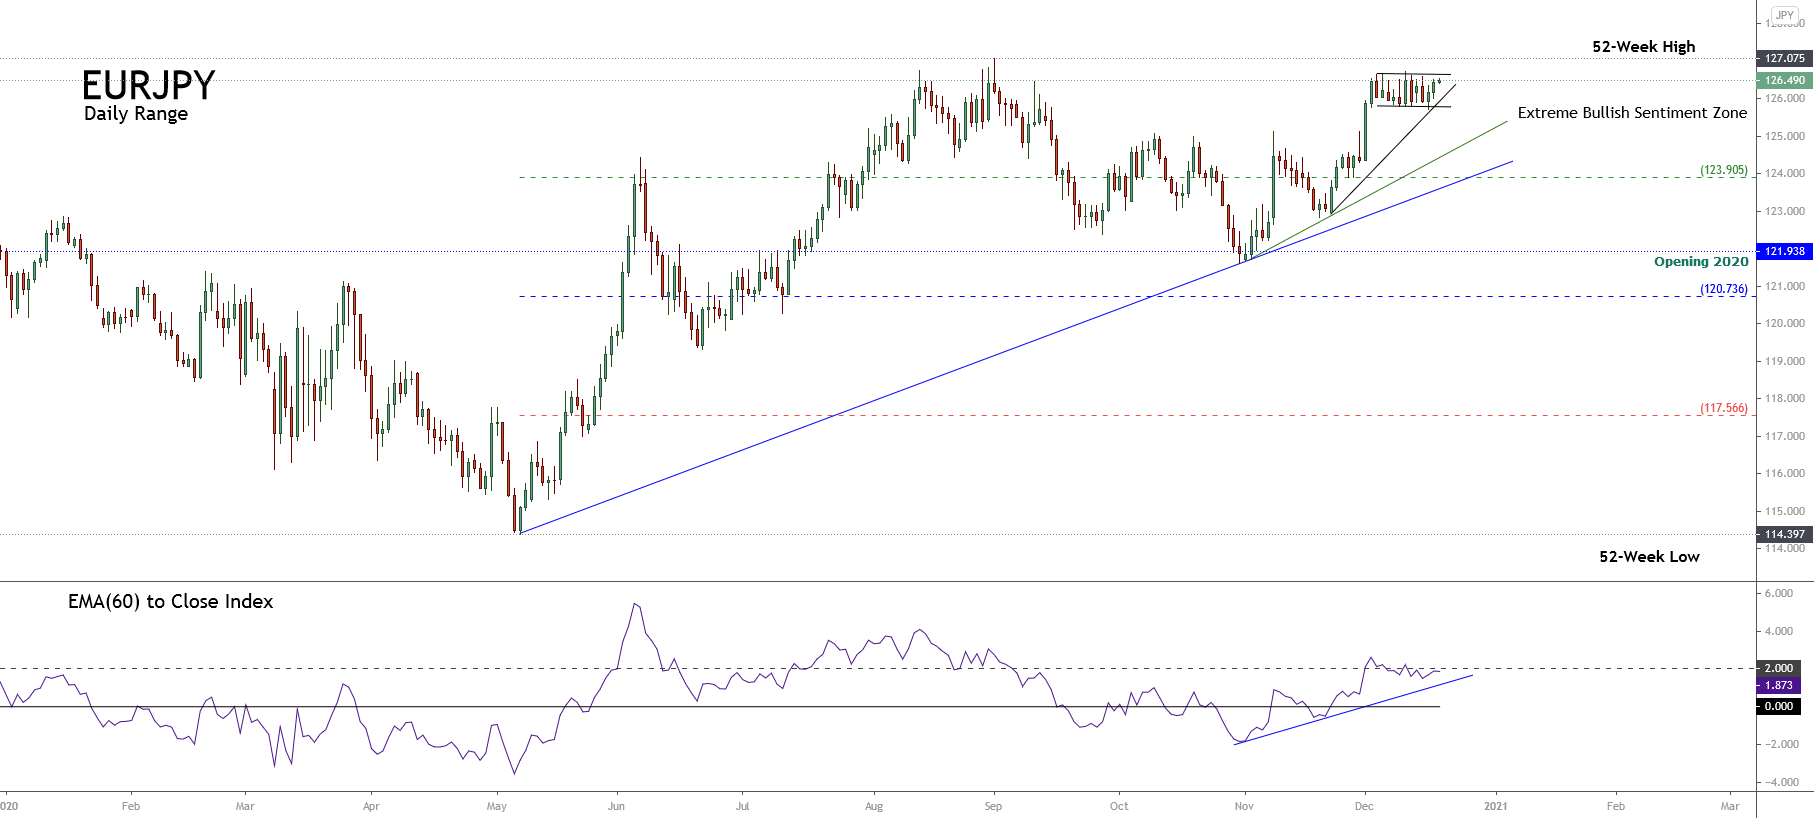
The EURJPY cross consolidates in the extreme bullish sentiment zone, suggesting a bullish continuation of the strong upward movement developed in early December.

The following daily chart exposes the EURJPY cross developing a consolidation pattern, which looks like a flag pattern bounded between 125.77 and 126.70. According to the chartist analysis, the formation suggests the continuation of the previous movement. In this case, the cross could extend its gains surpassing the next resistance corresponding to the 52-week high located at 127.075.

The mid-term overview for the EURJPY cross reveals its primary trend plotted in blue, supporting a rally that remains in progress since the price confirmed its bottom at 114.397 touched on last May 07th. The secondary trend traced in green and minor trend drawn in black supports the price acceleration, which currently consolidates carrying to expect the bullish continuation for the following trading sessions.

Technical Outlook

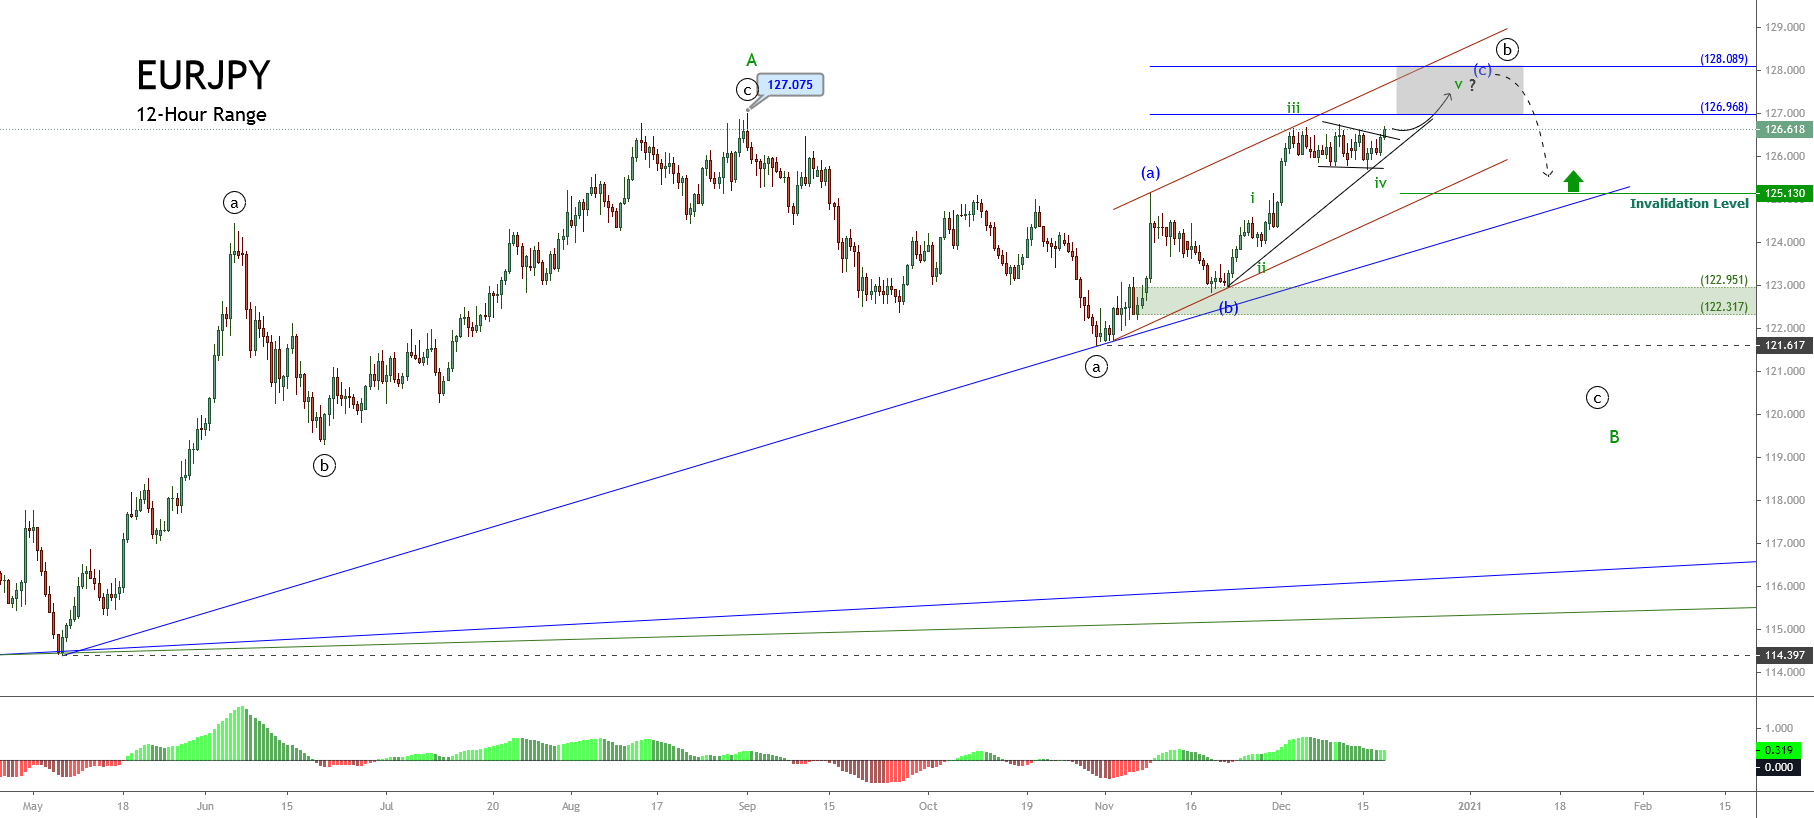
The big picture for the EURJPY cross under the Elliott wave perspective unfolded in the next 12-hour chart shows the incomplete corrective rally corresponding to wave ((b)) of Minute degree labeled in black. This corrective rally remains in progress since the price found fresh buyers at 121.617 on last October 29th and could reach new yearly highs.

The upper degree structure of the EURJPY cross illustrated in the previous chart exposes the progress in wave B of Minor degree labeled in green, which began when the cross completed its wave A at 127.075 on last September 01st. Currently, the price advances in its wave ((b)) in black. Likewise, its internal structural series shows the development in the wave (c) of Minuette degree labeled in blue, which at the same time, looks starting to develop the wave v of Suminuette degree identified in green.

In this context, the EURJPY cross could extend its gains toward the potential target zone bounded between 126.96 until 128.08, where the cross could find fresh sellers expecting to drag the price to new lows developing the wave ((c)) in black. 

In this regard, if the price confirms its new bearish leg, the cross could complete the third segment of wave B in green. On the other hand, considering both the alternation principle and the wave ((a)) and ((b)) looks extended in terms of time, the wave ((c)) could be a sharp decline.

In conclusion, the EURJPY cross moves mostly upward in a corrective rally that belongs to wave ((b)), corresponding to the second segment of the upper degree wave B. If the price breaks the sideways consolidation structure developed since early December, the cross could strike the potential target zone between 126.96 and 128.08. Likewise, the invalidation level of the bullish scenario locates at 125.130.

Categories
Forex Daily Topic Forex Fundamental Analysis

Understanding ‘Industrial Production Index’ & Its Relative Impact On The Forex Market

What is the Industrial Production Index?

Industrial Production Index or IPI, as it is commonly called, is an index that tracks manufacturing activity in different sectors of the economy. The IPI number measures the industrial production for the period under consideration, usually a month. IPI is a key economic indicator of the manufacturing sector of the economy. It measures the real output in the mining, electric, and gas industries, relative to the base year.

How is IPI calculated? 

Industrial Production is expressed as an index relative to the base year, which is 2012. They do not express absolute production numbers or volume, but the percentage change in production relative to 2012. The parameter taken into account is often varied, including physical inputs and outputs such as tons of iron, or inflation-adjusted sales figures, and when these parameters are not available, hours logged in by production workers is considered. This data is obtained from industry associations and government agencies, and the index value figure is obtained after incorporating these numbers in the Fisher-Ideal formula.

Within the IPI index, several sub-indices provide a detailed look at the production levels of highly specific industries. One can find the monthly production data of residential gas sales, ice cream, carpet and rug mills, spring and wire products, audio and video equipment, and paper in these sub-indices. The indices are seasonally adjusted, and sometimes the format is unadjusted.

Limitations of the IPI

While GDP estimates show that the manufacturing sector has picked up, the IPI doesn’t. In such cases, the question arises, which of the two should we believe. The selection of items for measuring the production output has remained the same for many years. This will have implications on the index value. IPI growth will have a certain directional bias. The recommendation has always been to make it more dynamic. All they are saying is to revise it more frequently. But the officials have been only pushing the dates forward.

Another limitation is in the selection of the base year. The 2011-2012 base year series shows faster growth than the previous one, 2004-2005 base year. Therefore, it is suggested to use the old methodology alongside the new method.

Analyzing the IPI 

The IPI data is particularly useful for money managers and investors who are a part of the business. At the same time, the composite index is an important macroeconomic indicator for economists who analyze the impact of the numbers on the economy and industry. Fluctuations within the industrial sector account for variation in the overall economic growth. The monthly metric keep investors informed about the shifts in the production levels.

At the same time, IPI ignores the most popular economic output measure, the Gross Domestic Product (GDP). GDP calculates the price paid by the end-user, so it includes the value-added in the retail sector. This is ignored by IPI. Another observation is that the industrial sector is losing its share in the GDP of a country; for instance, it made up less than 20% of the GDP of the U.S. economy as of 2016.

Along with IPI, capacity utilization is another useful indicator that investors analyze to assess the demand scenario. Low capacity utilization or overcapacity, in other words, signals weak demand. Policymakers read it as a need for fiscal or monetary stimulus in the economy. Investors read it as a sign of coming downtrend for the currency and the stock market. High capacity utilization, on the other hand, acts as a warning signal that the economy is overheating, suggesting the risk of price hikes and asset bubbles. Policymakers react to such threats with interest rate hikes or fiscal austerity. There is also a possibility that this could ultimately result in a recession.

Impact on Currency

Industrial production figures are directly proportional to the value of a currency. When Industrial Production is high, it means economic activity is improving in the country that directly contributes to the GDP. A rate of GDP leads to an appreciation in the currency value. However, an effect on the overall economy is felt when industrial production is increasing each month. An improvement in the production output for one month has no impact on the currency; the average value of at least three months makes a difference. The IPI is an early indication of growth in the manufacturing sector, which is why it is closely watched by investors and traders.

Sources of information on Industrial Production Index

The Federal Reserve Board publishes the industrial production index (IPI) every month, which is released approximately in the 2nd week of the month. The revisions in the method of calculation, if any, are released at the end of every March. As it is an important indicator of growth in the manufacturing sector, most open-source economic websites keep track of their respective countries’ data.

GBP (Sterling) – https://tradingeconomics.com/united-kingdom/industrial-production

AUD – https://tradingeconomics.com/australia/industrial-production

USD – https://tradingeconomics.com/united-states/industrial-production

CAD – https://tradingeconomics.com/canada/industrial-production

EUR – https://tradingeconomics.com/european-union/industrial-production

JPY – https://tradingeconomics.com/japan/industrial-production

The Industrial Production Index (IPI) is an important economic indicator published by the Federal Reserve Board (FRB) of the United States that measures manufacturing, mining, and utilities’ real production output. The indices are computed mainly as fisher indices with more weightage on the annual estimates of value-added. The fisher methodology only preserves the growth information, which is why the value of the base year, i.e., 2012, is randomly set to 100. This index, along with other industrial output indexes and construction, accounts for the bulk of the total output variation throughout the business cycle.

Impact of the ‘Industrial Production Index’ news release on the Forex market

In the previous part of the article, we understood the significance of Industrial production fundamental indicators in an economy. Now let’s discuss the impact of the Industrial Production Index news announcement on the value of a currency and witness the change in volatility due to the news release. As discussed previously, Industrial Production measures the change in the total inflation-adjusted value of output produced by manufacturers, mines, and utilities.

For instance, Industrial Production measures the output of businesses in the industrial sector of the United States economy, where the manufacturing sector accounts for 78 percent of total production. Some of the biggest segments of this sector are Chemicals, food, drinks and tobacco, machinery, computer and electronics, motor vehicles, and others.

Now let’s analyze the Industrial Production data of the United States released in June. As we can see in the below image, Industrial Production in the United States increased to 1.4% percent in May, which was much higher than the previous month. The Industrial Production numbers in April and May are largely influenced by COVID-19. Let us find out the reaction of the market to this data.

EUR/USD | Before the announcement
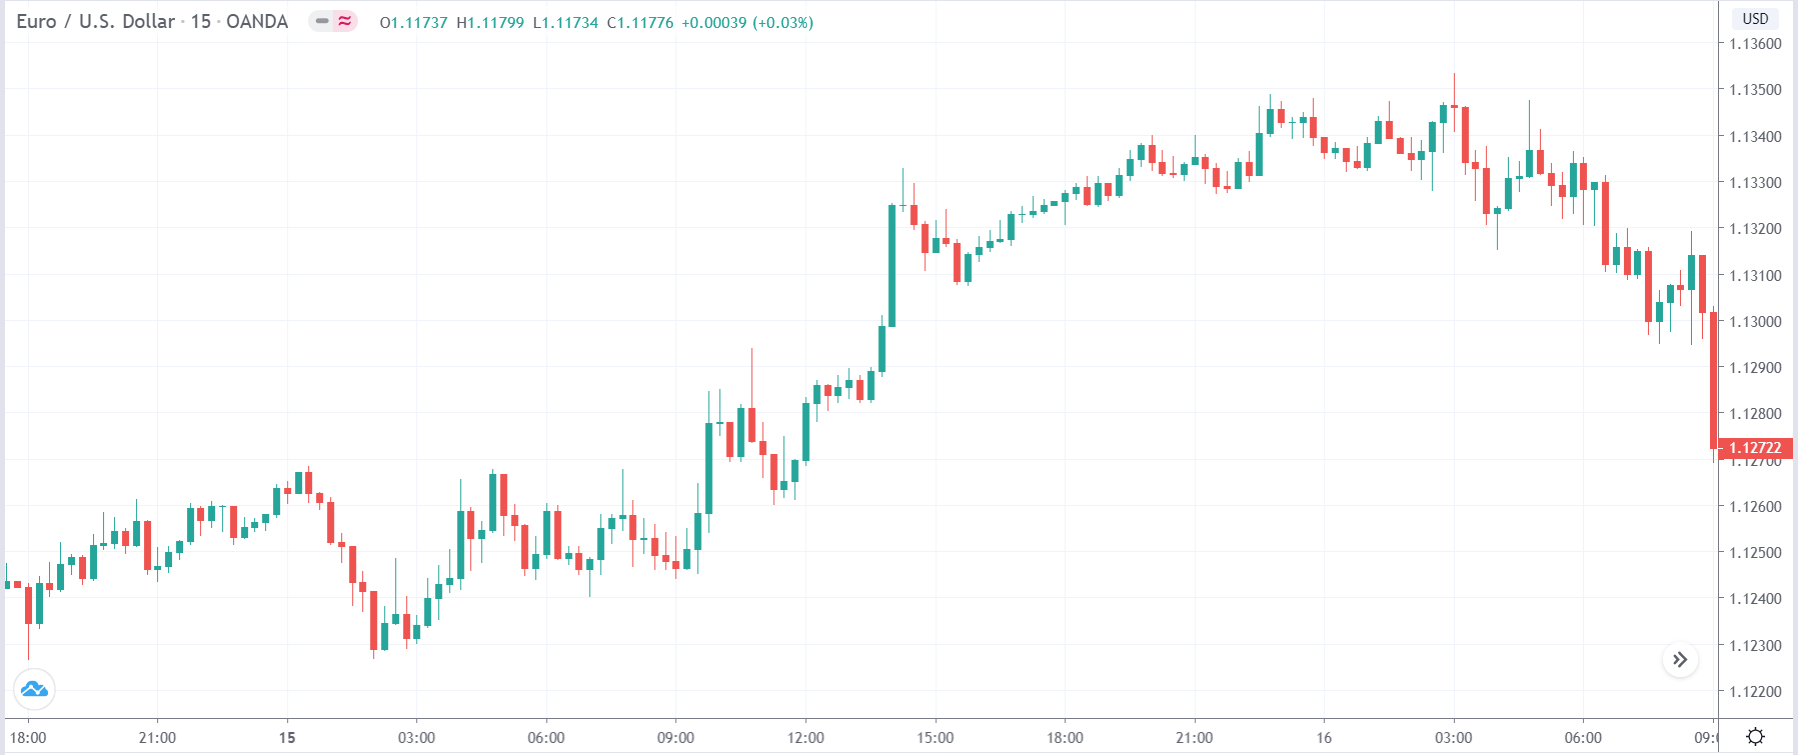
Let us start with the EUR/USD currency pair witness the change in volatility due to the news announcement. The above image shows the state of the chart before the news announcement, where we see that the market was in an uptrend and recently has laid out signs of reversal.

EUR/USD | After the announcement
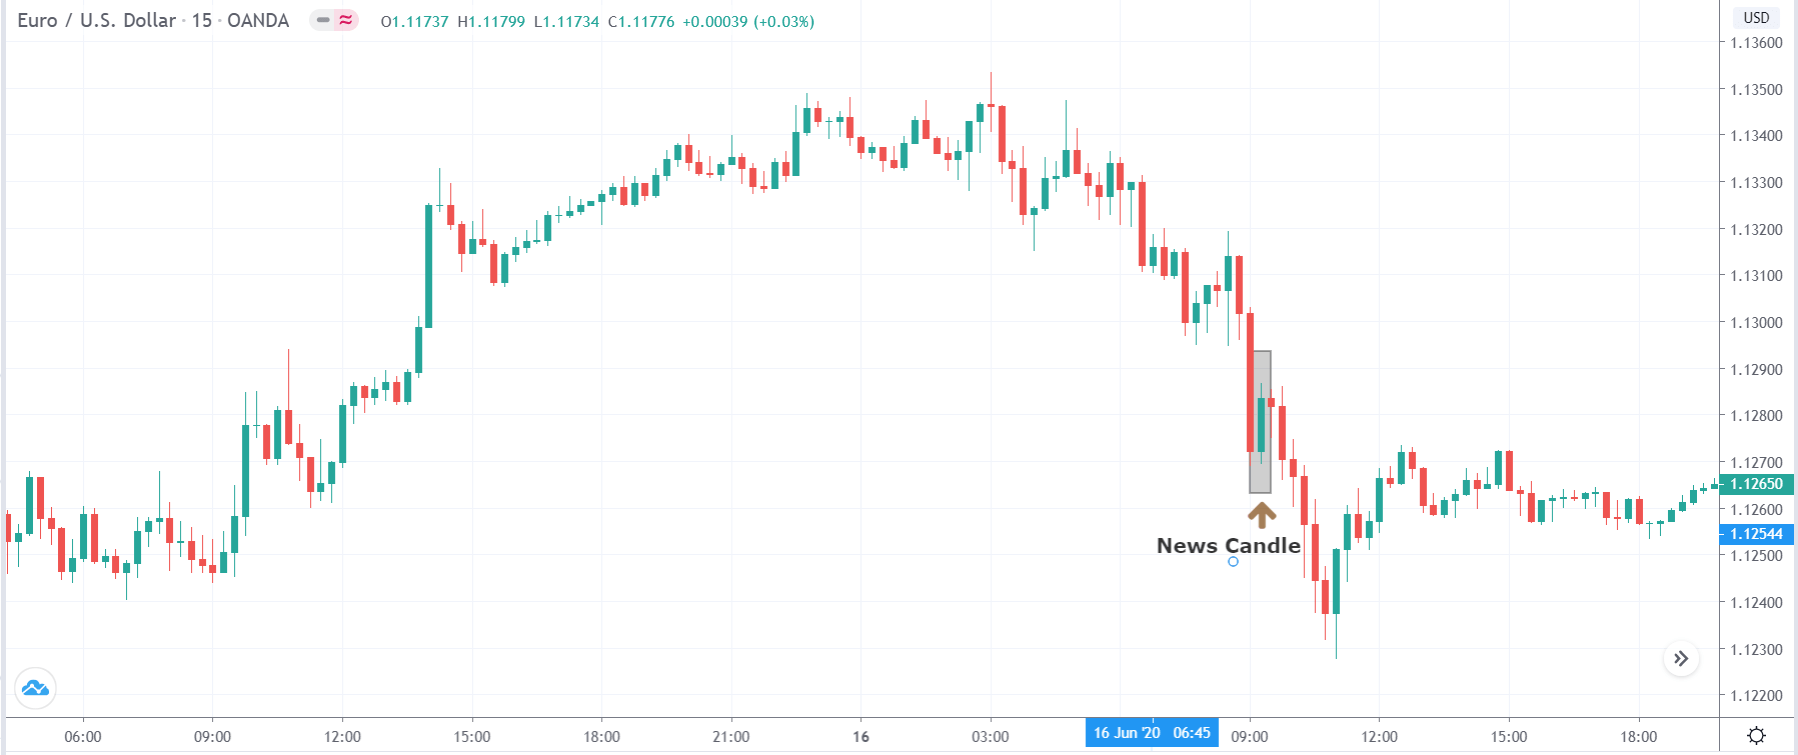
After the news announcement, the price moves higher, and volatility slightly increases to the upside. However, the price does not go much higher, and the major trend to the downside continues. Thus, it would be right to say that the news announcement had a positive impact on the U.S. dollar.

USD/JPY | Before the announcement
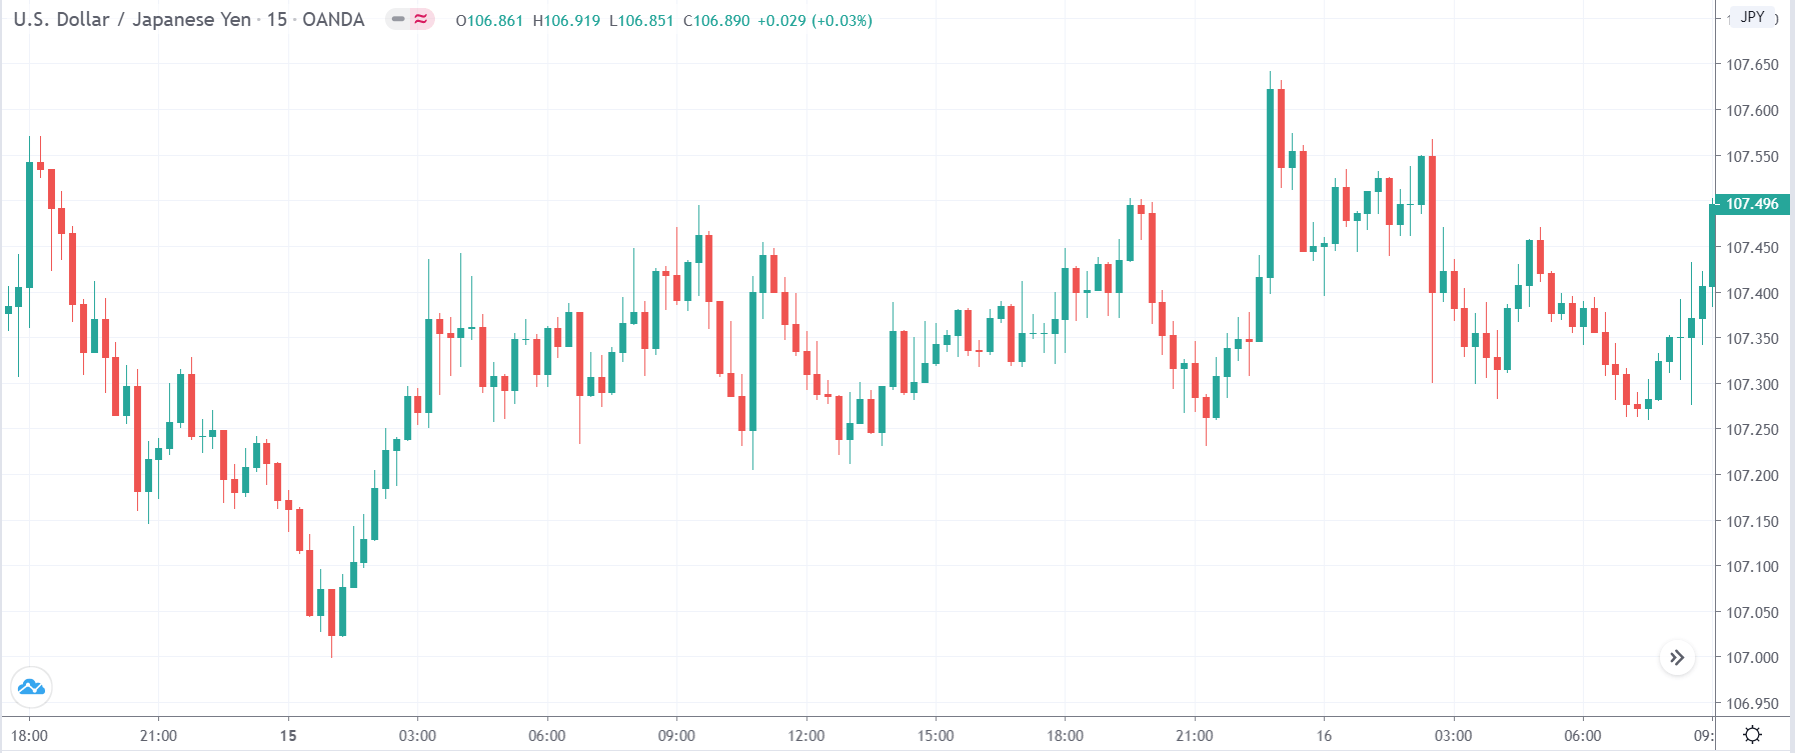
USD/JPY | After the announcement

The above images represent the USD/JPY currency pair, where we see that the market is moving within a ‘range’ before the news announcement. Just when the Industrial production numbers are to be released, the price is at the top of the ‘range,’ and volatility is high. Depending on the impact of the news release, we take a suitable position in the currency pair.

After the news announcement, the market moves lower by a couple of candles, as seen in the above image, and gets retraced by strong buyers who take the price above the ‘news candle.’ But since the price is again at resistance, it eventually moves lower and reaches the support. By this price action, we can say that the currency pair becomes highly volatile after the news announcement.

NZD/USD | Before the news announcement
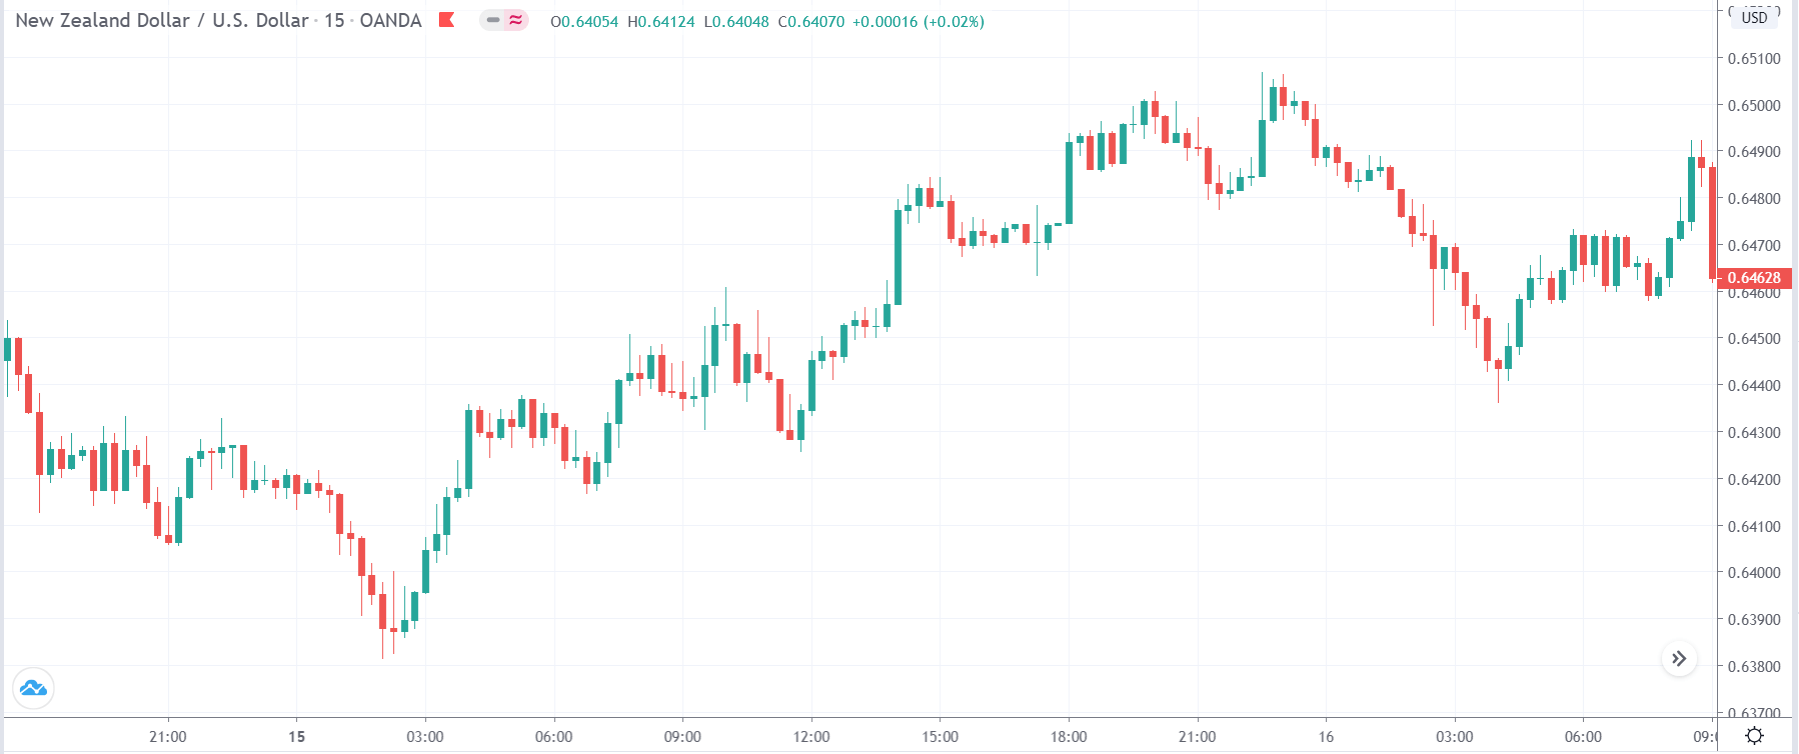
NZD/USD | After the news announcement

The above price charts belong to NZD/USD currency pair, where we see that before the news announcement, the price was moving higher, and now it has displayed a strong reversal pattern in the market, indicating a reversal to the downside. If the news release does not change the underlying price action pattern, one can take a risk-free ‘short’ position in the currency pair. This is how technical analysis is used in conjunction with fundamental analysis.

After the news announcement, the price moves higher by a little, and ultimately the reversal pattern dominates the market, and price makes a ‘lower low.’ Therefore, the slight bullishness that was witnessed due to the news announcement was of significance, and the market crashed.

We hope you got the gist on what the ‘Industrial Production Index’ is and its impact on the Forex price charts after its news release. In case of any questions, let us know in the comments section below. Cheers!


Categories
Forex Educational Library

AUDUSD – Cycle Analysis and Forecast

AUDUSD – Cycle Analysis and Forecast

The AUDUSD pair in daily chart is moving bearish as an A-B-C pattern, from the highest level reached on January 25 (0.81358 level). The segment BC developed a bullish divergence, which alerts us to the exhaustion of the bearish movement, this divergence is not a reversal signal. On the last sequence of the wave C, the price tested two times the 0.73179 level (FE 141.4 level).


In the 4-hour chart, the wave between B and C has fallen in five waves from 0.79163 to 0.73105 on July 02. From this level, the Aussie started an internal bullish move which reached the 0.74838 level, surpassing the previous high 0.74438 in time and shape. Currently, the price is moving in a range which could be the start of a new bullish cycle.


For the coming sessions, we foresee new upsides which could be activated as long as the price bounce from the area between 0.73562 and 0.73265, with a potential profit target area between 0.75382 and 0.75956. The invalidation level of this scenario is 0.73105.


Categories
Forex Educational Library

Forex.Academy 2018-2019 Outlook – CAD Group


Summary


Forex Daily News: In this post, we analyse the Canadian Dollar group against their main currencies. As a summary, the second half of the year and 2019, we foresee a corrective movement in the Canadian currency, which could come supported for a correction in oil prices to, then, give way to a new rally. After this correction, our central vision for the Canadian Dollar is a new appreciation scenario.

Additionally, we observe that it is likely that GBP and EUR would show the best performance against the CAD; on the opposite side, the Japanese currency and the Swiss Franc could have the worst performance against the Canadian Dollar.


USDCAD

The USDCAD is developing a complex corrective structure of a second bullish impulsive wave. The corrective structure has a bearish bias, which could find support in the area between 1.29607 to 1.28371. The key level to watch out is 1.2884, this level should convert on a critical pivot level (HHL).


EURCAD

EURCAD cross in the short-term has a bearish bias, probably could see new lows in 1.50 zone. In the mid-term, the cross moves sideways as a complex corrective. In the long-term, we foresee that the EURCAD could find fresh lows in the area between 1.47822 to 1.45662, from where the cross could start a new rally as a fifth bullish wave. Invalidation level is at 1.4442.


GBPCAD

Probably the GBPCAD cross shows the clearest movement of the CAD Group. The price is moving in a bearish A-B-C sequence, which could find support at 1.6410 level, from where the price could create a new connector and then initiate a rally. The new bullish sequence has a target the area between 1.8533 and 1.9266. Invalidation level is at 1.5837.


CADJPY

The CADJPY cross has been commented in a previous analysis, and we maintain the main idea which consists in to seek only long positions with a long-term profit target in the area between 94.69 and 95.30. Is probably that the cross makes a retrace to the area between 85.45 to 83.73 from where we could find new opportunities to incorporate us into the trend. Invalidation level is located at 82.17.


CADCHF

In the CADCHF cross, the lemma is “Buy the Dips” or “Watch the Breakout.” CADCHF is running sideways in an upper degree consolidation structure. The key level to control is 0.7636, after the breakout of this level, we expect more upsides to the zone between 0.7992 and 0.8245. In case that the price makes a false breakdown to the area between 0.7394 and 0.7289, it could be an attractive opportunity to look for the long side. Invalidation level is at 0.7124.


NZDCAD

In the long-term, NZDCAD is running sideways and making lower highs. The long-term pivot level is at 0.8640. For this cross, we expect only short positions; if the price makes a bullish move, the potential movement is limited to the area between 0.9253 to 0.9461. The long-term target area is between 0.8401 to 0.8098.


AUDCAD

Probably the AUDCAD cross is the less attractive to trade. As we can see in the weekly chart, it is running sideways since the second half of 2013. The price is moving inside a bearish cycle, which could find support in the “long-term pivot level” at 0.8919, from where AUDCAD could start to bounce. The invalidation level for the bearish cycle is at 1.0397.


Forex Daily News: Finally, as a technical note, considering that the AUDCAD is mostly bearish, by correlation, the CAD should perform better than the AUD for the period foreseen.

Categories
Forex Market Analysis

European Union and Japan Sign a Trade Deal – Forex and Indices – Daily Update – 17.07.18


Fundamental Overview


European Union and Japan sign a trade deal

Financial Market Updates: Japan and the European Union signed a trade deal amid uncertainty generated by the protectionist policy led by the Trump Administration. The trade deal creates the largest open economic area. The agreement promises to eliminate 99 per cent of tariffs.


Technical Analysis


EURUSD

Today the EURUSD pair failed the bullish continuation, remaining in the consolidation range, it suggests that the pair should continue with the previous bearish cycle. In consequence, we update our bias from a bullish to a bearish move. The potential sell zone (PSZ) is between 1.1760 and 1.1807 with a bearish target placed at 1.1293. Invalidation level is 1.1852.


GBPUSD

As noticed in previous Daily Updates, the GBPUSD pair in a 2-hour chart is moving sideways, the short-term pivot level at 1.3275 has failed, in consequence, GBPUSD should make a new lower low. The Pound could fall to the area between 1.3024 and 1.2885, completing a major degree bearish cycle. Invalidation level is at 1.3472.


USDCHF

The complex corrective structure that is developing the USDCHF pair in the 2-hour chart shows a signal more for a bullish continuation than a downward reversal move. In the last session, the Swiss currency tested and bounced from the potential buy zone. We foresee USDCHF making a new higher high with the target placed in the area between 1.0112 and 1.0141. Invalidation level is at 0.9857.


EURJPY

The EURJPY cross in the 2-hour chart is moving bullish in an ascending wedge; the price tested the exhaustion zone between 132.01 and 133.05, from where we expect a bearish reversal move as a bull trap. We foresee drops to the area between 129.87 to 129.28. Consider that if the price makes a bull trap after this, it is highly likely that the price will make a bullish failure pattern.


GBPJPY

The GBPJPY cross in the 2-hour chart is making a consolidation pattern after a bullish impulsive move, which could make fresh highs to the area between 150 and 150.70. Our vision for the cross is that the price could make a limited low to the 146.2 level before it continues its previous bullish trend. Invalidation level is 143.799.


FTSE 100

As commented in previous Daily Update, FTSE 100 in the 2-hour chart continues consolidating between 7,720 pts and 7,550 pts. We maintain our bias as neutral in FTSE 100 index.


DAX 30

DAX 30 in the 2-hour chart soared above the 12,600 pts and is near to reaching the exhaustion zone at 12,695 pts. The next control level is 12,807 pts which could drive to 13,020 pts, completing an internal bullish cycle. Invalidation level of the bullish cycle is 12,104 pts.


Categories
Forex Market Analysis

Forex and Indices Daily Update – 16.07.18


Forex Fundamental Analysis


New Zealand CPI (YoY) increase 1.5 per cent in June.

The yearly inflation change in New Zealand increased by 1.5 per cent, below the 1.6 per cent foreseen by analysts and advance from the 1.1 per cent reported in April. Housing and household utilities advanced 3.1 per cent, followed by rentals which were up 2.5. The climb in oil prices, almost 10 per cent, boosted the transport sector to increase the CPI (YoY) 2.0 per cent.


source: tradingeconomics.com


 Technical Market Analysis


EURUSD

In the last session, EURUSD surpassed the Short-term Pivot Level at 1.1690. Now we expect a consolidation structure as a flag pattern before it continues increasing the bullish momentum to the target area at 1.19067. Invalidation level is 1.15080.


GBPUSD

The GBPUSD pair is still moving sideways in the 2-hour chart, testing the Short-term Pivot Level at 1.3275. The breakout of this level should activate the bullish continuation with a target placed in the 1.3475 zone. Invalidation level of the new bullish cycle is 1.30494.


USDCHF

The bearish move after the bull trap looks like a first bearish impulse. From now we should expect a retrace in three waves, probably to the 1.0009 area before it continues with another decline. In the long term, the USDCHF is bullish, in consequence, we will maintain neutral for this pair expecting opportunities to go long with the main trend.


EURNZD

The EURNZD cross in the 2-hour chart has broken down the ascending short-term trendline at 1.7248 with a bearish high momentum candle. We expect more drops with a target placed at the psychological level of 1.70. Invalidation level is at 1.73782.


GBPNZD

The GBPNZD cross in the 2-hour chart has broken down the ascending trendline as the same way that the EURNZD has. This suggests that we should see more strength in the NZD group against the other currencies. The first target is at 1.92393 from where we could see an exhaustion of the bearish cycle. Invalidation level is at 1.95802.


FTSE 100

The FTSE 100 in the 2-hour chart continues to consolidate, developing a complex corrective structure. In terms of the traditional Technical Analysis, the structure could be a Diamond Pattern, if this is correct, we should see declines to the 7,400 area, if the falls extend, the next bearish target area could be 7,100 pts zone. We prefer to maintain neutral expecting for long positions.


DAX 30

DAX 30 in the 2-hour chart still is moving below the 12,600 pivot level. We can consider two scenarios: the first one is after the 12,600 level breakout to expect more climbs to the area between 12,695 to 12,742. The second one is if the price breaks down, the bearish target could be 12,040 pts. In the same way that in the FTSE, our position changes from bullish to neutral expecting long positions.


Categories
Forex Market Analysis

Forex and Indices – Daily Update – 13.07.18


Fundamental Forex Trading Overview


BoE’s Deputy Governor Cunliffe suggests a delay in a rate hike.

The Bank of England’s (BoE) Deputy Governor, Sir Jonathan Cunliffe, said on Friday that we should be cautious in an interest rate increase and that there are still arguments for a “stodginess” policy. Cunliffe suggests a delay in a rate hike due, despite the economic growth, to the wage rate is not increasing to the 3 per cent that the BoE had initially forecasted.

The BoE’s next Monetary Policy Committee meeting will be on August 2, for this meeting most economists polled expect the rate to increase.


Technical Analysis


 EURUSD

The EURUSD in the 2-hour chart is bouncing from the Potential Buy Zone as expected in our previous Daily Update on Thursday 12th when we commented that EURUSD was making higher highs and higher lows. Now when the pair is testing support in the green box, we expect new upsides to 1.19067 (orange box – maturity area) completing a major degree connector. Invalidation level is 1.15080.


GBPUSD

The GBPUSD in this 2-hour chart is completing a new bearish leg in the Potential Buy Zone. We foresee a breakout of the short-term trendline and the continuation of the previous bullish cycle with a target placed in the 1.3475 area. Also, the exhaustion area is the target area of the inverted head and shoulders pattern which will be active once time the short-term pivot level was surpassed. Invalidation level of the new bullish cycle is 1.30494.


USDCHF

As noticed in our last Forex and Indices daily update, the Swiss currency is being the weakest currency. The USDCHF in the 2-hour chart soars to the highest level since May 2017. Using the correlations in the US Dollar group with DXY, EURUSD and GBPUSD, we could suspect that this is a false breakout.


EURCAD

The EURCAD cross in the 2-hour chart has broken down the short-term pivot level at 1.53684 and made a pullback to the same level turning the support into resistance. We expect more falls with a target placed in the area between 1.5144 to 1.5061. Invalidation level is 1.55225.


GBPCAD

The GBPCAD cross in the 2-hour chart is consolidating testing the 1.73 psychological support level. It is likely that the price moves bullish making a false breakout before to continue the previous bearish impulse. Invalidation level is at 1.76907.


FTSE 100

The FTSE 100 in the 2-hour chart continues to consolidate, developing a complex corrective structure and testing around the 7,700 level. We foresee a limited upside for the British index to 7,792 pts. Invalidation level is 7,508.


DAX 30

The DAX 30 in the 2-hour chart is moving bullish, testing the 12,600 pivot level. We expect more climbs to the area between 12,695 to 12,742. The critical level to watch is the 12,807 pts, from where if the price surpasses it, DAX could rise to 13,020 pts. Invalidation level is 12,104.


Categories
Forex Market Analysis

U.S. Inflation Grows Firmly In June – Forex and Daily Update – 12.07.18


Fundamental Overview


U.S. inflation grows firmly in June.

Forex Trading Signals: The Consumer Price Index (YoY) in the United States in June reached the highest level in 6 years, climbing to 2.9% from the 2.8% reported in May. According to what was stated by the U.S. Bureau of Labor Statistics, the CPI in June increased driven by the food index, which advanced 0.2 per cent; and the gasoline index, which grew by 0.5 per cent. Despite this increase, the energy index decreased 0.3 per cent, mainly due to the Energy Services index, which fell 1.5 per cent in June.

Forex trading signals Source: Forex Trading Signals – Forex.Academy Collection


Technical Overview


EURUSD

The EURUSD 2-hour chart is showing bullish signals due to the price making higher highs and higher lows. Currently, the common currency is making a retrace to the green box, from where we expect new upsides to the 1.19067 area, completing a major degree connector. Invalidation level is 1.15080.


GBPUSD

The GBPUSD 2-hour chart is making a new bearish leg after the upward sequence in 5 moves started on June 28th. We expect a continuation of the previous bullish cycle from the zone between 1.3181 to 1.3099 with a target placed on 1.3475 area from where the pound should decide the next moves. Invalidation level of the bullish cycle is at 1.30494.


USDCHF

The USDCHF 2-hour chart is making a breakout of the consolidation range which is developing from the first half of June. The RSI oscillator shows that price has a bullish bias. In the short-term, we expect a limited retrace to incorporate to the bullish long-term trend. The invalidation area is 0.98579.


EURCHF

The EURCHF cross in the 2-hour chart is moving bullish after the breakout above 1.1565 level. We expect more upsides which could drive the cross to the targets at 1.1768 in the short-term, and 1.19475 in the long-term. Invalidation level is 1.14799.


GBPCHF

The GBPCHF cross has broken up the psychological 1.32 resistance. We expect a retrace to the area between 1.319 until 1.31057, from where the price should continue rising to 1.3312 level in the short-term and the 1.3442 level in the mid-term. Invalidation level is 1.3023.


FTSE 100

FTSE 100 in the 2-hour chart continues moving sideways in a complex corrective structure, but the main trend is bullish. We expect a limited upside to 7,792 level, from where we should wait for a new connector completion. Invalidation level is 7,508.


DAX 30

The DAX 30 is bouncing from the Potential Buy Zone (green box), from where we expect an upward movement to the area between 12,695 to 12,742. If DAX climbs above 12,807 pts, the German index could reach and test the 13,020 level resistance. Invalidation level is 12,104.


Categories
Forex Market Analysis

Forex and Indices – Daily Update – 03.07.18


Fundamental Overview


Asian Session with all eyes placed on the RBA decision.

Forex and Indices: In the Overnight session, markets will place their eyes on the Board of Reserve Bank of Australia (RBA) interest rate decision in which the analysts’ consensus expects that Governor Philip Lowe and the Board members decide to keep the interest rate at the record low 1.50% which is unchanged since August 2016.

Despite the unemployment rate drop in May to 5.4%, and the inflation rate kept unchanged in May at 1.9%, being near to the RBA inflation target; The cooling on housing market and  the increased volatility in global markets due mainly to the tariffs conflicts, could drive to the RBA  to decide to keep the interest rate unchanged again.

Forex and Indices - Daily Update

Source: Forex.Academy Collection – Forex and Indices


Technical Analysis


EURUSD

The pair still is moving in a bearish wedge pattern which, if it breaks below 1.15649, could drive the price to a new lower low ending the bearish cycle near to the 1.1450 zone coinciding with the lower trendline of the bearish wedge. In the opposite case, if EURUSD breaks above 1.16801, the common currency could drive to test the invalidation level placed at 1.1852.


GBPUSD

GBPUSD is still running in a bearish wedge and has a new lower low pending before the cable starts a new bullish cycle. This lower low could be developed as a Bullish 2B pattern (Bear Trap) as a reversal pattern. As long as the price does not make a reversal pattern, the price will continue its bearish bias. Invalidation level of the bearish cycle is at 1.34725.


USDCHF

USDCHF is developing a triangulation structure. The RSI oscillator shows that the price has a bearish bias. However, as the price doesn’t have a definite trend in the short-term, we will expect a false breakout before we define our bias for this pair. In the long-term, the Swiss currency is consolidating a rally which started on February 15th, 2018.


EURAUD

The EURAUD cross maintains a bullish bias, due to the price moving inside an ascending wedge. Additionally, RSI is running in an ascending trend and is above the 60 level. We can expect a false breakout to the 1.59 zone before it completes the bullish cycle. If the price falls below 1.5702, we could evaluate short positions.


GBPAUD

The GBPAUD 2-hour chart shows a sideways move, as long as the price moves above 1.78747. The cross will have a last bullish target pending, placed at 1.8085 with an invalidation level below 1.78080, from where we will consider short positions with a profit target in the 1.74 zone.


FTSE 100

The FTSE 100 is moving sideways as a complex corrective structure consolidating the March to May rally. In the middle of global volatility in the stocks markets, we prefer to consider long positions rather than the short positions. The short-term support to control is 7,500 pts.


DAX 30

The DAX 30 2-hour chart shows that the German index has found support at 12,100 pts. From this area, we could start to propose potential zones for entry in the long side.


Categories
Forex Market Analysis

Forex and Indices – Daily Update – 29.06.18


Fundamental Overview


“Green sprout” in New Zealand?

Forex Market Update: The increase in building consents in New Zealand which reached 3,407 permits in May, the highest level reached since June 2004, represents 7.1% after the fall of 3.6% registered in April. Will this be a green outbreak of improvement in New Zealand’s macroeconomic conditions or will it be only an isolated effect?


Forex Market UpdateSource: Forex.Academy Collection – Forex Market Update


Technical Analysis


EURUSD

The pair is moving in a bearish wedge pattern which could drive to the price to a new lower low ending the bearish cycle near to the 1.145 zone coinciding with the lower trendline of the bearish wedge. Invalidation level of the downward cycle is at 1.18523.


GBPUSD

GBPUSD is moving in a bearish wedge in the same way as the EURUSD. We expect a spike to the PRZ before it makes a reversal move, maybe in the next week. A key level to watch out for is 1.30 as a psychological level. Invalidation level of the bearish cycle is at 1.34725.


USDCHF

The Swiss currency is moving in a triangulation structure which represents a continuation of the previous bullish move. However, as an inverse correlation with EURUSD, the movement could be a false breakout as a bull trap. In this pair, we will maintain in a neutral position before taking a position in the market.


EURCHF

The EURCHF cross is turning bullish after the breakout above the 1.1565 level, a throwback to this level could drive the cross to the 1.1772 short-term targets. RSI is supporting this scenario with the upward trendline.


GBPCHF

The GBPCHF 2-hour chart shows the importance of the invalidation level of a proposed scenario and its ex-post analysis. In this cross, we expected a limited retrace to the area between 1.3124 and 1.3089 for an upward move, with the profit target in the area between 1.3323 and 1.3374. However, after the retrace to the blue box, the GBPCHF cross continued falling. Watching the AO oscillator between May 18th and June 1st, we can appreciate that the bearish move corresponds to a bearish wave 3, then the retrace analysed is a wave 4. In consequence, the final movement as a bearish wedge pattern, which should end the bearish cycle.


FTSE 100

The FTSE 100 is moving sideways with a bearish bias which is correcting the previous rally realised from March to May. Despite the bearish bias of global indices, we prefer to avoid the short positions expecting the timing for entry in the bullish side.


DAX 30

In the Thursday 28th trading session, DAX 30 fell to the control level finding support to the corrective move. Now we expect consolidation on the 12,100 pts from where the German Index could start a new bullish cycle.


Categories
Forex Market Analysis

Good News Expected for RBNZ Decision – Forex and Indices – Daily Update – 27.06.18


Fundamental Overview


Good News Expected for RBNZ Interest Rate Decision.

During the overnight session, Stats NZ released the Trade Balance data from New Zealand, which shows an improvement in the commercial situation in June. Exports of meat grew by 17% reaching $817M. While the meat exported increased by 12 per cent reported Stats NZ, the destination of the main export was China, which rose by 27 per cent reaching $1.2B in June. The European Union exports also increased rising by 17 per cent ($664M).

On the other hand, vehicles, parts, and accessories led imports by 25 per cent, climbing to $924M. Whereas, Oil imports were reduced by 30 per cent, falling to $455M in May.

rbnz interest rate decision

Source: Forex.Academy Collection.


Technical Analysis


EURUSD

EURUSD is making the retracement of the first impulsive move testing the blue box from where the euro could start the continuation of the previous movement. RSI is testing support above the 40 level, which makes us suspect that the EURUSD pair could be testing support. Our mid-term vision is that the common currency could beat 1.1853, even reaching the target placed at 1.19467. Invalidation level is at 1.1508.


GBPUSD

The GBPUSD pair is still consolidating the previous impulsive move in the descending long-term trendline. The price is moving in the Potential Reversal Zone (Blue Box) from where we expect the bullish reaction as a continuation of the previous movement. We foresee fresh highs with the target at 1.3443. Invalidation level is at 1.31020.


USDCHF

USDCHF is moving slightly bullish consolidating in the long-term ascending trendline. Our main vision for USDCHF is the formation of a flag pattern reaching the 0.99277 level before continuing with the previous bearish move with a target placed on the area between 0.97225 and 0.96495. Invalidation level of this scenario is at 0.99909.


EURNZD

EURNZD continued developing a bullish impulsive move. As we forecasted in a previous Daily Update (June 20th, 2018), the cross is moving near to the target area at 1.7064. Still, we foresee a more upside to the 1.7148 level. Invalidation level is 1.6572.


GBPNZD

GBPNZD still is moving in an ascending channel to the Potential Reversal Zone proposed in our Daily Update for June 20th. The price could reach the target between 1.944 and 1.958 area, from where the cross should complete a bullish cycle. Invalidation level is 1.8909.


FTSE 100

The FTSE 100 index bounced from the sell-off performed on the Monday 25th trading session; despite this bounce, we expect more dips. FTSE should reach at least the 7,468.3 level before it completes the short-term bearish cycle. From this zone, we could build a new bullish connector. If the index breaks down, the Control Level is likely to reach from the 7,182 level to 7,073 area. Watch out for the RSI which is moving sideways between the 40 and 60 level; this coincides with the consolidation pattern that still is running. Invalidation level of the bearish scenario is 7,793.5.


DAX 30

DAX 30 is testing support on the PRZ forecasted at 12,238 pts. The RSI level at 26 makes us foresee that the German index is developing a wave three. In consequence, more downsides are pending; likely DAX 30 plunge below 12,100 pts. Invalidation level of the bearish cycle is at 13,170 pts.


Categories
Forex Market Analysis

Forex and Indices Daily Update 25.06.18


Fundamental Overview


Understanding the Conference Board (CB) Consumer Confidence Index (CCI).

Tomorrow, the U.S. CB Consumer Confidence Index will be released. This reflects the business conditions and likely developments for the months ahead. The report is issued monthly and is a barometer of the health of the U.S. economy from the perspective of the consumer.

The current CCI level reported in May is 128 pts, and the analysts’ consensus for June is a decrease to 127.6 points. The decreasing could be attributed to the protectionist policy which the Trump Administration is boosting. Despite this decline, consumer confidence keeps having record highs. The highest level reached in the year is 130 pts, the record high since December 2000.

CCI level -forex daily chart trading strategy

Forex Daily Chart Trading Strategy


Technical Analysis


FOREX DAILY CHART TRADING STRATEGY

EURUSD

Since June 22nd, the EURUSD has made an impulsive move reaching the short-term target area between 1.17043 and 1.17617. Our vision is that the common currency could strike the 1.1853 level before it starts a brief retracement to the area between 1.1679 and 1.15892, from there, the price should make a new rally with a target placed at 1.19467. Invalidation level is at 1.1508.


GBPUSD

GBPUSD bounced on June 21st aided by the Bank of England monetary policy decision. Now the price is consolidating the previous impulsive move. We should see a limited fall in three waves to the area between 1.3237 and 1.3165, from where we foresee fresh highs with the target at 1.3443. Invalidation level is at 1.31020.


USDCHF

The USDCHF pair is testing the long-term ascending trendline. Our forecast for USDCHF is that it could make a flag pattern reaching the 0.99277 level before we see the continuation of the previous move with a target placed on the area between 0.97225 and 0.96495. Invalidation level of this scenario is at 0.99909.


EURJPY

The EURJPY cross is moving in a corrective structure as an A-B-C Pattern, which could make a new lower low. RSI Oscillator is running supported by an ascending trendline refecting the corrective structure of the principal trend. We foresee a new bearish move to 124.94 and 126.62; this area converges with the ascending long-term trendline from where EURJPY could start a new rally. Invalidation level of the bearish cycle is 130.347.


GBPJPY

The GBPJPY cross is building a consolidation pattern as a flag pattern, which could make fresh highs to the area between 149.34 and 150.70. Our vision for the cross is that the price could reach the bearish mid-term trendline before it collapses to the lower line of the ascending channel completing a bearish flag pattern of major degree. The next key support is 143.209, invalidation level of the main bearish cycle is at 152.775.


FTSE 100

The FTSE 100 index started the week by falling for the sixth consecutive week. In this session the British index broke down the key support at 7,548, the low reached on June 18th. As we forecasted, FTSE continues their selloff approaching the Potential Reversal Zone in the 7,400 area, from where FTSE could build a new bullish connector. If the index breaks down, the Control Level is likely, that reaches from 7,182 level to 7,073 area. Invalidation level of the bearish scenario is 7,793.5.


DAX 30

DAX  30 is moving bearish in the same way that FTSE 100 is developing a Dead Cat Bounce Pattern. Today, the German index has fallen to the Potential Reversal Zone forecasted, from now we are cautious because the index could start to bounce. The price action, and RSI Oscillator and Awesome Oscillator do not show divergences or reversal signals. To summarise, the short-term bias is bearish. Invalidation level of the bearish cycle is at 13,170 pts.


Categories
Forex Market Analysis

What to Expect to the Dollar Index during the Second Half of the Year?

What to Expect to the Dollar Index <DXY> during the Second Half of the Year?

Dollar Index

The Dollar Index <DXY> has developed an upward impulsive movement during the first half of the year. The bullish cycle began on February 16th when it touched the lowest level of the year at 88.25. From this level, it started the first bullish impulse that took it up to 90.93, where it began a consolidation structure that finished in April; a period in which DXY climbed as a wave 3 from 89.23 to 95.03. Finally, after a retracement as a wave 4, the greenback soared to 95.53, exceeding the highest level attained in November 2017 when the price reached 95.15 and completing a major grade cycle.

The fact that DXY has surpassed last November 2017’s peak makes us think the Dollar Index might make new highs in the long term. During the second half of 2018, we expect the US Dollar to make a corrective movement as an A-B-C pattern that should carry it to seek support at the 93.27 level in the first instance. Then, after a corrective upward sequence to 94, we could see it fall as a C pattern to the area between 91.64 and 91.03, from where a new upward cycle could begin.


Categories
Forex Market Analysis

U.S. Housing Starts Soars – Forex and Indices – Daily Update 19.06.18


Fundamental Overview


U.S. Housing Starts soars to 2007 highs in May.

Daily Forex Technical Analysis: The U.S. Housing Starts surged 1.35 million in May, the highest level in near to 11-years and over the 1.31 million forecasted. Building permits fell to 1.301 million, under the 1.35 million expected by the analysts.

This buoyant data is attended by the housing market sentiment which fell to 68 points in June from the 70 points reported in June. This decrease in the homebuilder’s sentiment is produced mainly by the rising costs in lumber prices.

On the other hand, the 20-City Home Price Index in the US reported by S&P/Case-Shiller in May soared to the record high 208.62 points, the highest level previous to the 2008 financial crisis.


Daily Forex Technical Analysis


EURUSD

Tha pair EURUSD is moving sideways finding to test the May 29th level support at 1.15102, and it looks like the price is making a bottom pattern. For it to place us on the bullish side in EURUSD, we expect the short-term resistance breakout at 1.16445.


GBPUSD

The Pound broke down the low of the May 29 (1.32045 level)  losing the 1.32 psychological level. Now we expect that the price will complete the bearish cycle in the area between 1.3109 and 1.2936, from where the price should start to bounce at least to the 1.3298 level.


USDCHF

USDCHF is running bullish to the parity making a flag pattern. Our vision for the Swiss currency is that it could make a new bearish leg with a mid-term target on 0.98 level.


EURCAD

EURCAD is developing an expanding triangle inside an ascending channel; we expect that the cross makes a new high to the 1.555 area before we see more drops to the 1.49 zone.


EURAUD

EURAUD reached the mid-term target zone in the 1.57 area. We foresee that if the cross breaks down the short-term trendline, EURAUD will complete a flag pattern, which should drive to new lower lows, likely to 1.53 area.


DAX 30

DAX 30 is moving laterally in a major degree structure testing the long-term pivot level at 12,652.2. A breakdown of this level could drive the price to test the short-term support at 12,547.6, it could even fall to 12,300 area, from where we expect the start of a new rally.


FTSE 100

FTSE 100 broke down the May-29th low making a new lower low; this makes us foresee that the British index should see a new lower low, probably to the 7,400 area, from where FTSE should build a new bullish connector.


Categories
Forex Market Analysis

Forex and Indices – Daily Update – June 07th, 2018

Forex and indices trading signals for the end of the trading session of June 07th, 2018 and short-term forecast for the coming sessions. In this issue, we make a follow-up of the price cycles of: EURUSD, GBPUSD, USDCHF, EURAUD, EURJPY, FTSE100 and DAX 30.


Hot Topics:


  • Pairs against the Greenback in key levels
  • Euro crosses close to make a second leg
  • European indices trading signals remain with bearish bias but are not activated.

Pairs Against The Greenback In Key Levels

EURUSD reached the 100% of equal waves in the 1.1831 level; this suggests is that the common currency should make a corrective move, probably to the area between 1.172 to 1.166 levels. The bullish target long-term is the area between 1.1889 to 1.194 levels. Invalidation zone is below 1.1616 level.


USDCHF reached the blue box zone from where we anticipate that the Swiss currency should start a bounce. For this pair, our position has changed from bearish to neutral.


GBPUSD, as expected in the previous daily update, is making a corrective move as a bearish connector, where we expect more rises to the pound. Short-term bullish target is between 1.3485 and 1.36 levels. Invalidation level is below 1.3254.


Euro Crosses Close To Make a Second Leg

EURJPY has reached our target area for the first cycle. By the Alternation Principle from the Elliott Wave Theory, we foresee a complex correction, probably a sideways structure. In principle, the correction could end near 128.6 level. From this zone, the price should pay its bearish divergence. As our readers could see in the chart, the corrective sequence is not tradeable (dashed line.) Invalidation level is 126.330.


For EURAUD we have two scenarios. The first scenario consists of the completion of the internal bullish cycle with the price reaching the 1.5547 level, where it could begin a corrective move. The second scenario is for the price to make a corrective sequence in three waves to the 1.5382 area, where the cross could start a rally to the 1.5547 level. If it soars above the Control Level at 1.5621, it is likely that the price would complete its internal bullish cycle in the zone between 1.57025 to 1.57612 level. Invalidation level is at 1.5282.


European Indices Remain With Bearish Bias But Are Not Activated

The FTSE closed the session in the blue box, the potential bearish move with the target in the area between 7,468 to 7,390.5 is active. If the British index breaks down and closes under the 7680, the bearish targets will be activated. The invalidation level remains above 7,803 pts.


In the same way, the DAX remains with a bearish bias short term, selling positions will activate only if the price breaks down and closes below 12,700 pts, with a profit target at 12,500 pts, and the potential extensions to deeper falls to 12,300 and 11,900 pts. Invalidation level remains above 13,102 pts.


Categories
Forex Market Analysis

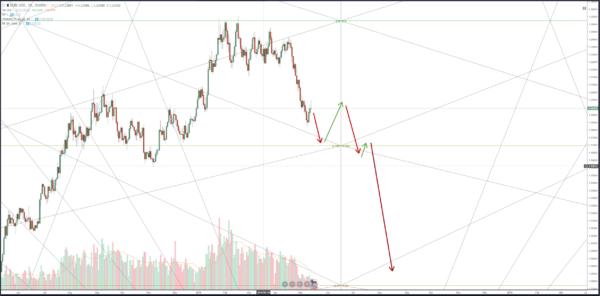
EURUSD Total Capitulation Ahead, Target 1.08 and Beyond

The future ahead is extremely bearish. I’m talking > 1,000 pips bearish. I’m talking close to parity with the USD bearish. Leaving out the myriad of Financial Astrology analyses, the pure geometric configuration of the EURUSD chart shows impending doom over the next few months.

This chart is showing one of the most dangerous and bearish setups the EURUSD has seen in years. Consider that the new Square of 90 starts soon (June 18th, 2016) and we always see major trend changes at the end/beginning of a new Square of 90. The last time we had a new Square was back on February 3rd, 2013. Also, if you observe the monthly chart, we have a very high likely hood of being in the very beginning of a 3rd wave lower, very possibly near parity with the USD at 1.01. Either way, expect the rest of the year in the EURUSD to display very large and expansive trading moves that will continue into the 2nd quarter of next year. The bullish bias has yet to show itself, and when it does, I will post on that possibility. Otherwise, extremely bearish drives ahead.