Categories
Forex Fundamental Analysis

What Should You Know About Industrial Production MoM Forex Indicator?

Introduction

Before the Service sector dominated the Industrial sector as a significant contributor to the GDP, it was the industrial production alone that was seen as a measure of economic growth. It still holds for many developing economies. Economies like China, Japan, India, etc. all had significant industrial revolutions that helped their countries to improve their economy. The industrial sector still contributes a considerable percentage to the economy and employs millions of people.

What is Industrial Production MoM?

Industrial Production: It refers to the total output produced by the industrial sector. Here the industrial sector consists of the mining, manufacturing, electric, and gas utility sectors. It is like a mini-GDP report for the industrial sector. By definition, it must be apparent that it primarily deals with tangible commodities or physical goods. On the other hand, The Service sector comprises of non-tangible entities largely.

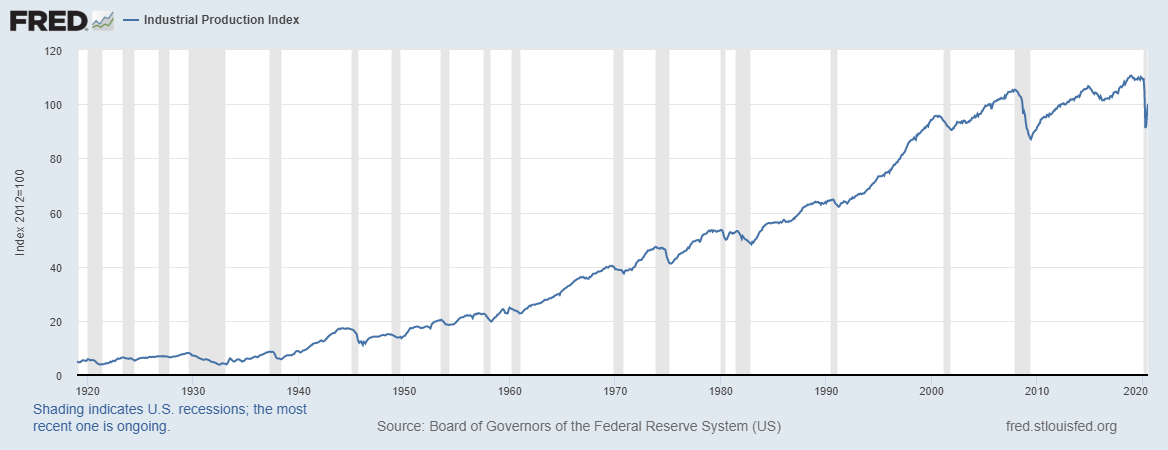
The Industrial Production Index goes as back as 1919 if required, and is published by the Board of Governors of the Federal Reserve System in the United States. The extended time-frame availability of data makes it a more robust, reliable economic indicator as more data points are available relative to other sectors.

The data is aggregated by combining data in different units. Some of the data may be in dollar terms, some may be in tonnes (e.g., the weight of barrels of oils and steel), or inferred by the number of hours worked. The logged-in hours are obtained from the Bureau of Labor Statistics. It is expressed as a percentage of real output relative to a base period. The base year is currently 2012. The methodology incorporated to calculate the Industrial Production is the Fisher Ideal Index, where the contribution of each sector is weighted (the higher the contribution, the higher is the weightage in the index calculation).

Industrial Production Indices comes in YoY and MoM versions comparing production size with the previous year and month, respectively. The YoY figures deem more use to analysts and government officials to analyze the performance of the industrial sector for this financial year. The MoM (Month over Month) figures are useful for closely monitoring for the expected uptrends or downtrends during business cycles. The MoM figures are more useful for investors in this regard.

How can the Industrial Production MoM numbers be used for analysis?

We have to understand the significance of this statistic historically. Before the development of the service sector, i.e., before the era of computers and the internet, the most industrialized countries were the most advanced economies. Countries that had many factories manufacturing tons of commodities were seen as highly advanced economies back in the day. Hence, it is no surprise that at such times the Industrial Production figures were a direct measure for the economy’s economic activity and growth.

The general trend in economic growth has been that underdeveloped economies have the primary sector as a significant contributor to the GDP. The developing economies have the secondary sector (industrial sector) as the primary contributor to the GDP, while the developed economies have the tertiary (or service) sector.

For the United States, the Industrial Sector now contributes less than 20% to the overall GDP, while more than 80% comes from the Service sector itself. Although it may sound like only 20%, it is only in comparison, but individually the industrial sector is in itself huge and employs millions of people. 15-20% is still a significant contribution, and that is the reason why it is still being published as well as analyzed by investors, traders, analysts frequently to infer significant economic conclusions.

With machine automation, the advancement of technologies, and the introduction of artificial intelligence, many traditional jobs in the industrial sector are getting replaced. This trend is likely to continue further down the line. As of now, the Industrial Production figures bear some relevance, though it is only a matter of time that its contribution further falls and is overlooked by investors and analysts.

(Image Credit: St. Louis FRED)

The industrial sector is more sensitive to business cycles as well as economic shocks, as evident from the historical plot. The current COVID-19 pandemic has had a more significant impact on the industrial sector than the service sector due to the nature of business.

Impact on Currency

Since the Industrial Production figures only account for a few sectors of the economy, hence it is not a macroeconomic indicator encompassing all industries into its statistics. For this reason, the relative significance of this indicator in the currency markets is less. Whereas, investors looking to invest in stocks of companies belonging to the Industrial sector use Industrial Production MoM figures to make investment decisions. Overall, it is a low-impact coincident indicator that bears no significant volatility in the currency markets but has a significant influence on the equity markets.

Economic Reports

The Board of Governors of the Federal Reserve System publishes reports of the Industrial Production statistics as part of its monthly “G.17 Industrial Production and Capacity Utilization” report on its official website. It is released around the 15th of the month for the previous month. It is a preliminary estimate and is annotated with a superscript ‘p’ in the tables. It is subject to revision in the subsequent five months as more data becomes available. The report details both seasonally adjusted and unadjusted versions for our convenience.

Sources of Industrial Production MoM

The Federal Reserve publishes Industrial Production MoM reports on its official website. The same statistics are available with more tools for analysis on the St. Louis FRED website. Similar Industrial Production MoM statistics for most countries is available on the Trading Economics website.

How the Monthly Industrial Production Data Release Affects The Price Charts

In the US, the monthly industrial production data is released by the Federal Reserve about 16 days after the month ends. It measures the change in the total inflation-adjusted value of output produced by manufacturers, mines, and utilities. The most recent data was released on August 14, 2020, at 9.15 AM ET and can be accessed at Investing.com here. An in-depth review of the industrial production data release can be accessed at the Federal Reserve website.

The screengrab below is of the monthly industrial production from Investing.com.

As can be seen, the industrial production data is expected to have a low impact on the USD upon its release.

The screenshot below represents the most recent changes in the monthly industrial production in the US. In July 2020, the US industrial production increased by 3% down from a 5.7% increase in June. This change was in line with analysts’ expectations of a 3% change. Therefore, this is expected to be positive for the USD.

Now, let’s see how this release made an impact on the Forex price charts.

EUR/USD: Before the Monthly Industrial Production Data Release 
on August 14, 2020, Just Before 9.15 AM ET

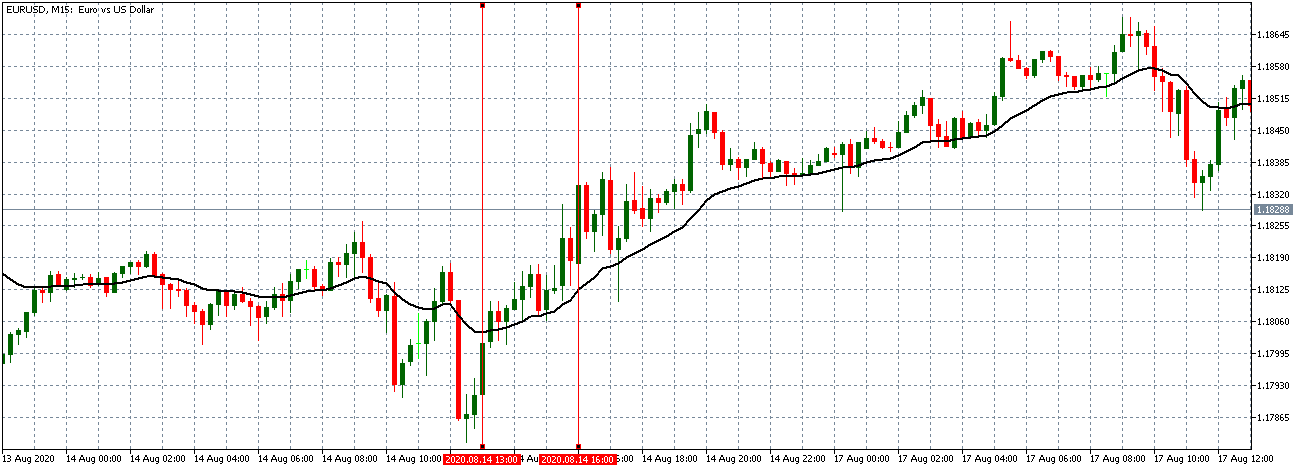
Before the data release, the EUR/USD pair was trading in a renewed uptrend with the 15-minute candles forming above a steadily rising 20-period Moving Average. This pattern indicates that the USD was weakening against the EUR.

EUR/USD: After the Monthly Industrial Production Data Release 
on August 14, 2020, at 9.15 AM ET

As expected, the pair formed a 15-minute bearish candle after the data release indicating a  momentary strength in the USD. The data was, however, was not significant enough to bring forth a change in the trading pattern. The pair continued trading in the earlier observed uptrend with the 20-period Moving Average steadily rising.

Now let’s see how this news release impacted other major currency pairs.

NZD/USD: Before the Monthly Industrial Production Data Release 
on August 14, 2020, Just Before 9.15 AM ET

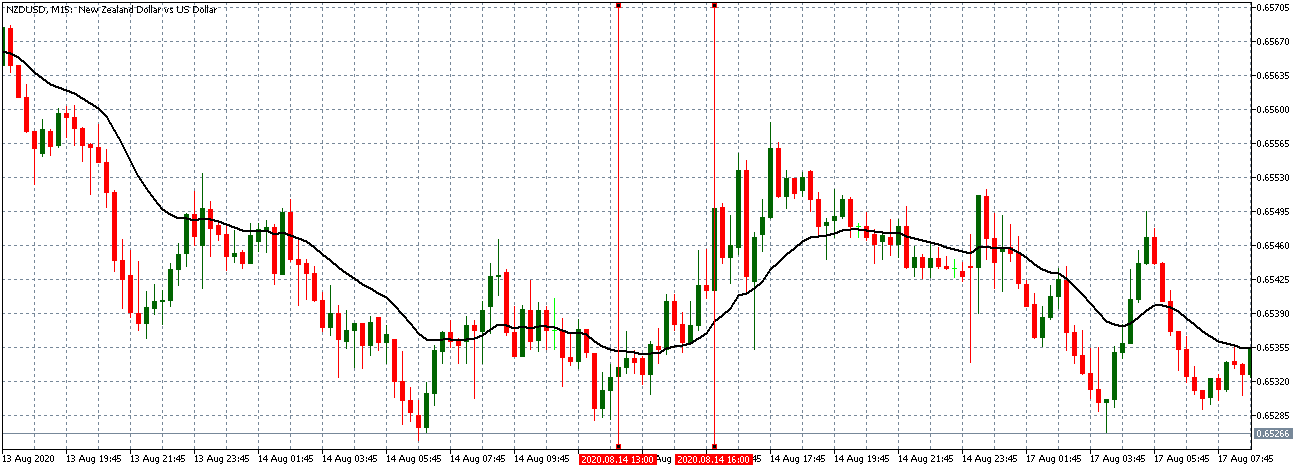
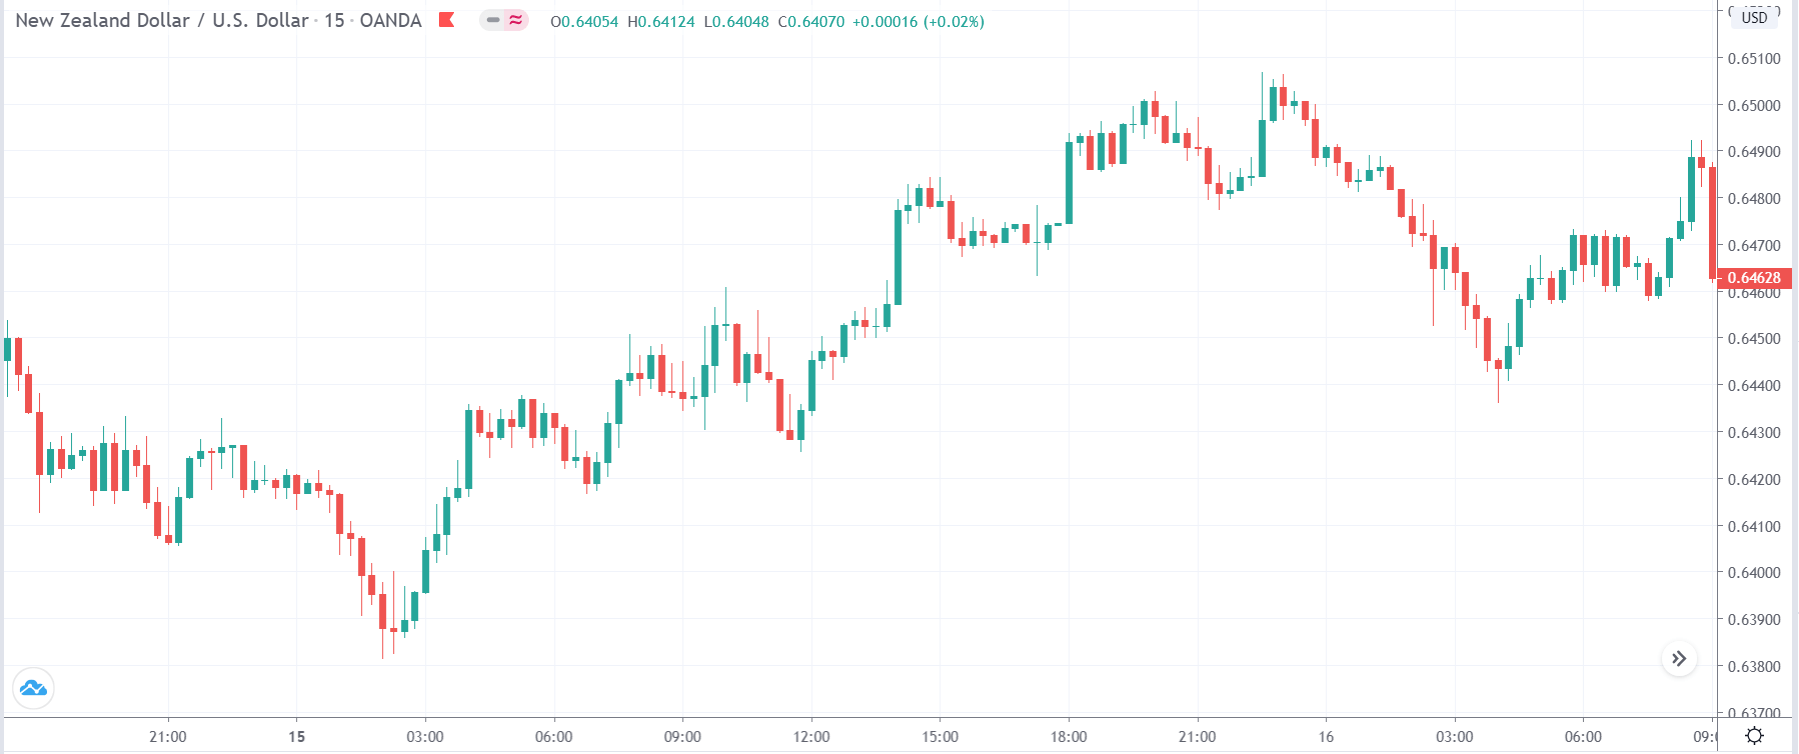
Similar to the trend observed with the EUR/USD pair, the NZD/USD was trading in an uptrend before the data release. The 20-period Moving Average can be seen to be steadily rising in the above 15-minute chart.

NZD/USD: After the Monthly Industrial Production Data Release 
on August 14, 2020, at 9.15 AM ET

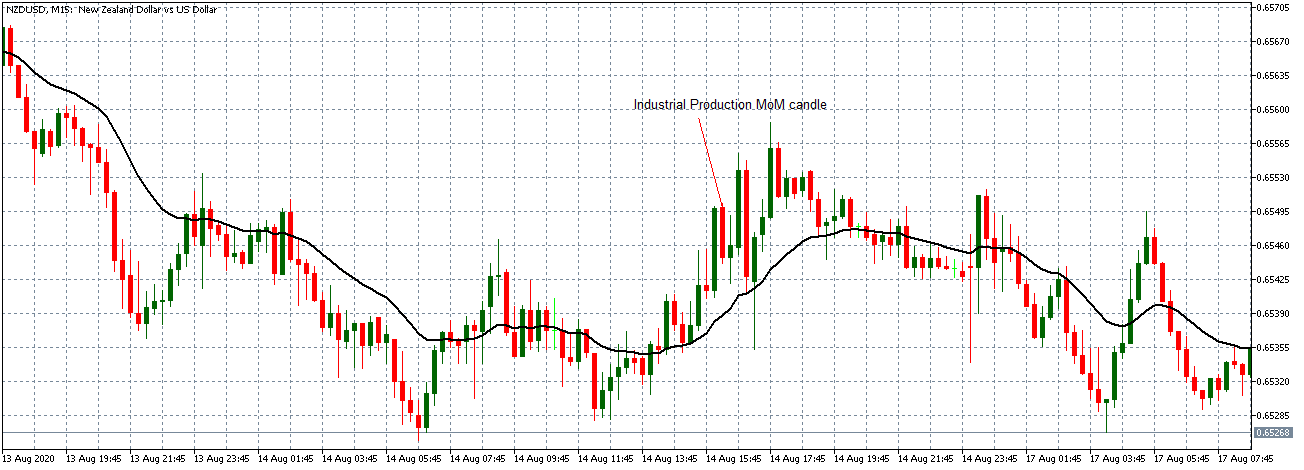
After the data release, the pair formed a 15-minute bearish candle. As observed with the EUR/USD pair, NZD/USD continued trading in the earlier observed uptrend with the 20-period Moving Average steeply rising.

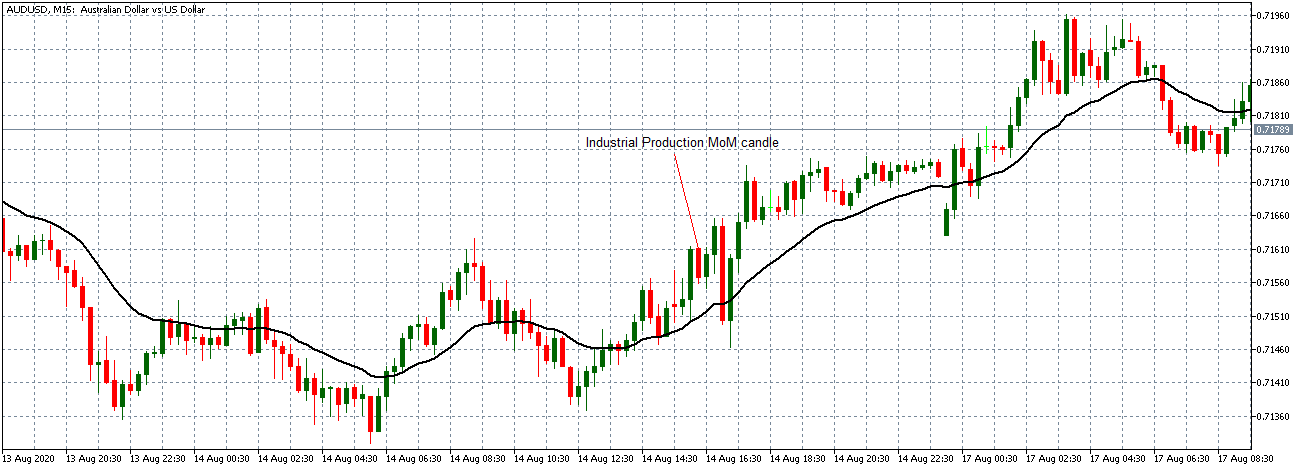
AUD/USD: Before the Monthly Industrial Production Data Release 
on August 14, 2020, Just Before 9.15 AM ET

AUD/USD: After the Monthly Industrial Production Data Release 
on August 14, 2020, at 9.15 AM ET

Before the data release, the AUD/USD pair was trading in a similar uptrend pattern as the EUR/USD and NZD/USD pairs. After the data release, the pair formed a 15-minute bearish candle and subsequently continued trading in the earlier observed uptrend similar to the other pairs.

Bottom Line

The monthly US industrial production data an important leading indicator of the economy’s health. From this analysis, however, while the data release affects the USD, it is not significant enough to cause a shift in the prevailing market trend.

Categories
Forex Daily Topic Forex Fundamental Analysis

Understanding ‘Industrial Production Index’ & Its Relative Impact On The Forex Market

What is the Industrial Production Index?

Industrial Production Index or IPI, as it is commonly called, is an index that tracks manufacturing activity in different sectors of the economy. The IPI number measures the industrial production for the period under consideration, usually a month. IPI is a key economic indicator of the manufacturing sector of the economy. It measures the real output in the mining, electric, and gas industries, relative to the base year.

How is IPI calculated? 

Industrial Production is expressed as an index relative to the base year, which is 2012. They do not express absolute production numbers or volume, but the percentage change in production relative to 2012. The parameter taken into account is often varied, including physical inputs and outputs such as tons of iron, or inflation-adjusted sales figures, and when these parameters are not available, hours logged in by production workers is considered. This data is obtained from industry associations and government agencies, and the index value figure is obtained after incorporating these numbers in the Fisher-Ideal formula.

Within the IPI index, several sub-indices provide a detailed look at the production levels of highly specific industries. One can find the monthly production data of residential gas sales, ice cream, carpet and rug mills, spring and wire products, audio and video equipment, and paper in these sub-indices. The indices are seasonally adjusted, and sometimes the format is unadjusted.

Limitations of the IPI

While GDP estimates show that the manufacturing sector has picked up, the IPI doesn’t. In such cases, the question arises, which of the two should we believe. The selection of items for measuring the production output has remained the same for many years. This will have implications on the index value. IPI growth will have a certain directional bias. The recommendation has always been to make it more dynamic. All they are saying is to revise it more frequently. But the officials have been only pushing the dates forward.

Another limitation is in the selection of the base year. The 2011-2012 base year series shows faster growth than the previous one, 2004-2005 base year. Therefore, it is suggested to use the old methodology alongside the new method.

Analyzing the IPI 

The IPI data is particularly useful for money managers and investors who are a part of the business. At the same time, the composite index is an important macroeconomic indicator for economists who analyze the impact of the numbers on the economy and industry. Fluctuations within the industrial sector account for variation in the overall economic growth. The monthly metric keep investors informed about the shifts in the production levels.

At the same time, IPI ignores the most popular economic output measure, the Gross Domestic Product (GDP). GDP calculates the price paid by the end-user, so it includes the value-added in the retail sector. This is ignored by IPI. Another observation is that the industrial sector is losing its share in the GDP of a country; for instance, it made up less than 20% of the GDP of the U.S. economy as of 2016.

Along with IPI, capacity utilization is another useful indicator that investors analyze to assess the demand scenario. Low capacity utilization or overcapacity, in other words, signals weak demand. Policymakers read it as a need for fiscal or monetary stimulus in the economy. Investors read it as a sign of coming downtrend for the currency and the stock market. High capacity utilization, on the other hand, acts as a warning signal that the economy is overheating, suggesting the risk of price hikes and asset bubbles. Policymakers react to such threats with interest rate hikes or fiscal austerity. There is also a possibility that this could ultimately result in a recession.

Impact on Currency

Industrial production figures are directly proportional to the value of a currency. When Industrial Production is high, it means economic activity is improving in the country that directly contributes to the GDP. A rate of GDP leads to an appreciation in the currency value. However, an effect on the overall economy is felt when industrial production is increasing each month. An improvement in the production output for one month has no impact on the currency; the average value of at least three months makes a difference. The IPI is an early indication of growth in the manufacturing sector, which is why it is closely watched by investors and traders.

Sources of information on Industrial Production Index

The Federal Reserve Board publishes the industrial production index (IPI) every month, which is released approximately in the 2nd week of the month. The revisions in the method of calculation, if any, are released at the end of every March. As it is an important indicator of growth in the manufacturing sector, most open-source economic websites keep track of their respective countries’ data.

GBP (Sterling) – https://tradingeconomics.com/united-kingdom/industrial-production

AUD – https://tradingeconomics.com/australia/industrial-production

USD – https://tradingeconomics.com/united-states/industrial-production

CAD – https://tradingeconomics.com/canada/industrial-production

EUR – https://tradingeconomics.com/european-union/industrial-production

JPY – https://tradingeconomics.com/japan/industrial-production

The Industrial Production Index (IPI) is an important economic indicator published by the Federal Reserve Board (FRB) of the United States that measures manufacturing, mining, and utilities’ real production output. The indices are computed mainly as fisher indices with more weightage on the annual estimates of value-added. The fisher methodology only preserves the growth information, which is why the value of the base year, i.e., 2012, is randomly set to 100. This index, along with other industrial output indexes and construction, accounts for the bulk of the total output variation throughout the business cycle.

Impact of the ‘Industrial Production Index’ news release on the Forex market

In the previous part of the article, we understood the significance of Industrial production fundamental indicators in an economy. Now let’s discuss the impact of the Industrial Production Index news announcement on the value of a currency and witness the change in volatility due to the news release. As discussed previously, Industrial Production measures the change in the total inflation-adjusted value of output produced by manufacturers, mines, and utilities.

For instance, Industrial Production measures the output of businesses in the industrial sector of the United States economy, where the manufacturing sector accounts for 78 percent of total production. Some of the biggest segments of this sector are Chemicals, food, drinks and tobacco, machinery, computer and electronics, motor vehicles, and others.

Now let’s analyze the Industrial Production data of the United States released in June. As we can see in the below image, Industrial Production in the United States increased to 1.4% percent in May, which was much higher than the previous month. The Industrial Production numbers in April and May are largely influenced by COVID-19. Let us find out the reaction of the market to this data.

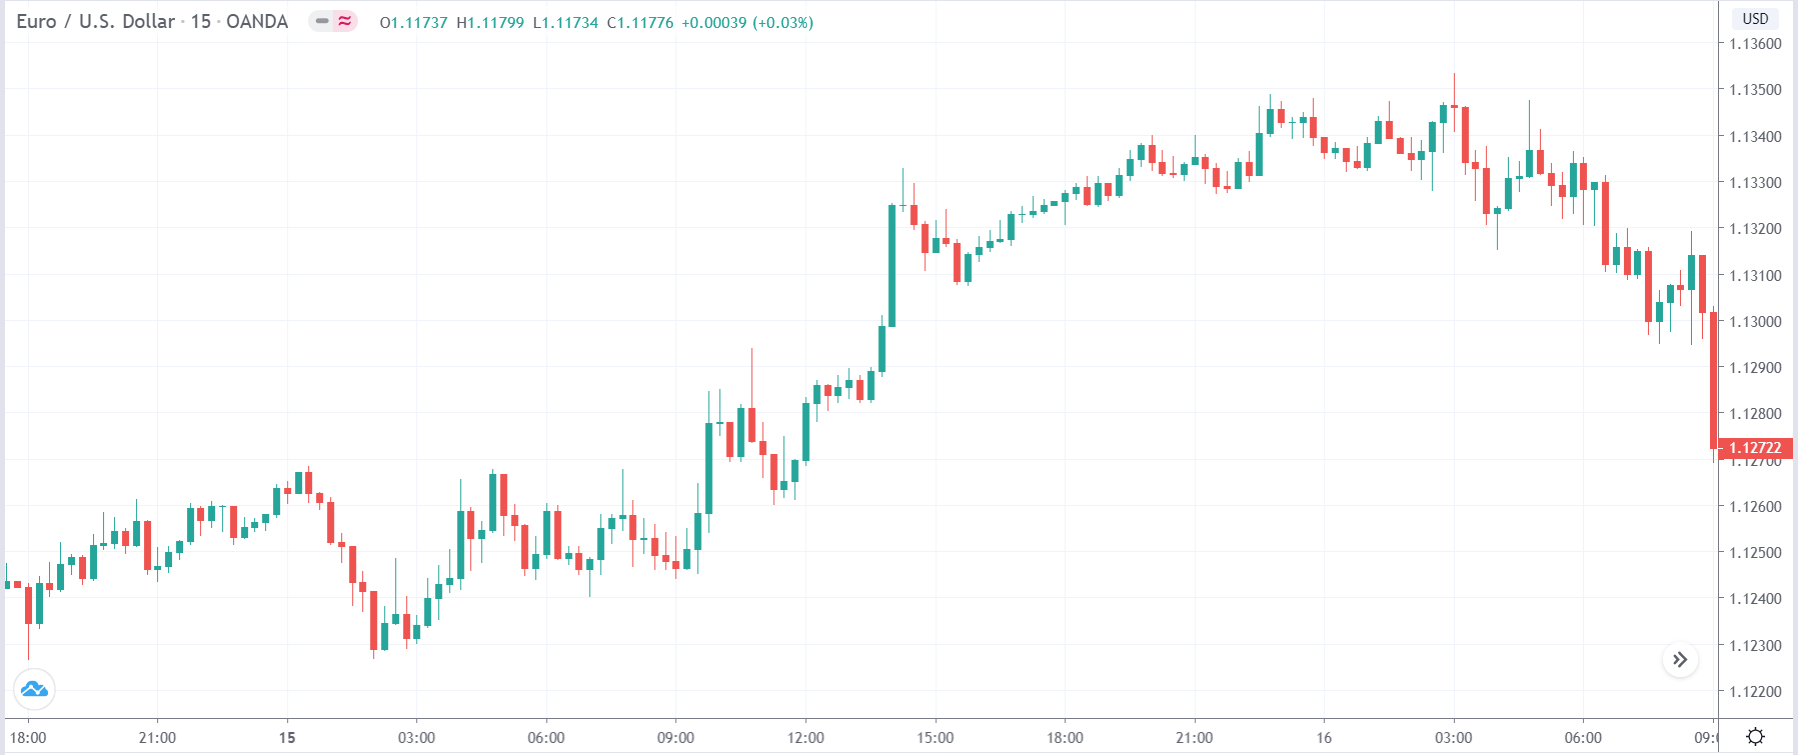
EUR/USD | Before the announcement

Let us start with the EUR/USD currency pair witness the change in volatility due to the news announcement. The above image shows the state of the chart before the news announcement, where we see that the market was in an uptrend and recently has laid out signs of reversal.

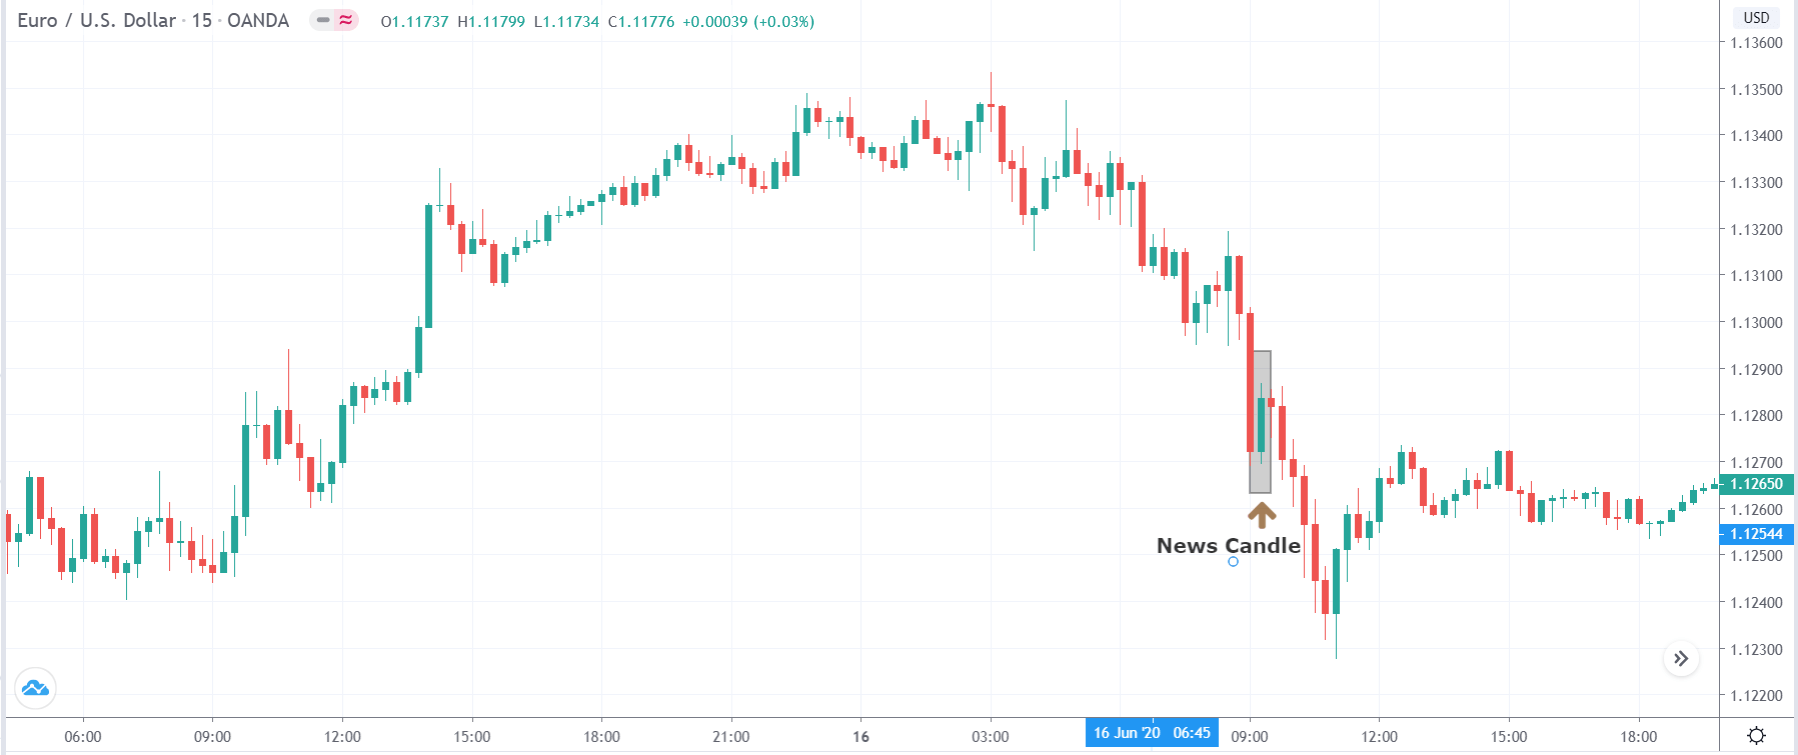
EUR/USD | After the announcement

After the news announcement, the price moves higher, and volatility slightly increases to the upside. However, the price does not go much higher, and the major trend to the downside continues. Thus, it would be right to say that the news announcement had a positive impact on the U.S. dollar.

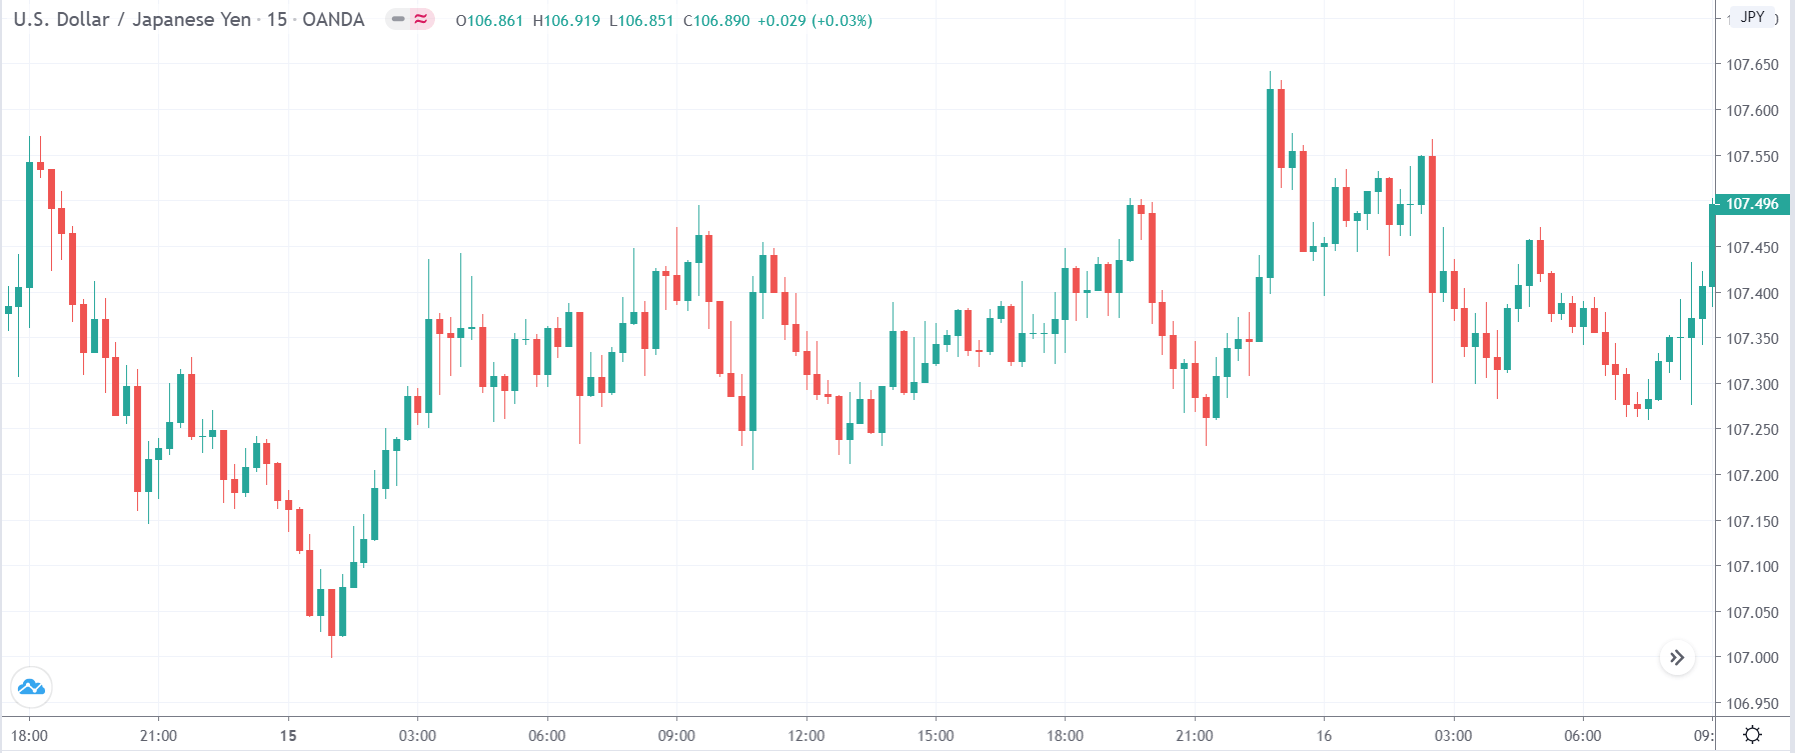
USD/JPY | Before the announcement

USD/JPY | After the announcement

The above images represent the USD/JPY currency pair, where we see that the market is moving within a ‘range’ before the news announcement. Just when the Industrial production numbers are to be released, the price is at the top of the ‘range,’ and volatility is high. Depending on the impact of the news release, we take a suitable position in the currency pair.

After the news announcement, the market moves lower by a couple of candles, as seen in the above image, and gets retraced by strong buyers who take the price above the ‘news candle.’ But since the price is again at resistance, it eventually moves lower and reaches the support. By this price action, we can say that the currency pair becomes highly volatile after the news announcement.

NZD/USD | Before the news announcement

NZD/USD | After the news announcement

The above price charts belong to NZD/USD currency pair, where we see that before the news announcement, the price was moving higher, and now it has displayed a strong reversal pattern in the market, indicating a reversal to the downside. If the news release does not change the underlying price action pattern, one can take a risk-free ‘short’ position in the currency pair. This is how technical analysis is used in conjunction with fundamental analysis.

After the news announcement, the price moves higher by a little, and ultimately the reversal pattern dominates the market, and price makes a ‘lower low.’ Therefore, the slight bullishness that was witnessed due to the news announcement was of significance, and the market crashed.

We hope you got the gist on what the ‘Industrial Production Index’ is and its impact on the Forex price charts after its news release. In case of any questions, let us know in the comments section below. Cheers!