Categories
Forex Signals

GBPNZD Breakout Retest SELL

Flow Assessment

  • The strong buy swing on the daily has failed to achieve anything and has been halted by sellers building up positions and beginning the downward move, thus giving us a sell swing bias

Location Assessment

  • Price has recently broken out of a daily buildup range (around the aqua line in the picture) and the next set of buy liquidity is likely to be at the origin of the daily buy swing upwards emerging from 1.91530

Momentum Assessment

  • As the breakout below the aqua line looked strong on the H1, the sell entry is based on a breakout retest idea of that level
Categories
Forex Market Analysis

Profiting from GBPNZD Weakness

Overview

The GBPNZD cross extends its losses. The pair’s sentiment is currently controlled by the bears. The Elliott Wave sequence suggests the possibility of a new decline, which could accelerate its price toward the long-term ascending trendline.

Market Sentiment

The GBPNZD cross declined 0.47% in the Wednesday trading session, propelled by the US presidential election’s tight results. In this context, the 12-hour chart illustrates the market sentiment, displaying the 90-day high and low range.

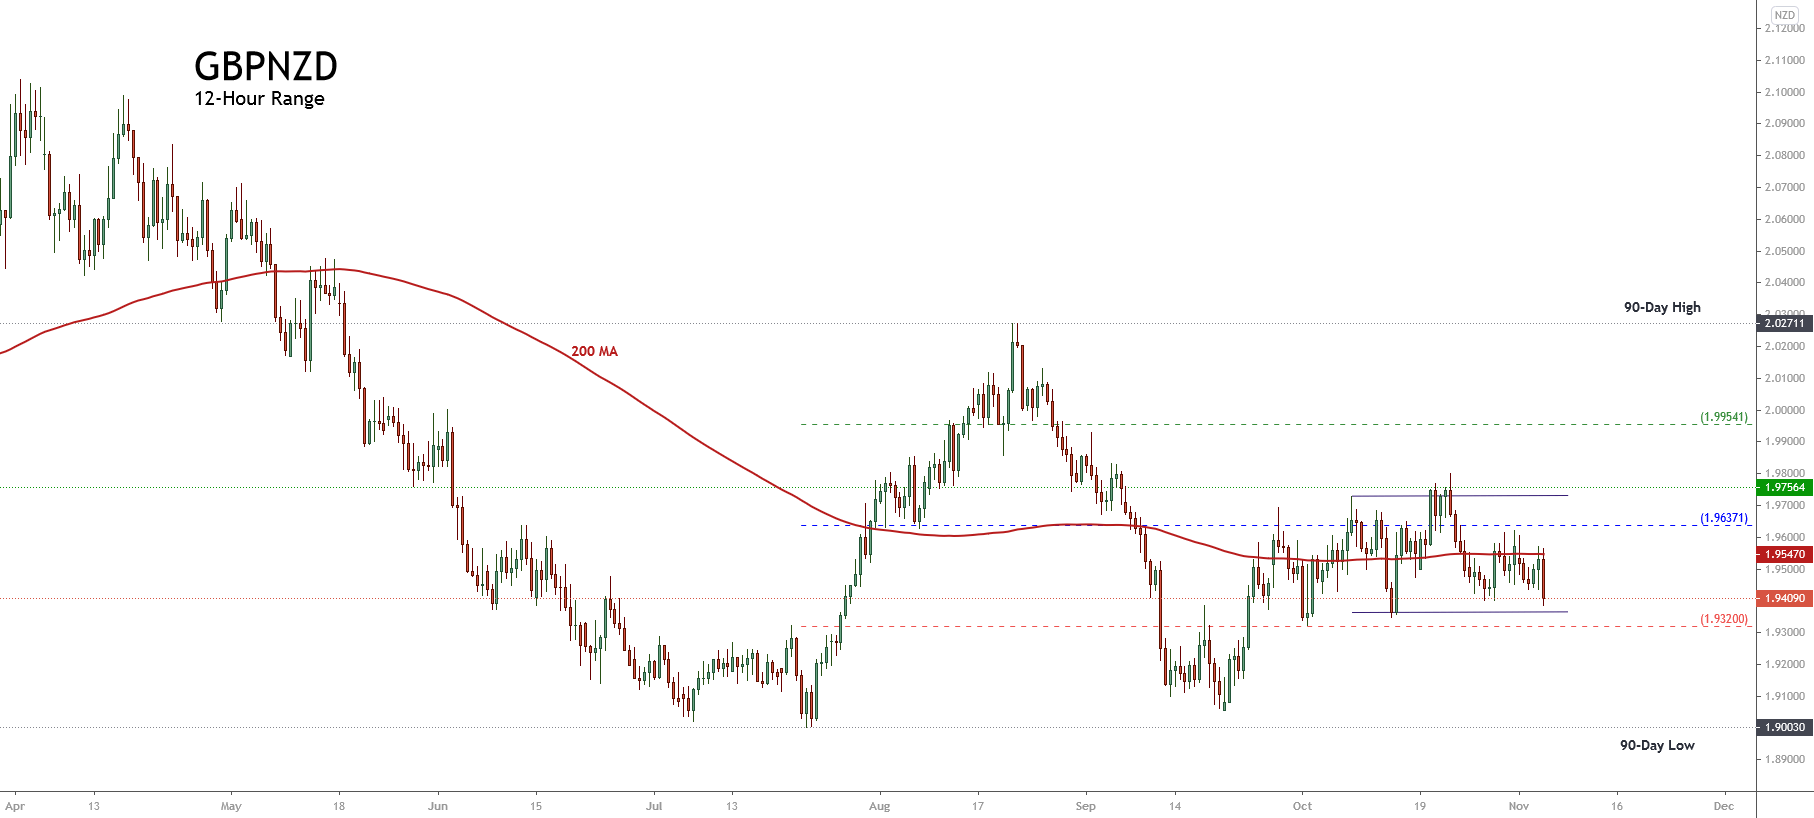
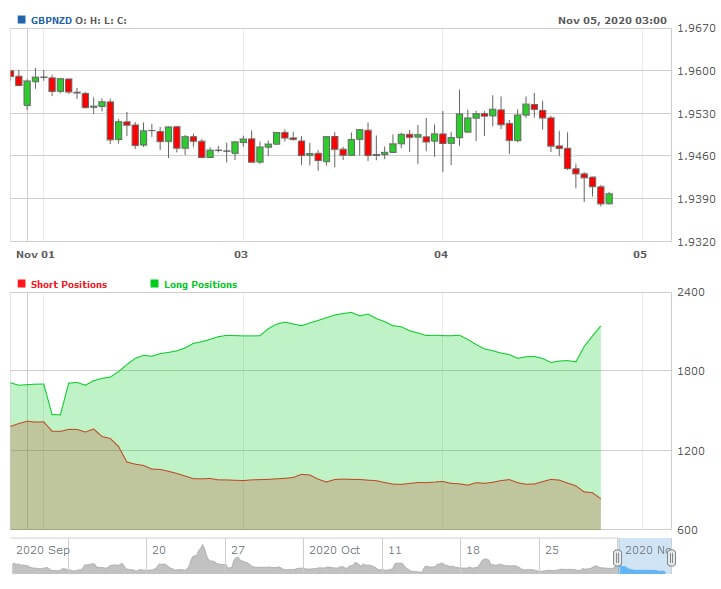
We observe in the previous chart that GBPNZD moves mostly sideways and consolidating in the bearish sentiment zone. Simultaneously, the price action moving below the 200 moving average is a confirmation that the short-term bias is to the downside Furthermore, the current session’s range and long body candle reveal the bearish pressure dominating the market sentiment. Finally, the following chart’s lower graph shows the retail traders’ activity positioning, which moves to 74% on the long side. This contrarian indicator confirms the bearish bias of big market participants.

In summary, as long as the GBPNZD price doesn’t unveil bullish reversal signals or surpasses the 1.96371 level, the market sentiment will remain on the bearish side.

Technical Big Picture

The long-term outlook of the GBPNZD cross under the Elliott Wave perspective unveils its advance in a corrective structure, which began in late August 2015 when the price topped at 2.53193 and declined in a three-wave internal sequence. This downward sequence ended in early November 2016, when the price found support at 1.67055.

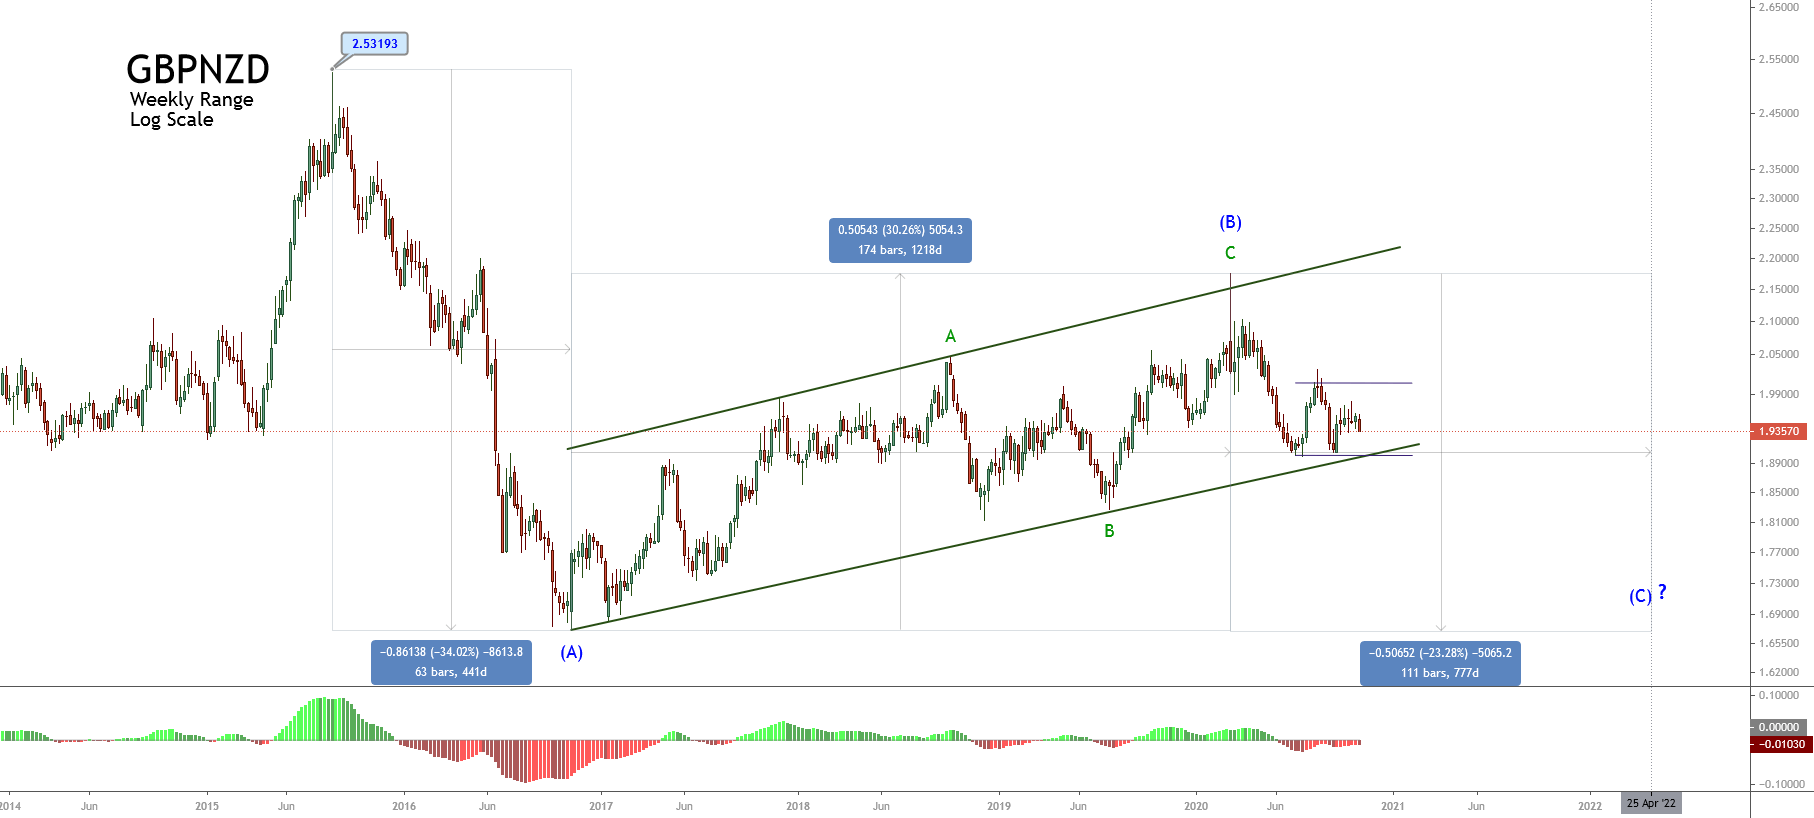
Once the cross found fresh buyers, the price started to advance in an ascending corrective sequence identified as wave (B) of Intermediate degree, which ended in the first part of March 2020 when the GBPNZD climbed until 2.17598.

In terms of the Elliott wave theory, considering that the structural series in progress completed two segments subdivided into three internal waves, the sequence could correspond to a flat pattern, a triangle, or a double three formation.

Nevertheless, although the three potential structures have different implications, the pressure remains on the bearish side.

Short-term Technical Analysis Outlook

The GBPNZD cross in its 4-hour chart unveils the incomplete downward structure that began on August 20th at 2.02711. This bearish short-term sequence of Minuette degree identified in blue could correspond to a wave (iii) or (c).

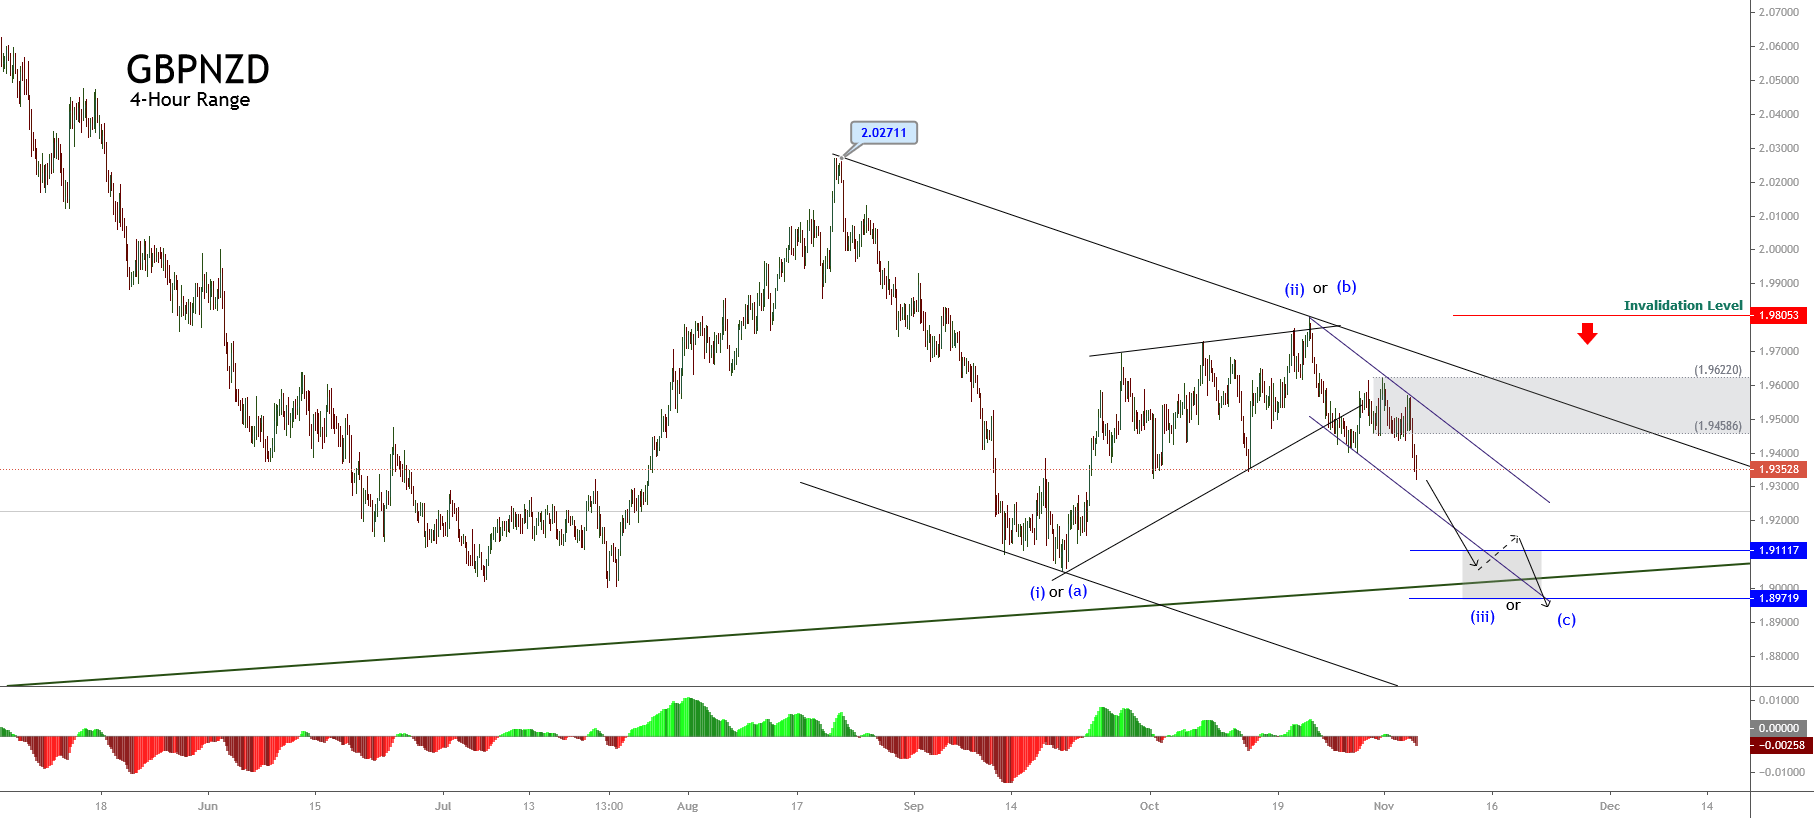
In both cases, an upward retracement toward the psychological 1.94 barrier could serve as an entry to the bearish side. Likewise, the third segment, in development, could extend its drops to the area between 1.91117 and 1.89719, which coincides with the long-term ascending channel.

In this regard, long-term traders could wait for this decline where the price could re-test the long-term trendline to add to their long positions.

Finally, the invalidation level for this bearish scenario stays at 1.98053, which coincides with the end of wave (ii) or (b) identified in blue.


Categories
Forex Signals

GBPNZD Breakout Anticipation Buy

Flow Assessment

Price is in a range, but it got to this range from an up-flow

Location Assessment

Price is near the buy-side of the range

Momentum Assessment

Buyers have built up positions and there has been an SL hunt, so the buys are ready

Entry Price – Buy 1.95324

Stop Loss – 1.95096

Take Profit – 1.95665

Risk to Reward – 1:1.46

Profit & Loss Per Standard Lot = -$154.4/ +$225.6

Profit & Loss Per Micro Lot = -$15.44/ +$22.56

Fellas, now you can check out forex trading signals via Forex Academy mobile app. Follow the links below.

iPhone Users: https://apps.apple.com/es/app/fasignals/id1521281368

Andriod Users: https://play.google.com/store/apps/details?id=academy.forex.thesignal&hl=en_USF

Categories
Forex Signals

GBPNZD Swing Failure Sell

Categories
Forex Market Analysis

GBPNZD Breakout Retest Sell

Categories
Forex Signals

GBPNZD Swing Failure Sell

Flow Assessment

  • In the range shown in the picture, the overall flow is leaning down because sellers have broken a recent low and the buyers are coming back up in a slower fashion

Location Assessment

  • Price is right at the key seller area where the origin of the push that created a new low happened, thus giving us the right to look for sells when the buys fail

Momentum Assessment

  • We do not trade on the 1st seller reaction as the buyers may defend the nearest support strongly and continue making higher highs in their journey
  • When there were lower timeframe signs of rejection for the sellers, we got an indication that sellers may be acting around that area, thus creating an entry trigger.

Note: This is an aggressive entry, 25% of your usual position’s risk can be used. Later, we can add remaining size to the trade once we get more signs that the sells are going to work.

Entry Price – Sell 1.95521

Stop Loss – 1.96001

Take Profit – 1.94171

Risk to Reward – 1:2.81

Profit & Loss Per Standard Lot = -$319/ +$899

Profit & Loss Per Micro Lot = -$31.9/ +$89.9

Fellas, now you can check out forex trading signals via Forex Academy mobile app. Follow the links below.

iPhone Users: https://apps.apple.com/es/app/fasignals/id1521281368

Andriod Users: https://play.google.com/store/apps/details?id=academy.forex.thesignal&hl=en_US

Categories
Forex Signals

GBPNZD Breakout Retest Sell

Flow Assessment

  • The bigger flow is towards buyers in the daily, but price is reacting of a historical seller’s area on H4

Location Assessment

  • The buyers on M15 have reached the historical H4 seller’s area and are showing reactions
  • This suggests that a fresher buy price may be needed to resume the daily flow, which explains the TP placement

Momentum Assessment

  • The M15 buyers look strong, but they are unable to clear the H4 seller area. Price showed some signs of rejections, giving the entry trigger

Entry Price – Sell 1.94995

Stop Loss – 1.95755

Take Profit – 1.94145

Risk to Reward – 1:1.12

Profit & Loss Per Standard Lot = -$504/ +$564

Profit & Loss Per Micro Lot = -$50.4/ +$56.4

Fellas, now you can check out forex trading signals via Forex Academy mobile app. Follow the links below.

iPhone Users: https://apps.apple.com/es/app/fasignals/id1521281368

Andriod Users: https://play.google.com/store/apps/details?id=academy.forex.thesignal&hl=en_US

Categories
Forex Signals

GBPNZD Looking for Upward Incorporations

Description

The GBPNZD cross, in its hourly chart, shows the advance in a wave B of Minor degree labeled in green. From the upward sequence, we observe that the bullish corresponding to wave ((c)) of Minute degree identified in black, remains in progress.

The current non-directional movement suggests the possibility of a new limited retrace, which could reach the level 2.0803, from where the price could give us the opportunity of new bullish incorporation following the upward bias of wave ((c)).

A bullish position will activate if the price retraces and closes above 2.08035. Our potential target locates at 2.10615 from where the wave B could complete its three-wave structure. 

The level that invalidates our upward scenario locates at 2.07078.

Chart

Trading Plan Summary

Categories
Forex Assets

Everything You Should Know About GBP/NZD Forex Pair

Introduction

GBPNZD is the abbreviation for the Great Britain pound against the New Zealand dollar. Here, the pound is the base currency, while the New Zealand dollar is the quote currency. Though it is not a major currency, it has considerable volatility and liquidity.

Understanding GBP/NZD

The value of GBPNZD represents the value of NZD equivalent to one pound. It is quoted as 1 GBP per X NZD. For example, if the value of GBPNZD is at 1.9677, then to buy one pound, the trader has to pay 1.9677 NZ dollars for it.

GBP/NZD Specification

Spread

Spread is the medium through which brokers generate revenue. They set two different prices for buying and selling a currency pair. The difference between the prices is their profit. This difference is referred to as the spread. The prices usually vary from type of account model.

ECN: 1.2 | STP: 2.1

Fees

The fee is basically the commission on each trade a trader must pay. Typically, there is no fee on STP accounts, but a small fee on ECN accounts. The fee is usually between 6 and 10 pips.

Slippage

Slippage takes place when positions are opened/closed using market orders. The trader wishes to pay a specific price, but in reality, he receives a different price. And the difference between these two prices is called slippage.

Trading Range in GBP/NZD

The trading range is the depiction of the pip movement of a currency pair on different timeframes. With it, one can analyze how many dollars they can win/lose in a given timeframe. For example, if the average pip movement on the 1H timeframe is 30 pips, then you will either be in a profit of $198.6 or a loss of $198.6 in an hour. Knowing this, a trader can plan their lot sizes accordingly.

Procedure to assess Pip Ranges

  1. Add the ATR indicator to your chart
  2. Set the period to 1
  3. Add a 200-period SMA to this indicator
  4. Shrink the chart so you can assess a large time period
  5. Select your desired timeframe
  6. Measure the floor level and set this value as the min
  7. Measure the level of the 200-period SMA and set this as the average
  8. Measure the peak levels and set this as Max.

GBP/NZD Cost as a Percent of the Trading Range

Having knowledge of the cost of the trade is necessary. Note that the cost varies based on the volatility and the timeframe traded. So, it becomes vital to know when the right moments to enter the market are. Below are two tables illustrating the total costs as a percentage for varying timeframes and volatility.

ECN Model Account

Spread = 1.2 | Slippage = 2 |Trading fee = 1

Total cost = Slippage + Spread + Trading Fee = 2 + 1.2 + 1 = 4.2

STP Model Account

Spread = 2.1 | Slippage = 2 | Trading fee = 0

Total cost = Slippage + Spread + Trading Fee = 2 + 2.1 + 0 = 4.1

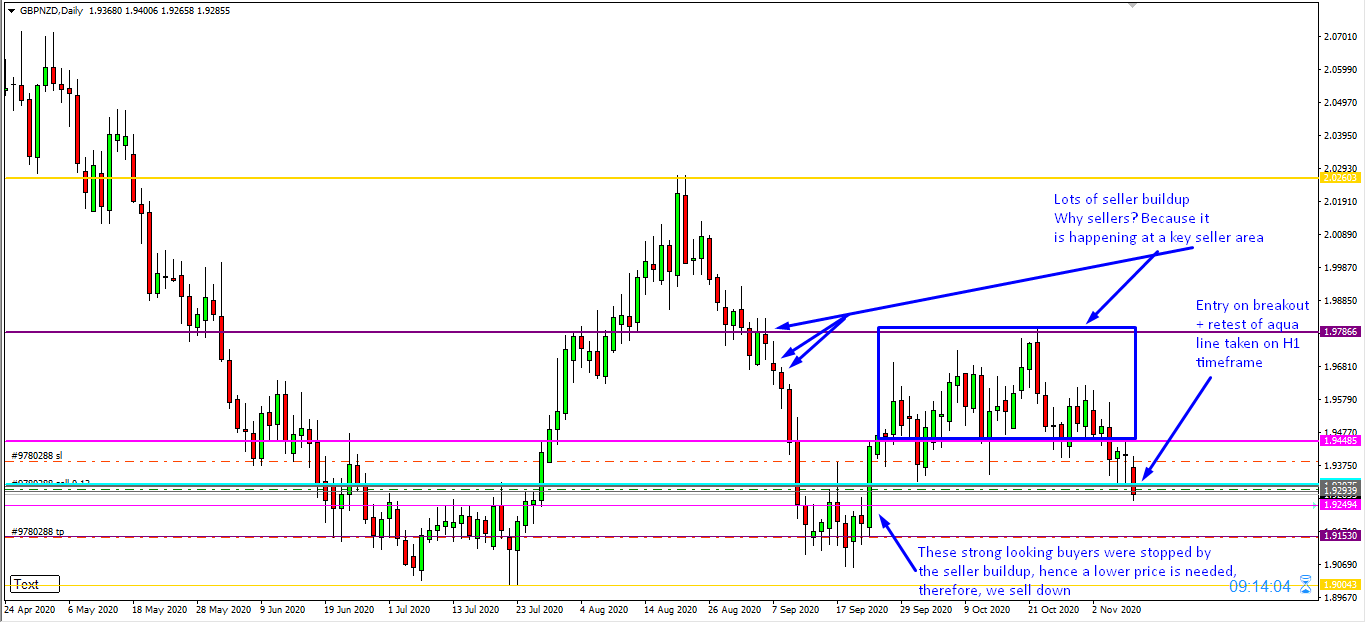
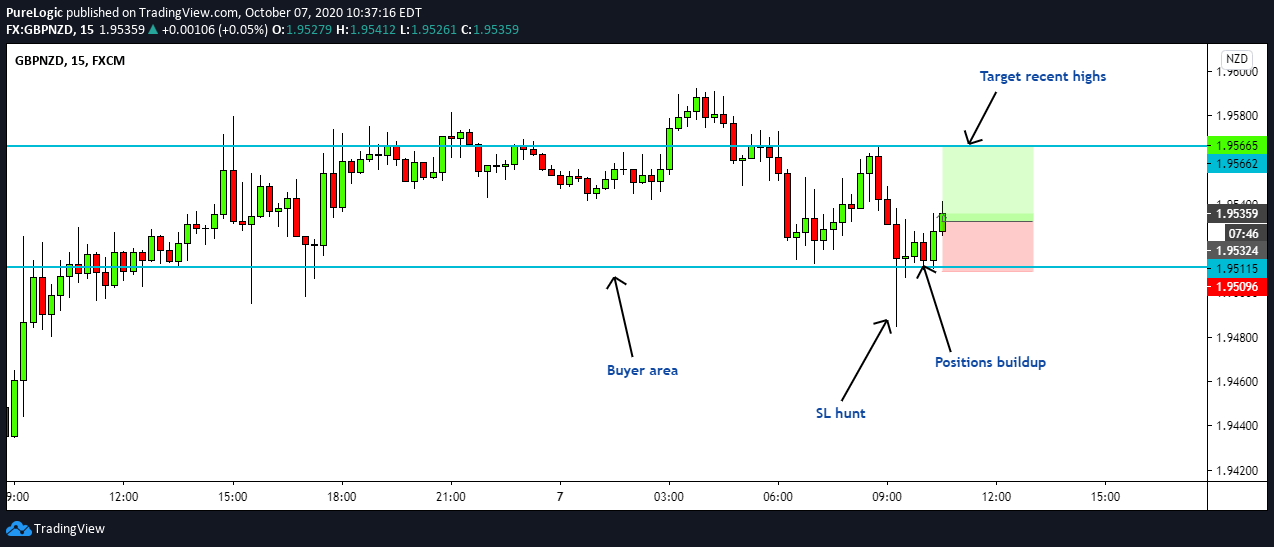
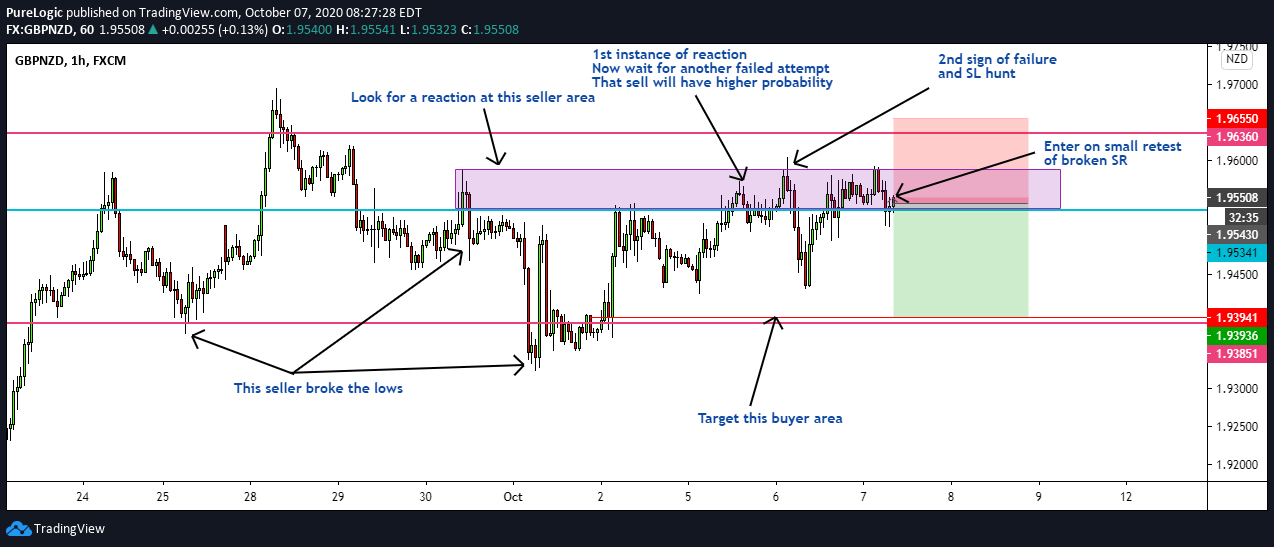
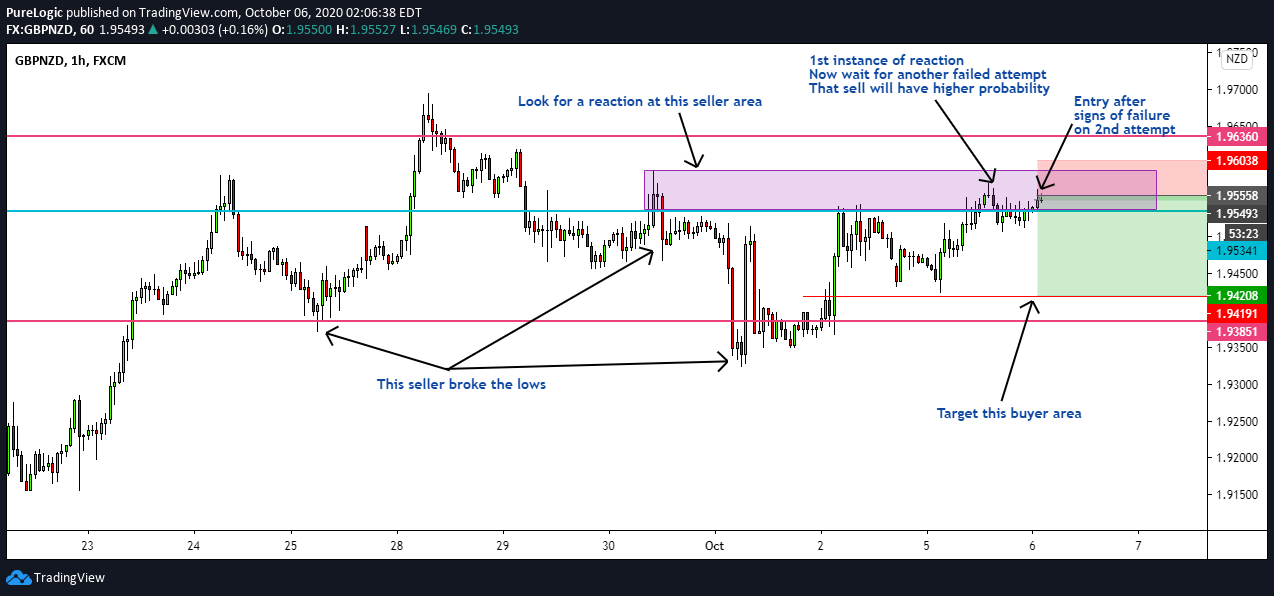
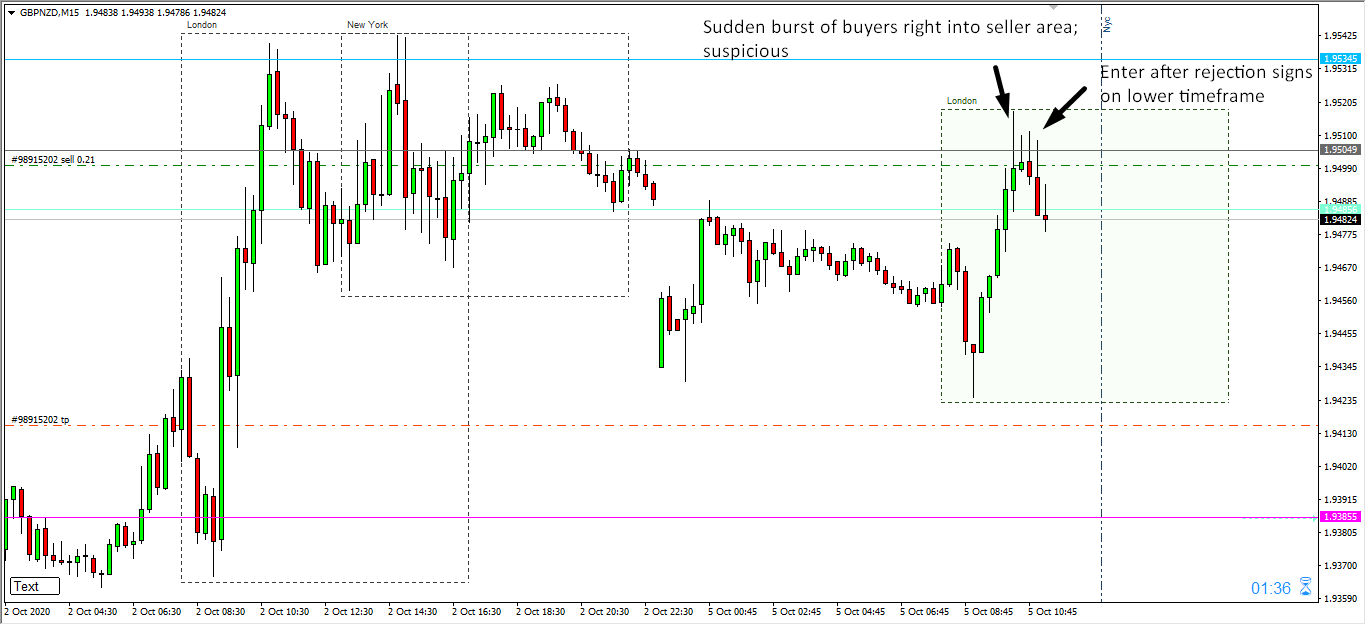
The Ideal way to trade the GBP/NZD

The above tables show that the costs are high in the min column and low in the max column. The higher the value of the percentage, the high is the cost. So, this means that the costs are high for low volatility markets and vice versa. It is neither ideal to trade during low volatility nor during high volatility. To have an equilibrium between the costs and the volatility, it is best to enter the market when the volatility is around the average mark.

Slippage is a parameter for calculating the total cost. It has a great weight in the total cost. However, there is a way to minimize and nullify it. This can be simply be done by trading using limit orders instead of market orders.

Categories
Forex Market Analysis

Forex and Indices – Daily Update 02.08.18


Fundamental Overview


In today’s session, market sentiment is led by the preference of risk protection assets facing the expectation for the US employment data, which will be announced on the Friday 03rd session. The US Dollar and Japanese Yen, which advanced 0.30% and 0.30% respectively. Within the commodity currencies group, the oceanic currencies are the hardest hit; the New Zealand Dollar is the worst performer which falls 0.49%, followed by the Australian dollar that drops 0.45% in the trading session.

Source: Forex Academy Collection


Technical Analysis


EURUSD

EURUSD in the 1-hour chart is moving bearish, below the weekly pivot level. For short positions, the price should break under the 1.1657 level with a profit target in the confluence zone between the first weekly support and the Lower HHL at 1.16061 level. For long positions (reversal case), the price should break above the breakdown candle at 1.1691, with a profit target between the confluence zone between the first weekly resistance and the Upper HHL at 1.1729.


GBPUSD

The pair GBPUSD is moving slightly bearish below the weekly pivot consolidating between 1.3090 and 1.3140. A breakdown below 1.309 could drive to the pound to the first weekly support at 1.3050. The bullish case, if the price breaks above 1.3140, the potential target is the first weekly resistance located at 1.3189.


USDCHF

USDCHF in the hourly chart is consolidating as a triangle pattern; this chart pattern suggests more upsides. For long positions, is essential that the price breaks above the weekly pivot level at 0.9937, with a profit target at the third daily resistance at 0.9974. Short positions should be valued if the price breaks under 0.9917, the potential target is the HHL at 0.9880.


EURGBP

The EURGBP cross is running bearish and is consolidating as a flag pattern. For bearish continuation, the price could drop to the confluence zone between the second daily support and the first weekly support at 0.8860. For long positions, the price should break above the weekly pivot level at 0.8897 with a potential move to the HHL at 0.8928.


GBPNZD

The GBPNZD cross is running sideways with a bullish bias in the last sequence which started from the first weekly support at 1.76318. For long positions, the price should break above the first daily resistance with a mid-term target placed on the confluence between the second weekly resistance and the third daily resistance at 1.7864. Short positions should be valued if the price closes below the daily pivot level at 1.77059, and the potential target is at the first weekly support at 1.76318.


DAX 30

DAX 30 is moving slightly neutral in the weekly pivot level at 12,746 pts. For short positions, the price should break below 12,707 with a potential target in the first weekly support at 12,604 pts. Long positions should be regarded if the German index closes above 12,800 pts, with a potential profit target at 12,920 pts.


FTSE 100

The FTSE 100 index shows bearish signals closing below the weekly pivot level at 7,687.9 pts. Continuation of the previous bearish move should be valued if the price breaks under the first weekly pivot at 7,635.2 pts., with a profit target in the confluence zone between the HHL and the third weekly support at 7,521 pts. Long positions could be valued if the price breaks above the weekly pivot level, with a potential target in the first weekly resistance at 7,754 pts. Additionally, note that if the price plunges to the third weekly support, it could be an interesting reversal level.


Categories
Forex Market Analysis

Forex and Indices Daily Update – 16.07.18


Forex Fundamental Analysis


New Zealand CPI (YoY) increase 1.5 per cent in June.

The yearly inflation change in New Zealand increased by 1.5 per cent, below the 1.6 per cent foreseen by analysts and advance from the 1.1 per cent reported in April. Housing and household utilities advanced 3.1 per cent, followed by rentals which were up 2.5. The climb in oil prices, almost 10 per cent, boosted the transport sector to increase the CPI (YoY) 2.0 per cent.


source: tradingeconomics.com


 Technical Market Analysis


EURUSD

In the last session, EURUSD surpassed the Short-term Pivot Level at 1.1690. Now we expect a consolidation structure as a flag pattern before it continues increasing the bullish momentum to the target area at 1.19067. Invalidation level is 1.15080.


GBPUSD

The GBPUSD pair is still moving sideways in the 2-hour chart, testing the Short-term Pivot Level at 1.3275. The breakout of this level should activate the bullish continuation with a target placed in the 1.3475 zone. Invalidation level of the new bullish cycle is 1.30494.


USDCHF

The bearish move after the bull trap looks like a first bearish impulse. From now we should expect a retrace in three waves, probably to the 1.0009 area before it continues with another decline. In the long term, the USDCHF is bullish, in consequence, we will maintain neutral for this pair expecting opportunities to go long with the main trend.


EURNZD

The EURNZD cross in the 2-hour chart has broken down the ascending short-term trendline at 1.7248 with a bearish high momentum candle. We expect more drops with a target placed at the psychological level of 1.70. Invalidation level is at 1.73782.


GBPNZD

The GBPNZD cross in the 2-hour chart has broken down the ascending trendline as the same way that the EURNZD has. This suggests that we should see more strength in the NZD group against the other currencies. The first target is at 1.92393 from where we could see an exhaustion of the bearish cycle. Invalidation level is at 1.95802.


FTSE 100

The FTSE 100 in the 2-hour chart continues to consolidate, developing a complex corrective structure. In terms of the traditional Technical Analysis, the structure could be a Diamond Pattern, if this is correct, we should see declines to the 7,400 area, if the falls extend, the next bearish target area could be 7,100 pts zone. We prefer to maintain neutral expecting for long positions.


DAX 30

DAX 30 in the 2-hour chart still is moving below the 12,600 pivot level. We can consider two scenarios: the first one is after the 12,600 level breakout to expect more climbs to the area between 12,695 to 12,742. The second one is if the price breaks down, the bearish target could be 12,040 pts. In the same way that in the FTSE, our position changes from bullish to neutral expecting long positions.


Categories
Forex Market Analysis

Good News Expected for RBNZ Decision – Forex and Indices – Daily Update – 27.06.18


Fundamental Overview


Good News Expected for RBNZ Interest Rate Decision.

During the overnight session, Stats NZ released the Trade Balance data from New Zealand, which shows an improvement in the commercial situation in June. Exports of meat grew by 17% reaching $817M. While the meat exported increased by 12 per cent reported Stats NZ, the destination of the main export was China, which rose by 27 per cent reaching $1.2B in June. The European Union exports also increased rising by 17 per cent ($664M).

On the other hand, vehicles, parts, and accessories led imports by 25 per cent, climbing to $924M. Whereas, Oil imports were reduced by 30 per cent, falling to $455M in May.

rbnz interest rate decision

Source: Forex.Academy Collection.


Technical Analysis


EURUSD

EURUSD is making the retracement of the first impulsive move testing the blue box from where the euro could start the continuation of the previous movement. RSI is testing support above the 40 level, which makes us suspect that the EURUSD pair could be testing support. Our mid-term vision is that the common currency could beat 1.1853, even reaching the target placed at 1.19467. Invalidation level is at 1.1508.


GBPUSD

The GBPUSD pair is still consolidating the previous impulsive move in the descending long-term trendline. The price is moving in the Potential Reversal Zone (Blue Box) from where we expect the bullish reaction as a continuation of the previous movement. We foresee fresh highs with the target at 1.3443. Invalidation level is at 1.31020.


USDCHF

USDCHF is moving slightly bullish consolidating in the long-term ascending trendline. Our main vision for USDCHF is the formation of a flag pattern reaching the 0.99277 level before continuing with the previous bearish move with a target placed on the area between 0.97225 and 0.96495. Invalidation level of this scenario is at 0.99909.


EURNZD

EURNZD continued developing a bullish impulsive move. As we forecasted in a previous Daily Update (June 20th, 2018), the cross is moving near to the target area at 1.7064. Still, we foresee a more upside to the 1.7148 level. Invalidation level is 1.6572.


GBPNZD

GBPNZD still is moving in an ascending channel to the Potential Reversal Zone proposed in our Daily Update for June 20th. The price could reach the target between 1.944 and 1.958 area, from where the cross should complete a bullish cycle. Invalidation level is 1.8909.


FTSE 100

The FTSE 100 index bounced from the sell-off performed on the Monday 25th trading session; despite this bounce, we expect more dips. FTSE should reach at least the 7,468.3 level before it completes the short-term bearish cycle. From this zone, we could build a new bullish connector. If the index breaks down, the Control Level is likely to reach from the 7,182 level to 7,073 area. Watch out for the RSI which is moving sideways between the 40 and 60 level; this coincides with the consolidation pattern that still is running. Invalidation level of the bearish scenario is 7,793.5.


DAX 30

DAX 30 is testing support on the PRZ forecasted at 12,238 pts. The RSI level at 26 makes us foresee that the German index is developing a wave three. In consequence, more downsides are pending; likely DAX 30 plunge below 12,100 pts. Invalidation level of the bearish cycle is at 13,170 pts.


Categories
Forex Market Analysis

Economists Expect Lower Growth in New Zealand – Forex and Daily Update 20.06.18


Fundamental Overview


Economists expect lower growth in New Zealand.

Lower growth could reach New Zealand for the first quarter of 2018. Amongst the reasons for the lower GDP is the cooling in the housing market, as well as the low prices of dairy products.

Analysts polled expect the quarterly growth to be only 0.5%, being lower than the 0.7% of the previous quarter, this would result in an increase of 2.7% annually, compared to the 2.9% reported in the last quarter of 2017. This deceleration would force the RBNZ to maintain the interest rate at the next monetary policy decision meeting.


FOREX DAILY ANALYSIS


EURUSD

EURUSD is still testing the bottom line consolidating below 1.16 as a relevant resistance level. We expect a new lower low between 1.1520 and 1.1425. Invalidation level of the mid-term bearish cycle is 1.1852.


GBPUSD

GBPUSD is moving bearish, and still, we expect that the price complete the bearish cycle in the key support at 1.3109, creating a bullish connector. Short-term resistance level is 1.3298.


USDCHF

USDCHF still is moving bullish seeking the parity making a flag pattern. We still maintain our vision for the Swiss currency that could make a new bearish leg with a mid-term target on 0.98 level testing the bullish long-term trendline.


EURNZD

EURNZD is developing a bullish impulsive move. We foresee that the cross should to make a retrace as a flag pattern from where EURNZD could bring a new opportunity to incorporate us into the bullish trend with a profit target at least at 1.7064. Invalidation level is 1.6572.


GBPNZD

GBPNZD is running upward building an ascending channel. Our vision is that every dip is an opportunity to go long with a target between 1.944 and 1.958, from where the cross should complete a bullish cycle. Invalidation level is 1.8909.


FTSE 100

The FTSE 100 bounced and broke the bearish short-term trendline, but this move could be as a Dead Cat Bounce Pattern. The British index could complete a new bearish leg to the 7,400 area, from where FTSE should build a new bullish connector.


DAX 30

DAX 30 is moving with a bearish bias, the bounce of the current trading session could be a Dead Cat Bounce Pattern, which could drive us to see new lows below the short-term support at 12,547.6, it could even fall to the 12,300 area, from where we foresee that the German index should start a new bullish sequence.


Categories
Forex Market Analysis

Forex and Indices – Daily Update – June 05th, 2018


FOREX MARKET NEWS AND ANALYSIS

Hot Topics: 

  • U.K. PMI Services helped the Pound Group to Show Reversal Signals.
  • Main Pairs Against the US Dollar Keeps Consolidating.
  • European Indices Close Lower.

U.K. PMI Services helped the Pound Group to Show Reversal Signals.

PMI Services in May reached 54 pts, the highest level for three months. After the data release, GBPUSD raised to 1.34 level. Now we expect a corrective move before a new bullish cycle. Invalidation level remains at 1.32544.


As we expected in our last Daily Update, GBPAUD made a bullish move from the second weekly support to the weekly pivot level direction. Now after the impulsive move, we expect that the price could make a consolidation move as a flag pattern before proceeding with its previous movement.


GBPNZD is making a potential bottom structure if the breakout of the 1.91286 level activates the figure, with the profit target at 1.93377. We are surveilling the 1.9005 level as Control Level.


Main Pairs Against the US Dollar Keep Consolidating.

The common currency still is developing a consolidation structure after the impulsive move started in the previous week. RSI has found support at the 41.69 level which makes us foresee a new clue for the bullish reversal move that could be starting.


The inversely correlated currency with the Euro and Swiss Franc is also making a sideways consolidating structure. We expect more declines for this pair; our first bearish target is 0.9815, the second target is 09783 level. Invalidation level is 0.9983.


European Indices Close Lower.

The FTSE 100 broke down the ascending flag pattern in the blue box. The invalidation level remains at 7,803 pts. In the same way, the RSI has broken down its ascending flag pattern. The British index could visit the 7,500 level, or if it moves below this level, the FTSE could make a second leg down before a new bullish cycle.


DAX 30 has made the same breakdown in the ascending wedge pattern. RSI also has broken down its ascending wedge. The first bearish target is 12,528. In case that price falls below 12,386, the next bearish targets are 12,125 and 11,990.


Categories
Forex Market Analysis

Italy and the Two Children Policy Drive the Markets


Hot Topics:


  • Majors against US Dollar shows exhaustion signals.
  • European indices close the mixed trading session.
  • GBPNZD arrives at our PRZ aided by the two children policy announced in China.
  • EURAUD reaches the second bearish long-term target.

Majors against US Dollar shows exhaustion signals.

Italy is adding volatility to the Eurozone due to the agreement between Movement Five Stars, and Lega Party for the new Prime Minister.  EURUSD bounced from 1.1717 where the price created a bullish divergence. In today’s session, RSI broke its bearish trendline upward, but to complete the start of a new cycle, it is necessary that the price action confirms the new sequence. Invalidation level for this latest move is 1.17.


The GBPUSD fell to the Potential Reversal Zone as we expected last week. Currently, the price is moving narrowly, but we anticipate that the price would make a new lower low as a false breakdown. We still maintain the bearish bias while the RSI does not break above the invalidation level at 1.36.


The USDCHF pair leads the move against the US Dollar, the price made a throwback to parity and had been rejected downward. Our projection for the Swiss currency is that the price could reach 0.99203 as first support, second support is 0.98097. Invalidation level is at 1.00561.


European indices close the mixed trading session.

The FTSE 100 soars to the highest level reaching 7,868.1 in the last trading hour. The market could be placing its eyes on the 8,000 points as the psychological resistance to be struck during the next days. The new invalidation level is placed at 7,753.3 pts.


On the opposite side, the DAX 30 closed the trading session bearish, consolidating the ascending wedge pattern above the last price congestion zone. The increasing risk of Italy’s exit from the Eurozone is knocking the European markets. On the other hand, the BUBA’s chief Jens Weidman has announced that he is open to succeed Mario Draghi as president of the European Central Bank. The new invalidation level is moved up at 12,918.3 pts.


GBPNZD arrives at our PRZ aided by the two children policy announced in China.

GBPNZD continues moving downward as forecast in the past week, aided by the “two children” policy announced in China. The announcement is raising the confidence of the New Zealand dairy producers. After this bearish accelerated move, we expect a pause in the downtrend. Invalidation level is at 1.96636.


EURAUD reaches the second bearish long-term target.

EURAUD continues moving downward in the second long-term target at 1.5548. RSI shows signals of the climatic move; this means that the price acceleration in this bearish move is close to initiating a consolidation process. Invalidation level is at 1.5727.


Categories
Forex Market Analysis

Forex and Indices – Daily Update – EURAUD Potential 2B Pattern


Hot Topics:


  • Indices consolidate at their highs in the last trading session of the week.
  • Swiss Franc shows the first reversal signals, Pound and Euro still consolidate.
  • GBPNZD – The bearish momentum remains.
  • EURAUD – Develops a potential Bullish 2B pattern.

Indices consolidate at their highs in the last trading session of the week.

After having reached the highest level since January, the FTSE 100 price is rejecting the resistance level retracing to the bullish trend-line. Oscillators show bearish divergences, warning about the trend exhaustion. The leading RSI indicator still keeps the bullish bias for the current trend. We keep our eyes on the 8,000 points mark as a psychological resistance. Invalidation level is at 7,486 pts.

Forex signal live


The DAX 30 continues with its bullish momentum and now consolidates the breakout above the latest sideways structure (13,034 pts). The RSI oscillator still shows that the trend is upward. The pending bullish target is at 13,250 points. Invalidation level of the bullish cycle still rests at 12,665 points.


Swiss Franc shows the first reversal signals, Pound and Euro still consolidate.

The EURUSD continues consolidating in a Potential Reversal Zone. On the other hand, RSI is showing bullish divergence as an indication of exhaustion of downward movement. However, as long as the price does not break above the trend-line and move above 1.1810, we maintain the bearish bias. The invalidation level of the bearish cycle is at 1.1996.

Forex signal live


GBPUSD, the price continues moving in the sideways range and showing its intention to break down towards our Potential Reversal Zone. The RSI oscillator shows the bearish momentum continues. Invalidation level 1.3617.


After moving sideways for nine days, USDCHF is breaking down the consolidation range. We expect the Swiss Currency to reach the 0.9920 level, in agreement with its bearish divergence. RSI also shows bearish signals supporting the corrective scenario.


GBPNZD – The bearish momentum remains. The GBPNZD cross continues developing the bearish movement towards the long-term bullish trend-line. As was observed in our May 16th Daily Report (read more), the next target level for the current bearish move is 1.9388; the invalidation level is 1.9663.


EURAUD – Developing a potential Bullish 2B pattern.

We see a potential Bullish 2B Pattern on the EURAUD, which could be activated as long as the price breaks out of 1.5721 level, with a target at 1.5888. The price is moving at the bottom of the long-term upward trend-line. The invalidation level of this bullish scenario is 1.5654.

Forex signal live


Categories
Forex Market Analysis

Forex and Indices Daily Update – May 16th, 2018

Hot Topics:

  • Currencies against the Dollar could be completing internal cycles.
  • EURAUD – Closing partials and moving SL.
  • GBPNZD – More falls are expected.
  • Indices continue consolidating.

Currencies against the Dollar could be completing internal cycles.

Forex and Indices Market Update: EURUSD continues to move below 1.18 and bouncing within the potential reversal zone. However, it still shows no signs of changing the trend. It should be noted that the Dollar Index has completed an internal cycle which should begin to correct soon. For the pair, we maintain a neutral position.


In the same way, GBPUSD continues to move within a sideway range towards the zone of a potential reversal from where we expect it to begin to bounce.


Without significant changes, the Swiss Franc (USDCHF) continues moving sideways around the parity level; the current movement makes us speculate that there could be a limited upward move as a false breakout.


EURAUD – Closing partials and moving SL.

Forex and Indices Market Update: The EURAUD cross has reached the first level of the potential reversal zone at 1.57236, fulfilling the conditions of the completion of an internal cycle. Additionally, EURAUD has touched the long-term uptrend line and would be forming a bearish channel structure. The bearish bias persists, and the price could reach 1.5610. We still maintain our short positions and move the invalidation level to 1.5888. Now is time to make partial closes in open trades.


GBPNZD – More falls are expected.

Forex and Indices Market Update: The GBPNZD cross is moving within a consolidation structure with a bullish bias. Our outlook is that the price could make a new low in areas from 1.9388 to 1.93049, this area coincides with the long-term trend line. In case of breaking below 1.93, we could see more falls with a target at 1.905 level.


Indices continue consolidating.

Forex and Indices Market Update: The German DAX 30 index continues moving in a range between 12,918 and 13,034 points. We expect a new upward movement to complete the ascending wedge structure that could be in the form of a false breakout. The AO oscillator is showing a bearish divergence, which indicates a price exhaustion signal which could support our bullish target forecasted at 13,250 points.


The FTSE 100 shows the same situation; the British index is also consolidating in the upper part of the ascending wedge. For the moment we remain neutral in indices expecting a new trading opportunity.