Overview
The GBPNZD cross extends its losses. The pair’s sentiment is currently controlled by the bears. The Elliott Wave sequence suggests the possibility of a new decline, which could accelerate its price toward the long-term ascending trendline.
Market Sentiment
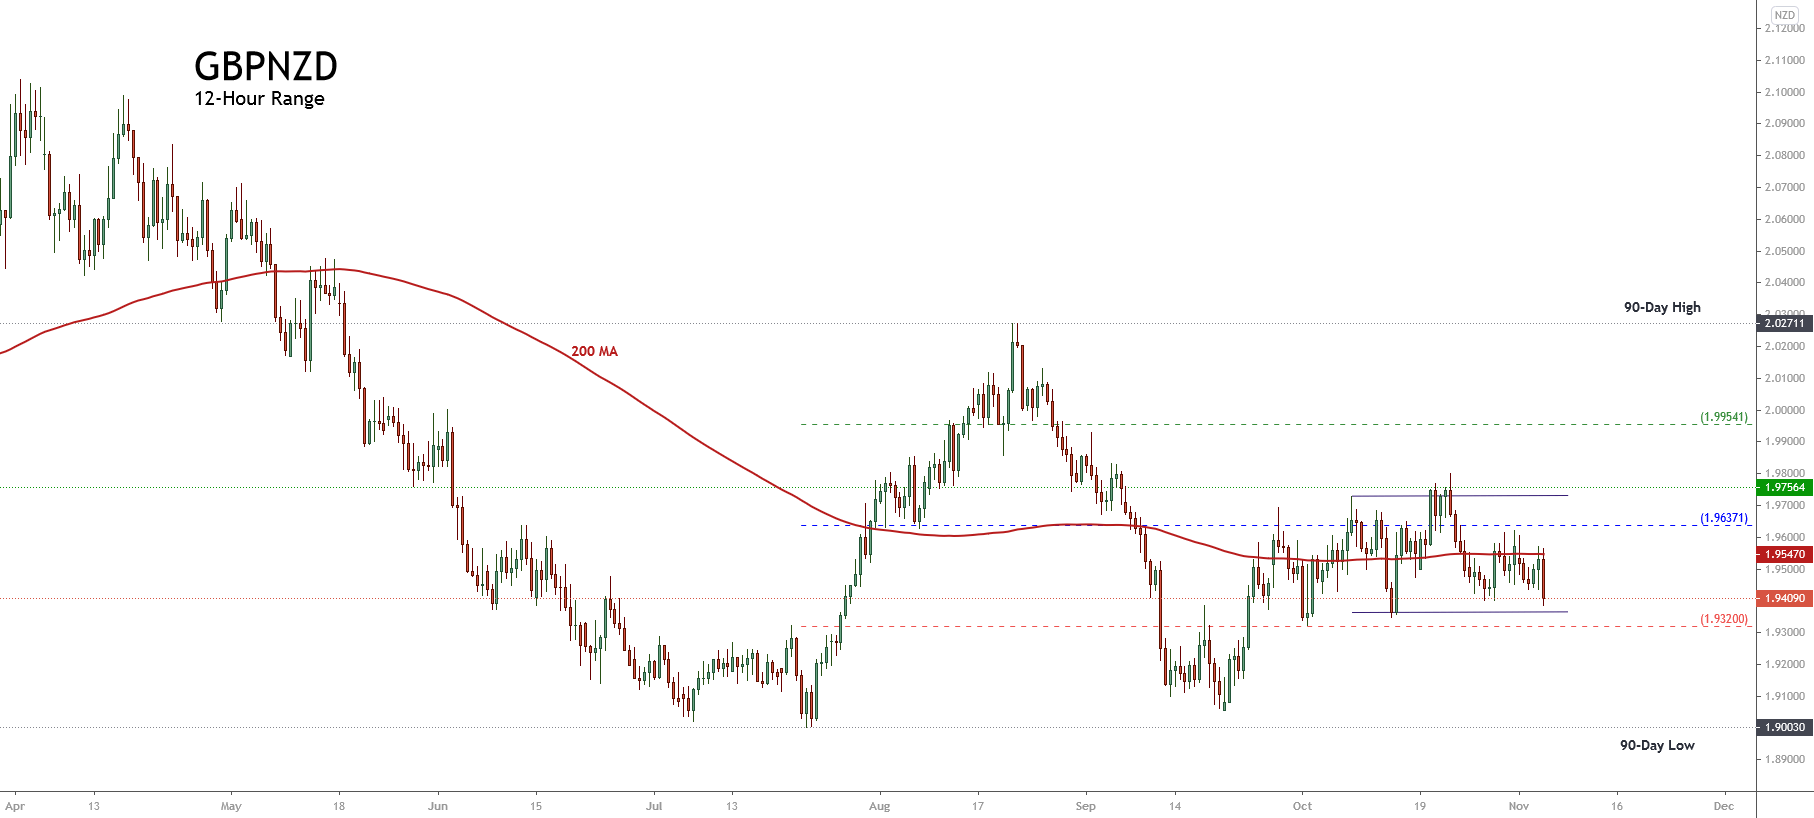
The GBPNZD cross declined 0.47% in the Wednesday trading session, propelled by the US presidential election’s tight results. In this context, the 12-hour chart illustrates the market sentiment, displaying the 90-day high and low range.
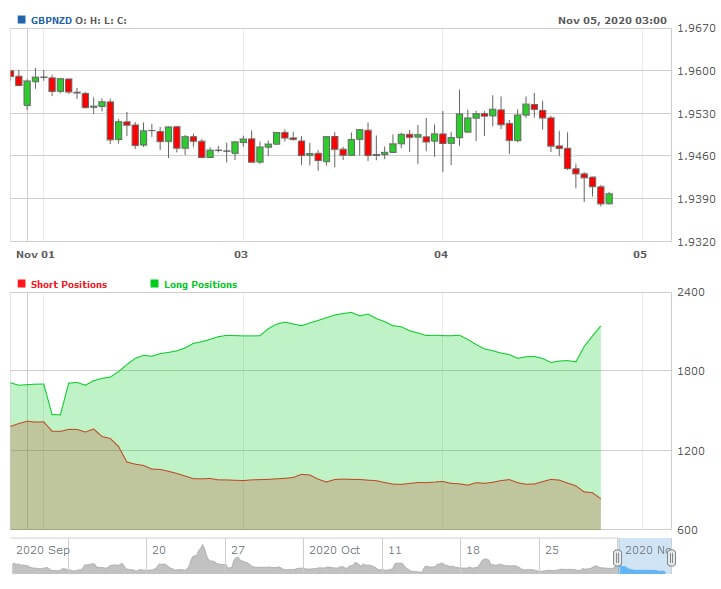
We observe in the previous chart that GBPNZD moves mostly sideways and consolidating in the bearish sentiment zone. Simultaneously, the price action moving below the 200 moving average is a confirmation that the short-term bias is to the downside Furthermore, the current session’s range and long body candle reveal the bearish pressure dominating the market sentiment. Finally, the following chart’s lower graph shows the retail traders’ activity positioning, which moves to 74% on the long side. This contrarian indicator confirms the bearish bias of big market participants.
In summary, as long as the GBPNZD price doesn’t unveil bullish reversal signals or surpasses the 1.96371 level, the market sentiment will remain on the bearish side.
Technical Big Picture
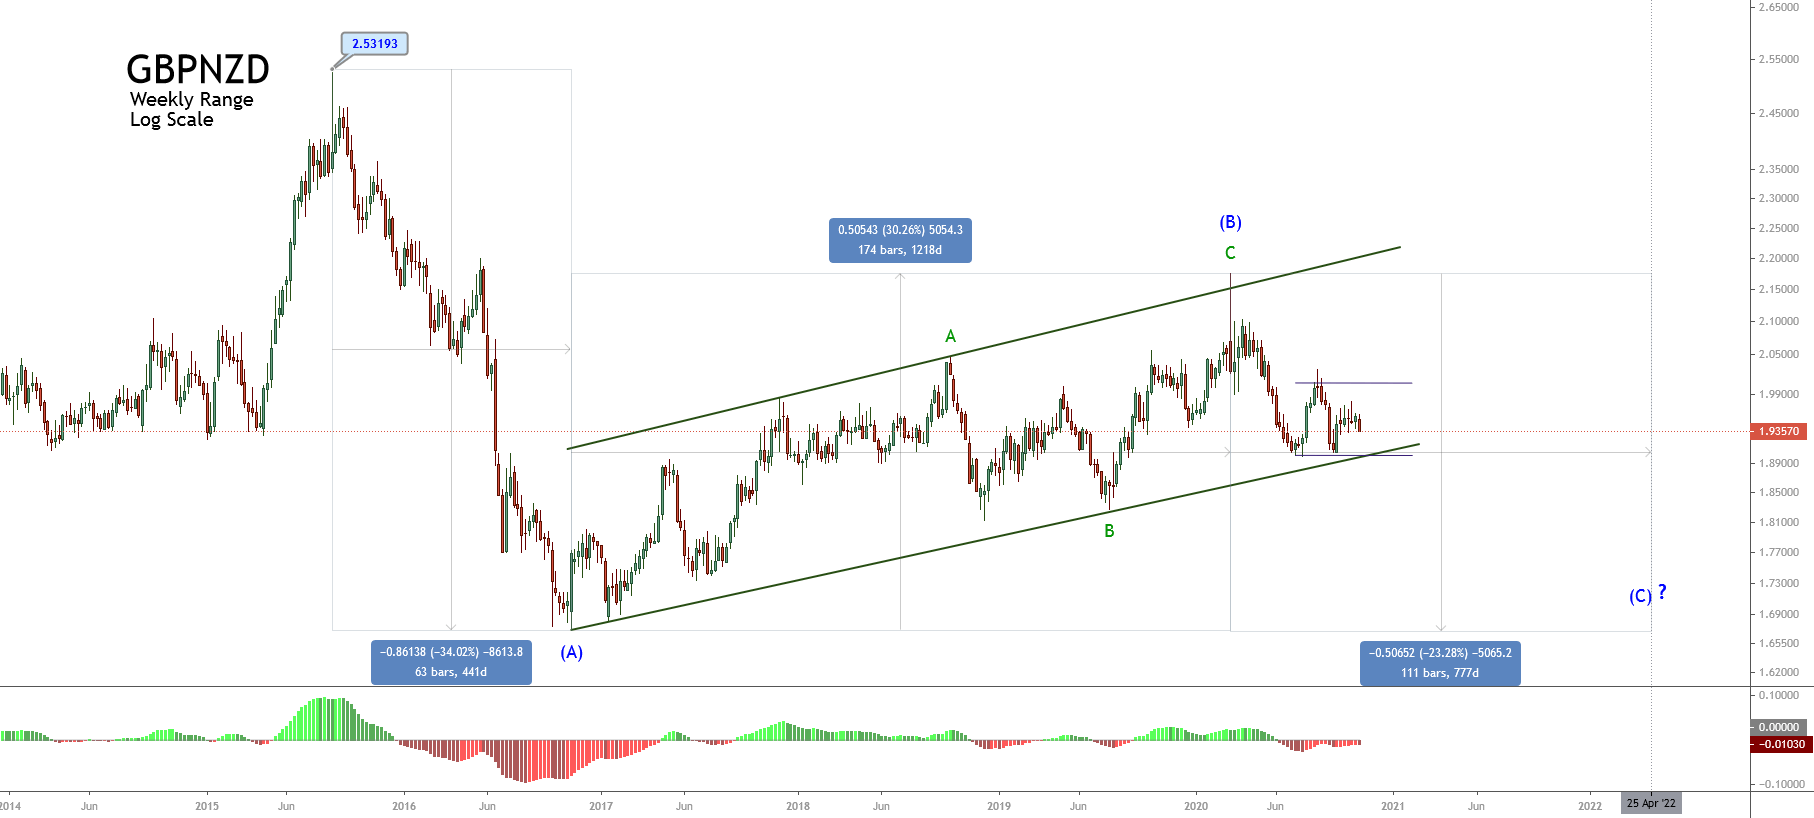
The long-term outlook of the GBPNZD cross under the Elliott Wave perspective unveils its advance in a corrective structure, which began in late August 2015 when the price topped at 2.53193 and declined in a three-wave internal sequence. This downward sequence ended in early November 2016, when the price found support at 1.67055.
Once the cross found fresh buyers, the price started to advance in an ascending corrective sequence identified as wave (B) of Intermediate degree, which ended in the first part of March 2020 when the GBPNZD climbed until 2.17598.
In terms of the Elliott wave theory, considering that the structural series in progress completed two segments subdivided into three internal waves, the sequence could correspond to a flat pattern, a triangle, or a double three formation.
Nevertheless, although the three potential structures have different implications, the pressure remains on the bearish side.
Short-term Technical Analysis Outlook
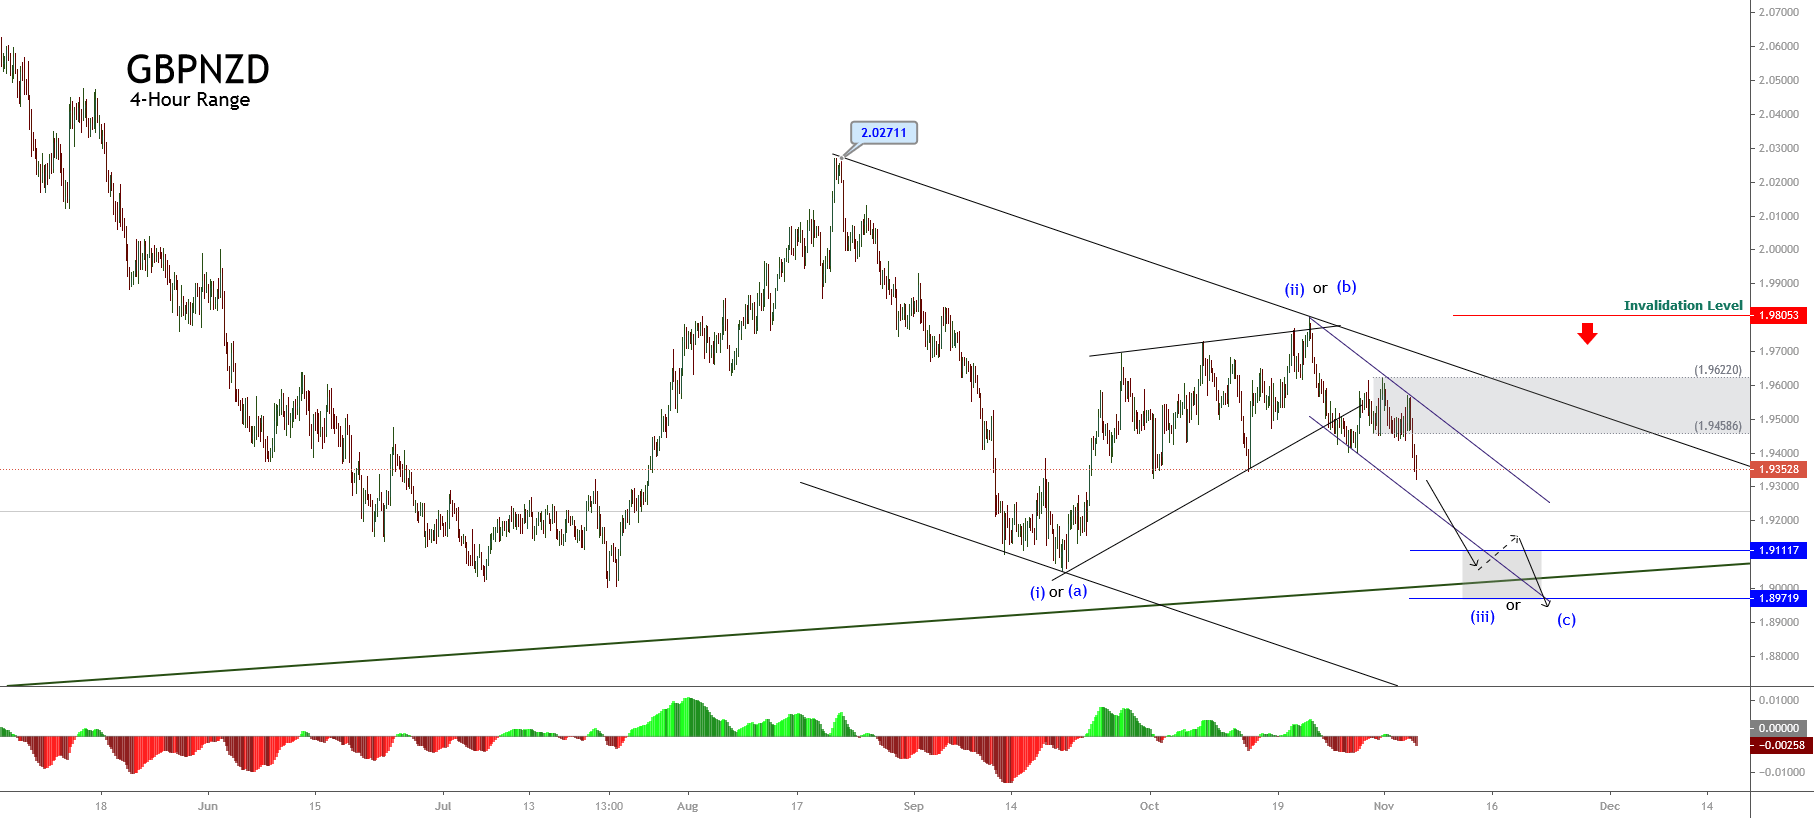
The GBPNZD cross in its 4-hour chart unveils the incomplete downward structure that began on August 20th at 2.02711. This bearish short-term sequence of Minuette degree identified in blue could correspond to a wave (iii) or (c).
In both cases, an upward retracement toward the psychological 1.94 barrier could serve as an entry to the bearish side. Likewise, the third segment, in development, could extend its drops to the area between 1.91117 and 1.89719, which coincides with the long-term ascending channel.
In this regard, long-term traders could wait for this decline where the price could re-test the long-term trendline to add to their long positions.
Finally, the invalidation level for this bearish scenario stays at 1.98053, which coincides with the end of wave (ii) or (b) identified in blue.


