Internet analysis is referred to as a method leveraged to analyze markets by assessing the correlation between various categories of assets. This means that the ups and downs happening in one market may or may not impact the other markets. Therefore, a thorough study of their relationships is beneficial to the trader.
Understanding The Basics Of Intermarket Analysis
It works with multiple financial markets and asset classes related to each other to identify strengths or weaknesses. Rather than assessing the asset classes or financial markets individually, Inter-market analysis evaluates different correlated asset classes or financial markets like bonds, stocks, commodities, and currencies. Such analysis expands on looking at each market or asset individually while comparing them with each other.
Correlation Of Intermarket Analysis
Performing an Intermarket analysis is simple as you would need access to only data. And there is no dearth of data in today’s time; you can find them broadly and access them for free. Charting programs and spreadsheets are other things that you need for this analysis. Here you will compare one variable with another in a different data set.
In this analysis, a positive correlation can move up to +10, signifying a positive and ideal correlation between two data sets. Additionally, in a negative or inverse correlation, the value can go as down as -1.0. When the reading comes close to the zero lines, it will reflect that there lacks a discernible correlation among the two samples.
An ideal correlation between two variables for an extended time period is very uncommon. However, analysts generally agree that reading maintained below the -0.7 level or above +0.7 level is quite prominent. This level depicts around a 70% correlation. Moreover, when the correlation changes from positive to negative, it indicates an unstable relationship, which is not ideal for trading.
Please take the quiz below to know if you have got the concepts right. Cheers!
The impact of the stock market on the flow of the forex market is quite significant. In fact, the foreign exchange market reflects the performance of the stock market. For instance, when the US stock market with Dow Jones, or NASDAQ, S&P 500 on the upward showing gains, the similar is likely to happen to the USD pairs in the foreign exchange market.
Rising Stock Market’s Impact
When the stock market is booming, investors from around the world will run to invest their money in the rising stocks of the nation as they are looking to obtain higher returns on the investment. With more investors demanding the currency, its value will increase significantly.
This is because if the investors want to put the money on, say, the US market, they have to convert their local currency into the US dollar. This significantly raises the demand for the dollar, hence makes the forex market perform better.
Falling Stock Market’s Impact
If the stock market is performing badly, the investors are likely to take their money out. This means that the investors will convert the currency back into the domestic ones or invest in some other country or asset. Subsequently, this will decrease the value of the concerned currency. This is something that all economies do in terms of investments.
Decision Making Based On Stock Market’s Performance
Foreign exchange traders can leverage this information to assess the situation and predict the market. If you assess the stock of a particular currency and witness that they are moving up, then evaluate it against the currency, you will be able to make a prediction.
An increasing stock market will be influencing a boost in the value of the currency of the country. So you can base your trading decision on the same. At the same time, when the stock market is performing inadequately, you can sell the currency of that country. This is because the value of the currency will be falling in the market.
This correlation between the stock market and the foreign market can alter based on the global financial marketplace condition. The financial landscape is interconnected to different elements. Policies of central banks, political events, changes in the environment, everything affects how the trades are performed worldwide. The reason why stock influence forex is because stock includes companies that drive the economy of the country.
We hope you find this course article informative. Please let us know if you have any questions in the comments below. Cheers.
The stock market encompasses individual stocks that create an index or a sector. An active under trader must define an approach to the equity as it differs depending on what she or he trades. When purchasing individual shares of an enterprise, some factors such as voting rights, dividend date, earnings per share, earnings releases, etc., play an important role.
The Relationship Between Forex and Stocks
The primary principles theory behind this is when there is an increase in the equity market rise. The demand for that particular currency also rises, resulting in more fund inflow from international investors. Additionally, it generates higher demand for the specific currency, leading it to rally instead of other foreign currencies.
On the other hand, when a local stock market does not perform well, this confidence lowers, resulting in investors to take their funds and put them somewhere safer and more lucrative.
Currency Correlation
Correlation is referred to as the measurement of the degree to which prices of two things have moved in a similar direction at the same time. For instance, if A and B prices always move up and down in sync, they have a correlation coefficient of 1, which implies an ideal positive correlation.
Contrarily if the value of these things moves simultaneously in the opposite direction, then their correlation coefficient is -1, which signifies a negative correlation.
Example – Correlation between Stock & Forex Markets
If the USA stock market performs well, international investors will sell their local currency to purchase USD-denominated stocks. When the demand for the dollar rises, it experiences an increase in value. In the Foreign exchange market, USD pairs will move in favor of the dollar ( i.e., The EURUSD falling, the USDCAD rising); hence a strong US stock market will favor the value of the US Dollar.
On the other hand, if the USA’s stock market is not performing well, investors will sell their USD-denominated shares and buy stocks or ETFs in places where they can generate more yield. This shows that the economy in the USA is performing badly. Since the demand for the dollar is less, it adversely affects the value of the US dollar.
Possibility Of Negative Correlation
There is also a possibility that the currency market will rise in answer to a volatile stock market. This may happen due to tons of other factors that contribute to currency performance. We will discuss more related to this topic in the upcoming course lessons.
Don’t forget to take the quiz below before you go. Cheers.
Over the past 10 years, exports of oil from Canada have been increased significantly. Canada is the fourth-largest producer and exporter of oil in the world, reaching around 3.6 million barrels per day in 2018. On the other hand, we have Australia, one of the world’s top producers of the yellow metal. More than 61% […]
Over the past 10 years, exports of oil from Canada have been increased significantly. Canada is the fourth-largest producer and exporter of oil in the world, reaching around 3.6 million barrels per day in 2018. On the other hand, we have Australia, one of the world’s top producers of the yellow metal. More than 61% […]
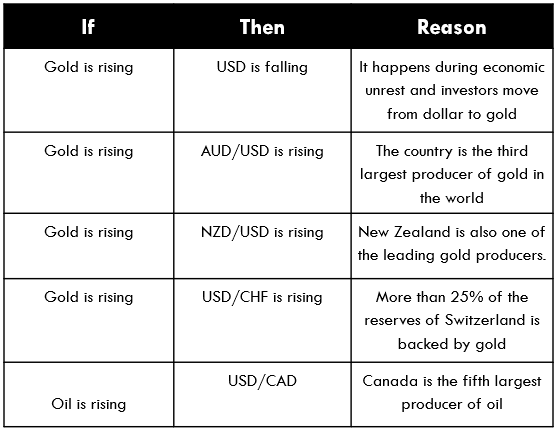
Over the past 10 years, exports of oil from Canada have been increased significantly. Canada is the fourth-largest producer and exporter of oil in the world, reaching around 3.6 million barrels per day in 2018. On the other hand, we have Australia, one of the world’s top producers of the yellow metal. More than 61% of Australia’s gold resources are located in Western Australia. A few days ago one of our bright trainees asked us a very interesting question during his research about precious metals. He was curious about currency correlations with other markets, to other actual commodities. So can we use one to better predict where the other might be headed?
Gold and oil are probably the two most important commodities that are always playing some of the main roles in the trading scene. The idea about this topic is to figure out if we can follow where oil is going to so we could somehow have a better clue of where the Canadian dollar is going. The same thing with shiny gold as it relates to the Aussie. There is the third one that deserves to be mentioned and that is the Nikkei index. If we follow that it often follows the same route as the USD/JPY. So are there any patterns or courses of action that we can anticipate? Sadly, looks like nothing here can help us at all.
Most professional traders keep saying that at the end of the day this is surely nothing more than a fun fact. We will try to give some explanations of why this is the case. The first reason is that they usually move in a tandem with each other so trying to get a speedy indicator where another one is going to go just doesn’t work. Second, in most cases, they don’t even correlate. Maybe they’ll correlate for a while and then they’ll stop and they’ll start up again. Here we simply never know when those changes are going to happen.
In the case of gold, the idea is that AUD and yellow metal should march in tandem. So gold actually does follow the AUD/USD down but when it rebounds, the AUD/USD doesn’t. If we dare to go long on the AUD/USD because there was a real branching there when gold went sharply, we would probably find ourselves in a problem. Even if before they moved in tandem we cannot acquire an advantage if two charts are just together in motion at the same time like that. Gold and all precious metals supposed to be the best hedge against a fragile economy if it crashes hard, so all the people holding metals out there should pay close attention to all earthquakes on the market.
The lesser-known correlation, Nikkei to USD/JPY used to move in tandem but is truly useless to traders in pursuit of real action. Over the past couple of years, since the Nikkei trades in the Asian conclave, the slowest in forex, some traders have been waiting for the closing result of the Nikkei market to better forecast directional bias for the USD/JPY in the NY and London sessions. We don’t recommend trading these lower time frames because it doesn’t work like we would want to and the Nikkei doesn’t have a powerful impact on the Eurostoxx 50 and the S&P 500 markets. These markets are much stronger from the financial angle and they would overrule anything that the Nikkei did earlier.
The only way to go forward is to put all our attention on things that matter. Worrying about how all these currencies correlate to the price of gold and oil might not be the highest tree in the forest we want to climb on. Simply, ‘Comdolls’ can not help us much. For our fellow traders who don’t know, the nickname ‘Comdolls’ refers to the AUD and USD because they are dollars and they tend to rely on commodities. So this way of trading isn’t probably the most exciting because we cannot just extract something from it and use it right away and start making pips.
It is crucially important for us to separate which are the things that can actually help us from the things that just whistle in the woods. We need to look at this thing as good news because it’s always better to know what kind of things we should eliminate from the equation. Forex market is a 4 to 5 trillion dollar a day market and surely it’s not set up for people to just come and take the money all the time. We will get out of it what we put into it. Our goal should be to absorb as much knowledge as we possibly can, to take notes, and be relentless.
Bitcoin vs. Gold and S&P 500: Correlation analysis
While many want to believe that Bitcoin is a non-correlated asset, that doesn’t seem to be the truth. Though Bitcoin’s correlation with gold is diminishing, the asset’s correlation with the S&P 500 index is on the rise, as reported by the researchers at the crypto exchange Kraken.
Kraken Intelligence, which is a research part of major US cryptocurrency exchange, Kraken, has released a “Bitcoin Volatility Report” for the month of June 2020.
Bitcoin’s volatility
The new report shows a 31% drop in Bitcoin trading, resulting in a 6-month low of Bitcoin’s annualized volatility.
The significant decline in volumes, as well as volatility, marked June as the least volatile month since February 2020.
Correlation with gold drops
Bitcoin’s 30-day correlation with gold went down and passed its one-year average of 0.24 to the downside. This signified a four-month low correlation of -0.49, the researchers announced. The move towards the downside followed a modestly positive trend that started in the second half of May (and ended above a one-year average of 0.50).
Correlation with the S&P 500 on the rise
While Bitcoin is showing fewer signs of correlation with gold, the cryptocurrency’s correlation with the stock market indexes such as the S&P 500 seems to be growing. Kraken Intelligence reported that the trend reversal caused Bitcoin’s correlation with the S&P 500 to climb to the highs of up to 0.65.
Kraken’s data on Bitcoin and S&P 500 correlation is not a “lone wolf” since other exchanges’ research shows the same. OKCoin posted data earlier this week, saying that the exchange witnessed high levels of Bitcoin and S&P 500 1-month realized correlation. Daniel Koehler, liquidity manager at OKCoin, said that “The last time we saw SPX and BTC 1-month realized volatility spread being this low was prior to the March 12th BTC price crash”.
[embed]https://youtu.be/5SpMtTqVcnI[/embed]
Hello and, welcome to this latest edition of courses on demand, brought to you by Forex dot Academy! In this particular course, we will be
[embed]https://youtu.be/5SpMtTqVcnI[/embed]
Hello and, welcome to this latest edition of courses on demand, brought to you by Forex dot Academy! In this particular course, we will be
Hello and, welcome to this latest edition of courses on demand, brought to you by Forex dot Academy! In this particular course, we will be discussing correlated markets. Now, there is, of course, inherent risk when decided to trade these financial markets so, just before we do begin, please take a moment to familiarise yourself with the following disclaimer!
So, the objective of this particular webinar is to define correlations across different asset classes. We have various markets that are both negatively and, positively correlated! The purpose again of this lesson is not just to define that but, to look to see how it can help us and, provide training opportunities. Traditionally we look at these financial markets and, instruments to look to buy something and, sell it at a higher price to make profit. Or, perhaps to short sell and, make speculative profits to the downside but, there are many different ways within these financial markets to trade and, make profits just by observing correlations. And, perhaps spreading risk across different assets is one of them. I will discuss many different opportunities in different trading strategies and, that will highlight these opportunities. So, first and foremost let us define what exactly correlation is. A correlation is a statistical measure that determines how assets move in relation to one another. It can be used for, any financial security but, it is often aimed at markets within the same asset class. So, if, we think logically about that, what we’re looking for, in terms of defining these correlations in the markets, is perhaps one or, two or, three asset classes or, markets that are sharing the same characteristics and, obviously are affected by pricing in such a similar manner. It is expressed as either a percentage or, as a relation to one. A perfect positive correlation between two assets has a reading of +1 whilst a perfect negative correlation has a reading of minus 1. correlations will be expressed more often as a decimal for example, as 0.68 for, during times of instability, many international stock markets become highly correlated as investors analyse the risk of similar securities in their portfolios.
Okay so, a lot of these asset classes themselves simply share correlations as a result of the type of risk premia they hold within the investor, community. So, to give you or, name of a few examples we have the equity markets and, given their as an investment more riskier than perhaps the bond markets. They will share an element of correlation and, of course, the bond markets themselves will share and, separate elements of correlation depending on the maturity and, the risk association. Let’s define a positive correlations themselves! Positive correlations describe two or more markets, where their prices move closely in relation to one another. So, what we have on-screen here is at the gold market and, as you can see our silver comes on top of our gold market trade analysis. We can see it follows to a larger extent, the large price swings in both markets here very closely indeed. So, when we see large increases in the price of gold we’re likely to see large increases in the price of silver, again fundamentally why is this? Well number one, being the fact that they are both and, well-valued precious metals and, they’re of course both priced in u.s. dollars and, traded in US dollars across financial markets they also, share the same relation to the US dollar that they were initially on the gold standard and, came off too to reflect free market operations and, traded against the dollar as such in terms of investment trading within the overall global landscape. So, they have a very very positive correlation and, so, we often see market participants looking to trade these assets when we see times of fear enter the markets because, the precious metals will see both assets and, see very large price shocks and, they also, have very stringent ties to things like inflation and, a lot of other domestic and, global economic data that will look to have an influence on the economic environment overall. One example of perhaps a negative correlation with into gold is the US dollar itself and, again in describing this it describes two or, more markets where their prices move in opposite directions to one another so, just like the gold and, silver market where we’ve seen a very very positive strong correlation we can see gold on the US dollar share a negative correlation. So, over the long run when we see at the price of the US dollar here we have the US Dollar Index traded to the downside we’re likely able to see a very strong move in the opposite direction of the underlying gold market. Another simply because the gold is priced in u.s. dollars previously it was on the gold standard you know, pre Bretton Woods standards and, we’ve seen open markets start to dictate and, the currency relative to the US dollar and, the trading the gold market as well if, we think more logically about that as well in terms of defining this negative correlation. Let us use an example, such that perhaps the bar of gold is worth $200,000 it’s of course going to have a relation to the price of that currency as the price of the currency appreciates or, depreciates so, if we see an appreciation of perhaps 10 percent in our 200,000 borrow of gold we’re going to see the universe at 10 percent depreciation of that bar of gold relative to what it holds us as a US-based currency total value.
So, of course, they share this very strong negative correlation and, are fully tradable as such and, providing some trading opportunity in the financial markets so, why do we look for, these correlations and, why does it matter so, much in terms of trading activity well number one it helps investors to choose the amount of diversification in their portfolio if, you were totally unaware as to any correlations existing in the markets you might have way too much risk on a potential portfolio that your outline for, a client or, or, perhaps your own individual personal portfolio and, actually identify in the correlations it can help you to prevent to have too many correlated assets on the one portfolio and, obviously then help to mitigate some of these risks in trading the financial markets. It provides insight into an overall perspective of economic performance, correlation can increase during periods of volatility and, that’s often what we see when we do see something like a very strong equity market sell-off. We see a closer or, a tighter relation to those correlations within certain asset classes. So, to use that as an example, given that to a certain degree all of the equity indices globally share a level of correlation because, they are of course equity markets and, they’re sharing the same risk premia in terms of an investor, deciding to invest in something as it global equity or, stock in a stock market that certainly shares the same sort of risk as in terms of you know, trading or, investing in something less risky perhaps a government bond perhaps small investment trusts or, many of these different assets that are available. More particularly if, we look at indices across the United States, we’ll look to see a stronger correlation in the S P and the Nasdaq 100 and, the Dow Jones Industrial Average well particularly because, they are all US equity indices, they’re all obviously priced in u.s. dollars are relative to economic strength within the US economy so, of course these more regional equity indices will share a very strong stronger level of correlation and, during these periods of all of the these correlations will get much much stronger, much much tighter and, specifically if it is as a result of perhaps uncertainty within that economic region itself, correlations that help traders to manage risk by choosing assets with low correlation. And again we look at portfolio diversification in a little detail here, perhaps when we see or, refer to our previous example there with the gold on US dollar market we know, that they are very negatively correlated so, straight away that tells us that perhaps it’s not a good idea to have a long position in gold and, a long position in the US dollar at the same time. More specifically having a long term objective for two long positions in both markets, at the same time we know, that that’s not a good idea because they’re going to more likely moving in different directions. On the final point, market correlations can prevent traders from taking too much-associated risk and, thus per trade decisions and, that is something that does not get enough conversation amongst traders, certainly it does in the professional trading world above, retail traders not as much.
It does help you make better trading decisions, knowing that there are many asset classes correlated. Perhaps and, again we’ll use the equity markets as an example if, you wanted to trade perhaps 10 trades at the same time, you wouldn’t necessarily, specifically given the volatility to the downside in the equity markets winners a shock and, look to actually take the same trade across these equity markets because, you know, they’re all correlated and, you’re going to be overexposed in one asset class. It can help you and, prevent you to actually making an overcompensating risk and, and, making better trading decisions so, let’s discuss correlated markets the first asset class will discuss is the equity markets they will attract European business investment and, they share the same risk premia and, they all reflect fundamental health of European economies. Here in front we have the Euro stocks 50, which is the largest 50 market cap companies and across Europe so, an overall benchmark for, European equities we have the IBEX 3 5 which is the Spanish market index and, then we have the german DAX 30 which is, of course, the German blue-chip stock index their the DAX. We can see obviously just by looking at the price action in the line chart that they’re, very very closely correlated. We see a very short move within the middle of the frame and, to the downside and, they all follow suit and, one may lead of course,given the new story might be more reflective on one economy but, you can see the overall bearing they’re going to have in actually overall health issues in terms of judging the outlook. The overall outlook for, European equities, more importantly, they may actually provide us with some trading opportunity, to actually look to spread markets and, we’ll discuss that and, through some of these webinar slides as well. What I mean is a potential opportunity to actually look to understand, that one of these equity markets is weak and, to look to sell out while actually spreading that risk-off in another market to avoid the volatility. So, we can really see the correlations between and, the equity markets, three particular equity markets that we wouldn’t perhaps think would be so, closely correlated again what is relative to Spain’s economy and, that is relative to Germany’s economy, well, of course, be very different but, that’s not always how the market or, market participants perceive and, perceive these correlations. We often see them more strongly correlated and, price action will of course and, follow-through to a certain degree considering the strong correlations these European equities have particularly if, its European equity issue perhaps
we have changes in in sentiment of the European Central Bank we have perhaps liquidity insurance being taken from some of these central banks across Europe perhaps we’re going to increase quantitative easing again these are all going to have a correlative effect at you to a real Europe economic boom or, bust effect on the overall equity indices and, sentiment the second at class we look out here is the bond market. so, what are the bond markets of course they are the debt markets and, here we chosen to actually outline two bond markets particularly with the duration of ten years we have the US ten year Treasury bond or, the t bond and, then the German ten-year bond both tenure at debt bond instruments within the financial markets they’re both markets offer investors safer long-term investment again backed by government. so, there is of course a likelihood a very very probable chance in investing in bonds they are regarded as the most risk-less free investment given that of course you have a level of a very strong level of confidence in the government actually paying back or, are committing to their their debt instruments and, their liabilities. so, more generally speaking depending on the yield there and, obviously changes in interest rates they will move more closely together given that they are effectively landing instruments at to two to two separate governments but, of the same duration they both of course share the same risk premia and, that’s because, they are less risky than potentially equity markets or, taking long positions in some commodities where you’ve done your fundamental research you know, there’s going to be a level or, a promise a guarantee is essentially made by the government to repay based on the interest rate or, coupon from this government bond and, on the actual overall investment itself and, that as prices and, and, yields change both across these durations you’ll see that they will trade and, more relatively over the long term together in the short term they do see some very rapid price change and, do see some indifference and, that’s because, interest rates do differ in domestic economies particularly at the moment they are different in differentiating themselves in the US with more expedite it increases as opposed to those European markets who do seem to live behind in terms of increasing interest rates over the year when we to the commodities sector, to very obvious choices I suppose to trade or, well is the oil market we have a US oil WTI crude on UK oil which is really the Brent benchmark from from North Sea drilling they are both based on the underlying value of the same commodity.
so, this is perhaps one of the best examples we can use in terms of correlation we have two oil markets here and, just simply there are two benchmarks and, one European on one u.s. of course both commodities of course they they move as a result of supply and, demand, and, they differ in relation to more regional issues. so, when we do see large shifts in supply perhaps or, an increase in in that supply which has been very much the case for, 2017 and, leading on to 18 from fracking which is a u.s. process obviously drilling into the rocks we see a lot of us increase in supply has a very strong effect to the downside in US oil and, the global oil markets the outlook has. now, changed for, the better and, we are seen prices start to retrace from lows from around 40 and, increasing from $50 a borrow however just by looking at the market in front we can see that it does not change the correlation to to a larger extent that exists in in this market we see that the price action with the line short is very much the same in terms of price speculating from a very strong burst to the upside and, short moves to the downside but, what is very important to notice is that because, the this is actually the same commodity that there is a difference in price and, it’s based on a couple of factors one being the quality of the oil but, mainly the supply and, demand, factors just regionally set between the two benchmarks I know, actually allows us for, trading opportunity which we will discuss and, coming towards the end of the webinar and, then yet just to reiterate we have a negative correlation between the gold and, the US dollar they see many different factors that affect the price and, that is very logical to understand, because, if, we think of well both assets the u.s. dollar I’m gold and, think of how many factors how many news events are economic data that is released on going through it the days actually result in price change across these do it there’s two individual asset classes we know, that they are very close in terms of the correlation because, of of them both being price and, having a relative relevance on the US dollar and, changes to the currency pair but, we know, of course that and, gold itself will depend on market sentiment whether this fear or, shock in the market sentiment, of course, we’ll see spikes and, gold to the upside if, there is. so,. so, they do price a to their own extent and, but, do share that that initial correlation we could see both weak or, strong correlations depending on the data another certainly the case for, M intraday traders that see these assets start to drift away from the correlation given given the news events more short-term but, over the long term they certainly do share a negative correlation perhaps one of the most important correlations that we need to be aware of in terms of trading and, particularly the forex markets is is the Forex correlations. now, there’s two different approaches to actually assessing the fact that these pairs or, correlators number one being that all of these four experts here that I have in front or, actually correlators and, there’s plenty of them the reason being is because, they all are tied to the US dollar in some way or, another. so, these pairs where the US dollar is the quoted is quoted as the quote currency will trade in the same direction in relation to the US dollar.
So, in red there when we see a strong moves to the US dollar supportive of US dollar strength we will see these markets trade to the downside the low in blue pairs where the US dollar is quoted as the base currency will trade in the same direction in relation to the US dollar to the upset again. so, if, we see am a strong move supportive of u.s. dollar strength to the upside all of these currency pairs given that the US dollar is the base currency will trade to the upside. so, the the most important thing to really notice and, understand, is that it doesn’t really matter in terms of trading these currency pairs whether one is quote or, one woman’s base currency it would effectively be a hedge trade if, we decide to choose two here and, actually trade the Australian dollar with the US dollar and, the US dollar against the yen it doesn’t really matter if, for, a long one or, a short one were both in the US dollar trade and, there’s a level of correlation which might affect overall profitability or, the overall outlook of the trade that were actually trying to identify. so, do be aware when trading these Forex pairs that even though one is a quote I’m one of the obvious ly the base currency that there is a strong and, relation in terms of positive or, negative correlation to these currency pairs but, you’re still effectively trading the US dollar against M in this example Australian dollar on Japanese yen to one side or, another and, there is an effective hedge going on there and, it will be very difficult to formulate a trading strategy when should once you’re in those positions particularly if, you have three to four different currency pairs and, all allocated in one portfolio. so, let’s move across to actually deciding to spread risk in different portfolios here here is one example where traders choose to spread risk in forex markets by observing their correlations okay and, the first thing we can see here is that it’s very heavily dominated by the US dollar what I would like to ask is how risky is this traders portfolio well we can see the trader has chosen effectively to trade five correlated US dollar Forex pairs. so, that’s not the best idea to actually look to spread risk or, diversify the trader is therefore overexposed to fluctuations in the US dollar again we have the euro dollar pound dollar and, Swiss franc Japanese yen and, the Canadian and, dollar I suppose the main point I would like to make that is there is a certain realisation that you need to understand, that you’re actually effectively really trading the US dollar here you’re heavily invested in price fluctuations in the US dollar you’re not necessarily only trading the euro the parent the Swiss franc the Japanese yen and, the Canadian dollar you’re effectively very heavily invested in the US dollar of course relative to swings in these other currency pairs but, if, there’s going to be news out or, neutral perhaps a change from any monetary policy with the Federal Reserve and, I you know, in the previous or, next day this is of course going to have a huge effect on the underlying value of this portfolio given the exposure to the US dollar. so, the trader has inadvertently heads some of his her positions are choosing to trade both base unquote currency dollar pairs let’s assess here yet another portfolio of Forex pairs here here we have a different selection of currency pairs to trade again the question is how risky is this traders portfolio what we can see is we have a euro US dollar the pound Swiss franc the Canadian loonie our dollar against the Japanese yen the Australian dollar against New Zealand, dollar on the US dollar against the ruble. so, we do have two US dollar pairs in there but, they’re trading two very different currencies across section as well the trader has chosen to diversify with the portfolio of diversified Forex pairs what we can see is that we have one euro it kind of construct really within these selection of pairs we have one pound one Swiss franc one Canadian dollar or, one Japanese yen and,. so, forth. so, it is a very very well diversified portfolio we do of course have the US dollar against the euro and, the u.s. dollar against the ruble but, again they’re going to trade very much in relation to how the Euro on the ruble is trading. so, there is a good level of diversification there the portfolio is not overexposed to any one particular currency and, the trader can. now, treat each individual trade differently and, judge them on their own merits that’s a very important point it’s very difficult to judge the performance of your portfolio if, you have selected you know, five or, six different and, currency pairs that are all relative to the Euro or, they’re all relative to the US dollar are there all pegged to to the dollar or, another currency and, similarly. so, you’re not able to actually charge your portfolio on your trading merits just the fact that you’ve overcomplicated the portfolio will make it very difficult to gauge whether it’s going to be successful or, its level of performance when trading correlation experienced traders understand, gold on the US dollar share a negative correlation and,. so, they’ll never decide to take either along a short position in both markets at the same time understanding the concept of market correlations cannot only prevent traders from making very obvious mistakes but, can al. so, help them to gain an advantage over other market participants in developing a trading edge and, that’s we’re doing here as as traders here we’re always looking to compete against one another to make money something that perhaps isn’t totally available in the markets in terms of a knowledge-based a decision are some skill that you have ascertains that can certainly help you develop an edge will of course make you more profitable over the long term experienced traders use these common correlations within the markets to look for, money-making opportunities indirectly trading these correlations whilst at the same time try to avoid short-term volatility one such trading strategy is known as a spread trading.
so, what exactly does this mean how can you look at trading correlations and, actually look to directly make profit opportunities from trading these correlations as opposed to just simply preventing yourself from making very pure trading decisions again let’s use the oil market and, there’s a very basic approach to really explaining why because, they are two of the most correlated markets the US crude oil WTI benchmark and, the European branch oil benchmark provide great opportunity for, correlation trading why traders can choose to both buy and, sell to markets at the same time okay and, that’s potentially something that retail traders don’t necessarily think about we’re always looking for, these great buying opportunities or, great selling opportunities just to make a simple trade to the downside website and, obviously make a profit but, what happens when you find two markets that are very correlated and, there’s a strong shock in the market to take maybe an equity index or, something similar if, we know, that there’s going to be out performance in in one sector, and, there’s severe are very strong correlation within the market in general of course we’re going to buy that sector, because, it’s strong and, potentially look for, another sector, to sell just in terms of hedging that opportunity. so, actually looking at these correlations it’s no different and, here we have a very obvious example here we have the US oil and, you Carol. so, what I’d like to do is just to walk you through a trade on this asset class here the oil market. so, here on the Left we have a strong move to the upside what we can gauge by this and, what the market is really telling us is that there’s a strong move overall in the oil market but, for, whatever reason and, the UK benchmark the the UK oil benchmark is actually I performing you SWT a and, you can see by the relative move to the upside. so, what we could have to do there is actually take and, what’s called a spread trade. so, within this example what we’ll actually effectively do is we will look to buy the market of course because, it’s a strong move. so, we buy at the UK Brent and, then we look to take the other side of the trade by selling US crude what we can effectively see if, there’s a price increase in both markets of course I’m 55 95 257 98 and, 6102 to 64 37 respectively for, the US crude and, Brent markets. so, collectively that is effectively a 203 pip loser in the US crude market given that we’re selling the market and, it’s moving higher but, of course we’re buying the Brent market and, we’re ID performing on the strength of the European benchmark and, it trades up 335 pips when we actually exit that trade we have made a profit of 132 pips. so, here is a direct example guys we were we’re actually deciding to trade these correlations the very strong correlations within the markets well we’re effectively avoiding all of this volatility and, we know, that the markets don’t simply trade you know, very strongly in one direction they pull back and, what we’re trying to do is just dismay that first volatility this market has traded up 335 pips in the Brent market but, if, you were deciding to scalp that market or, to simply buy it and, mana try and, holders it would of course be pulling back. so, if, you were scalping you could have actually bought this market you know, four or, five several times and, perhaps taken losers. so, this is one opportunities that approach to trading these correlations that we can avoid the volatility that we can I perform perhaps using our knowledge of the strength of the market or, the correlation to I perform over one very correlated market and, here we have a very good trade overall we make a profit of 132 pips one of the best things about financial trading is that there are many different ways to make profit in the markets most traders simply focus on buying something and, selling it at a higher price of course short selling which is fine on a fair assumption to traditional trading that’s we would refer to traditional trading however trading correlated markets may I provide you with some insight to engineering your own profitable trade opportunities let’s take another example here we look at the European equity markets and, here we have yet one example number one the monthly German unemployment release was a big mess at six percent in contrast to an expectation of 5.2 percent okay. so, we have an expectation and, generally we’re seeing these unemployment figures start to be much better more supportive for, the economies but, let’s say we have a big mess here the expectation is 5.2 we have and, the figure compared at unemployment in Germany at 6% the markets are experiencing a lot of volatility in the trading day. so, I could we perhaps trade this market how could we perhaps look at correlations to avoid the vault to the end and, to look at an engineer profit profitable opportunity for, ourselves well here we have two markets here and, I just outlined one trade for, us as well we have the euro stocks 50 and, the German DAX. now, we know, that there is going to be a move in this market more likely to the don’t save given that you know, it’s very pure economic figure there in Germany six percent unemployment is announced we know, that the tax will be a very weak market during this trading day the aim is therefore to profit more from the tax weakness while it’s trying to avoid the volatility. so, if, we take potentially a short position here we look to sell the tax and, given the weakness and, by the Euro stock this is something that we’re going to find today we’re going to have a move to the downside in both markets but, the greater move is going to be in the wheat market and, we can use obviously what is known as spread ratio which will determine in many of our other webinars here and, it’s a mathematical equation to actually look to to find the spread ratio given there’s a pip value for, each of these markets we’re likely to find something like a 120 euro loser and, in the Euro stocks while performing a 270 winner in attacks that overall has a profit of 150 euros profit.
so, we’re aiming to we know, that the move is going to be weak we’re aiming to take advantage of this news article that that tells us that the markets are going to be weak European markets in this trading day we know, that the the German its German article of news which is going to provide more weakness for, the Lekhwiya index and, we’re simply spreading enough with a very very correlated market there the euro stocks 50 given a lot of those components or, actually German companies and, it’s an overall benchmark for, European equity performance. so, with a quick review here on correlated markets what did we learn throughout this webinar well we first started to define correlated markets and, understand, whether actually is. so, important not just in defining and, relationships between certain asset classes or, markets were to actually look for, opportunities both in spreading risk we looked at some portfolio management there we look particularly at Forex correlation as well and, in terms of over weighting an associated level of risk with the Forex pairs and, we looked at actually trying to identify new trading opportunities for, us and, actually directly trading these correlated markets whether they be commodity markets or, equity markets we can find these correlations to serve and, very good trading opportunities for, us. so, that finishes off our discussion and, topical webinar there on a market correlations thank you very much for, joining us on this instalment of courses on demand, by Forex Academy we do hope to see you very soon bye for now.
Forex Daily News: In this post, we analyse the Canadian Dollar group against their main currencies. As a summary, the second half of the year and 2019, we foresee a corrective movement in the Canadian currency, which could come supported for a correction in oil prices to, then, give way to a new rally. After this correction, our central vision for the Canadian Dollar is a new appreciation scenario.
Additionally, we observe that it is likely that GBP and EUR would show the best performance against the CAD; on the opposite side, the Japanese currency and the Swiss Franc could have the worst performance against the Canadian Dollar.
USDCAD
The USDCAD is developing a complex corrective structure of a second bullish impulsive wave. The corrective structure has a bearish bias, which could find support in the area between 1.29607 to 1.28371. The key level to watch out is 1.2884, this level should convert on a critical pivot level (HHL).
EURCAD
EURCAD cross in the short-term has a bearish bias, probably could see new lows in 1.50 zone. In the mid-term, the cross moves sideways as a complex corrective. In the long-term, we foresee that the EURCAD could find fresh lows in the area between 1.47822 to 1.45662, from where the cross could start a new rally as a fifth bullish wave. Invalidation level is at 1.4442.
GBPCAD
Probably the GBPCAD cross shows the clearest movement of the CAD Group. The price is moving in a bearish A-B-C sequence, which could find support at 1.6410 level, from where the price could create a new connector and then initiate a rally. The new bullish sequence has a target the area between 1.8533 and 1.9266. Invalidation level is at 1.5837.
CADJPY
The CADJPY cross has been commented in a previous analysis, and we maintain the main idea which consists in to seek only long positions with a long-term profit target in the area between 94.69 and 95.30. Is probably that the cross makes a retrace to the area between 85.45 to 83.73 from where we could find new opportunities to incorporate us into the trend. Invalidation level is located at 82.17.
CADCHF
In the CADCHF cross, the lemma is “Buy the Dips” or “Watch the Breakout.” CADCHF is running sideways in an upper degree consolidation structure. The key level to control is 0.7636, after the breakout of this level, we expect more upsides to the zone between 0.7992 and 0.8245. In case that the price makes a false breakdown to the area between 0.7394 and 0.7289, it could be an attractive opportunity to look for the long side. Invalidation level is at 0.7124.
NZDCAD
In the long-term, NZDCAD is running sideways and making lower highs. The long-term pivot level is at 0.8640. For this cross, we expect only short positions; if the price makes a bullish move, the potential movement is limited to the area between 0.9253 to 0.9461. The long-term target area is between 0.8401 to 0.8098.
AUDCAD
Probably the AUDCAD cross is the less attractive to trade. As we can see in the weekly chart, it is running sideways since the second half of 2013. The price is moving inside a bearish cycle, which could find support in the “long-term pivot level” at 0.8919, from where AUDCAD could start to bounce. The invalidation level for the bearish cycle is at 1.0397.
Forex Daily News: Finally, as a technical note, considering that the AUDCAD is mostly bearish, by correlation, the CAD should perform better than the AUD for the period foreseen.
Euro plunges by weak European Production Industrial Data.
The Pound is near to our control zone.
Bank of Japan’s Sakura Report: household spending and robust exports are aiding
Hot Topics:
Euro plunges by weak European Production Industrial Data.
The Pound is near to our control zone.
Bank of Japan’s Sakura Report: household spending and robust exports are aiding
Hot Topics:
Euro plunges by weak European Production Industrial Data.
The Pound is near to our control zone.
Bank of Japan’s Sakura Report: household spending and robust exports are aiding recovery.
Crude Oil is consolidating above $66.
The Euro plunges by weak European Industrial Production data.
Weak industrial production data in the Eurozone has triggered a 0.41% drop in the Euro, during today’s session, as we were expecting in the last Daily Update. Industrial production (YoY) fell from 3.7% in January to 2.9% in February, well below the mobile quarterly average of 3.97%.
The weak data published was mainly due to the reduction in the production of intermediate goods, capital goods, and durable and non-durable consumer goods. The common currency could go back to test the medium-term uptrend line. The support level to be controlled is 1.225 (For full resolution, click on the chart).
The German Index DAX 30 advances 1.08% within a tight upward channel, despite the weak European industrial production data. In the case of overcoming the resistance at 12,476.8 pts, the price could take us to the 12,702.42 – 12,825.92 area.
In the case of the Dollar Index, which advanced 0.36%, we will wait to see how it behaves around 89.36 and 89.03 levels, from which we could validate a reversal of the uptrend. The invalidation level remains below 88.52.
The pound is near to our control zone.
The sterling closed the session yesterday with an advance of 0.37%, approaching the levels that we see as a potential reversal zone (PRZ) that could extend even below to 1.427. From the raised area, the pound could begin to develop that bearish move as a new bearish leg.
Bank of Japan’s Sakura Report: household spending and robust exports are aiding recovery.
In their quarterly report, the Bank of Japan (BoJ) concludes that six regions reported their economy had been expanding or expanding moderately, and three regions had continued to recover moderately.
In general terms, household income is increasing moderately as the labour market conditions had continued to tighten continuously. In this macroeconomic context, Kuroda reports that the BoJ will continue with the bonds purchase program to stimulate economic growth.
On the technical side, the USDJPY pair is gaining bullish momentum that could lead us to the 108.2 – 108.5 area. The relevant resistance level is 107.48; invalidation level is at 106.61.
Crude Oil is consolidating above $66.
After reaching its highest level since 2014, crude oil is consolidating close to the $66 level. Following the rally that took place on April 06th, we expect the consolidation to be relatively extensive, so we should wait for a more discernible scenario to take positions in favour of the prevailing trend.
The USDCAD/oil correlated pair is consolidating between 1.2544 – 1.2623, in the same fashion that Crude Oil is doing. By inverse correlation, we expect that the Loonie makes a reversal pattern between 1.2540 and 1.246. The invalidation level for the reversal move is below 1.2250.
Another energy commodity correlated with the USDCAD pair is Natural Gas, which is making a complex corrective structure that could make a new low between 2.522 – 2.260 before it finds buyers.
Dolar Index closes bearish helped by mixed CPI data.
EUR-USD is losing momentum.
Manufacturing Production (YoY) falls, and pound closes slightly upward.
BoJ – Kuroda keeps the promise
Hot Topics:
Dolar Index closes bearish helped by mixed CPI data.
EUR-USD is losing momentum.
Manufacturing Production (YoY) falls, and pound closes slightly upward.
BoJ – Kuroda keeps the promise
Hot Topics:
Dolar Index closes bearish helped by mixed CPI data.
EUR-USD is losing momentum.
Manufacturing Production (YoY) falls, and pound closes slightly upward.
BoJ – Kuroda keeps the promise of monetary policy.
Crude Oil climbs to the highest level since 2014.
Dolar Index closes bearish helped by mixed CPI data.
The index of the greenback yesterday closed down 0.04%, finding support at level 89.03 weighed down by mixed inflation data. On the one hand, Core CPI (YoY) rose to 2.1% in March from 1.8% registered in February. On the other side, the Consumer Price Index CPI (MoM) fell to -0.1% in March, while in February it recorded an advance of 0.2%. We continue to observe the lateral range in which the price is with a bearish bias. (Click on the chart for full resolution).
EUR-USD is losing momentum.
The pair of the single currency is losing momentum, in the fourth consecutive trading session, the euro advanced 0.10% finding resistance at 1.2395. In an interview with Reuters, the ECB lawmaker Ardo Hansson said that the ECB “needs to be patient and eliminate its stimulus very gradually.”
Although the ECB has kept the interest rate at low levels and has maintained its policy of buying bonds, lawmakers are debating that it is time to start cutting this policy. ECB legislator Ewald Nowotny, meanwhile, said he would have “no problem” in raising the deposit rate from -0.4% to -0.2% as a means to normalise monetary policy.
In this macroeconomic context, the euro is reaching a key area in the range 1.2412 – 1.245. Should not exceed the level 1.2476, the pair could make a new bearish leg. In the long term, we still have our eyes on 1.26 as the end zone of the EUR / USD bullish cycle.
Manufacturing Production (YoY) falls, and pound closes slightly upward.
Manufacturing Production (YoY) fell to 2.5% in February well below the consensus that estimated an advance of 3.3%. The sector that was most affected was the construction sector with a decline of 1.6% in February. The National Statistics Office attributes to a large extent these low figures to the effect of severe weather.
On the technical side, we are observing a possible corrective process that could begin to be developed from area 1.42 – 1.425 with a potential level of invalidation in over 1.4345 coinciding with the highest level of the year.
BoJ – Kuroda keeps the promise of monetary policy.
The Governor of the Bank of Japan, Haruhiko Kuroda, reiterated his optimistic view on the expansion of Japan’s economy, affirming that “With the improvement of the product gap and the medium to long-term inflation expectations observed, we expect that inflation will accelerate as a trend and go to 2 percent. ”
On a technical level, on the one hand, the USD-JPY is still in a limited lateral range between 106.64 and 107.49, the predominant bias is bullish and increases its probability of strength as it closes above 108. The level The invalidation of the bullish sequence is 105.66.
On the other hand, by a positive correlation concerning USDJPY, we see in the Nikkei 225 Index within a long-term bearish pattern developing an ascending diagonal formation, which in case of exceeding 21,957 could lead to exceeding 22,500 pts.
Crude Oil climbs to the highest level since 2014.
First, it was the turn of the Brent oil; now it is the turn of the Crude oil that has climbed to the highest levels since 2014, reaching 67.36 US $ / Barrel, while the Brent oil climbed to new highs reaching $72.69.
For the Brent Oil, although the trend is bullish, the closest resistance is $72.91, while the level of invalidation of the bullish cycle is below $67.
As with the Brent Oil, the Crude Oil is in a free climb up to $ 70.7 as long as it remains above the $64 level.
On the opposite side, by inverse correlation, the Loonie remains in free fall with a target at the base of the bullish channel, the impact zone could be between 1.2456 to 1.235.


")


