Categories
Beginners Forex Education Forex Market

Forex Vs. Stock Trading: Which Carries More Risk and Why?

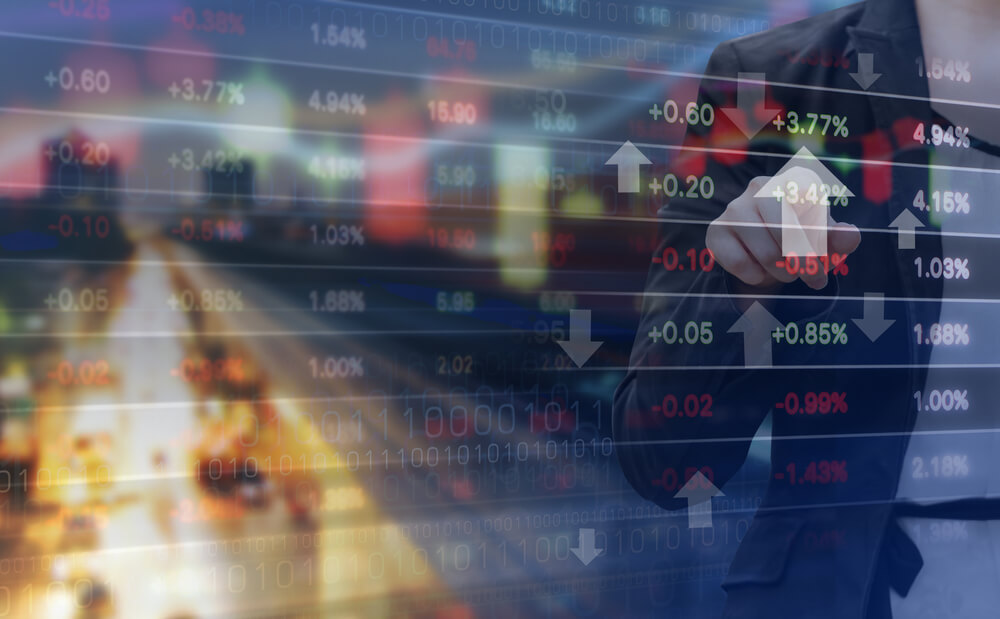
Is forex trading riskier than stock trading? And Why? To answer this question we must analyze what is the best market to trade, whether Forex or stocks, and that is what we will try to reveal in this article because a person who is just beginning in order to know the different markets you have to decide in which of them you will make your investment and two of the best options are precisely Forex or stocks.

Over time, money is losing value as a result of inflation and a large part of your capital may disappear if you don’t work. So what you should do is have your resources constantly work for you. In order to achieve this goal, one of the ways to achieve this is to become a trader, a race full of emotions that begins when you choose a market to start trading. In the following paragraphs, we will make a comparison between two giants of the modern economy: stocks vs Forex.
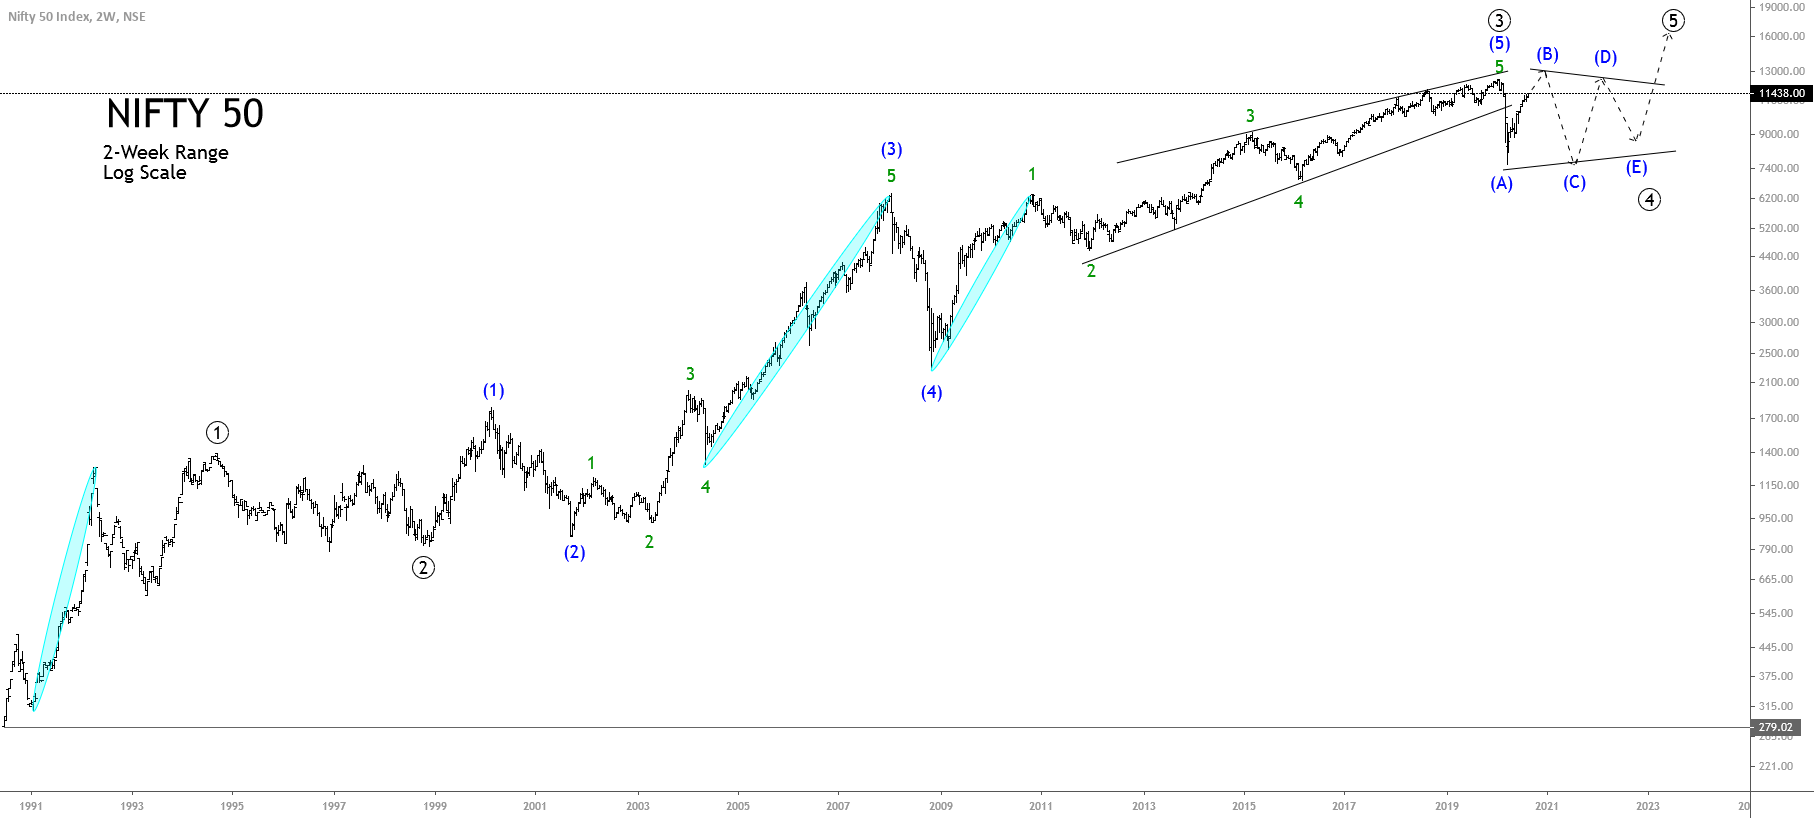
The Stock Market

Stocks are financial instruments that provide the ownership of a company. Depending on the number of stocks held, a person can become the owner of a business together with the other shareholders and is entitled to the profits (or losses) that are given. It should be mentioned that the percentage of the company controlled by the investor is equal to the number of its stocks. The higher the number of shares you have, the greater your participation will be and you will enjoy better profits.

Thousands of people and institutions gather in the stock market to negotiate securities that represent ownership of several companies listed on the market. The stock market has been the main asset exchange market since the time of the industrial revolution. But thanks to the arrival of new technologies and the expansion of the Internet, other markets have emerged that counterbalance traditional actions.

Credit: pacforex.com

The Forex Market

Forex, also known as the currency market, refers to the market where participants trade and exchange coins from any country. Currency is how money is officially issued by a nation’s central bank and serves as a means of exchange outside and within a given economy. There are people and companies that carry out transactions from different nations, therefore it is necessary a scenario in which it is possible to exchange these different currencies.

“We will analyze the most relevant aspects of Forex vs Stocks to determine which may be the best investment.”

Ease of Access

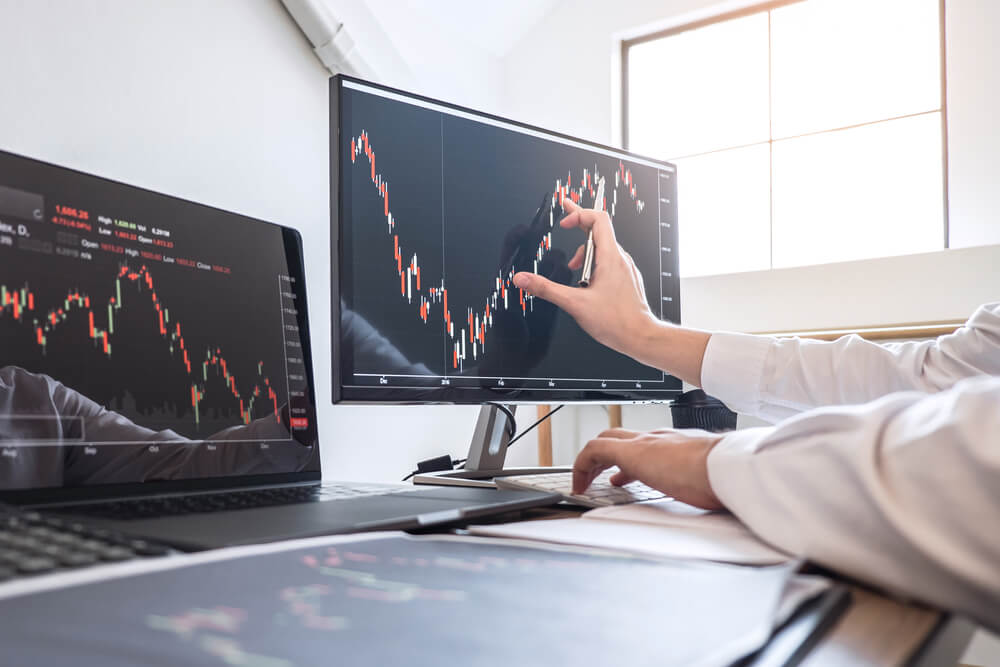
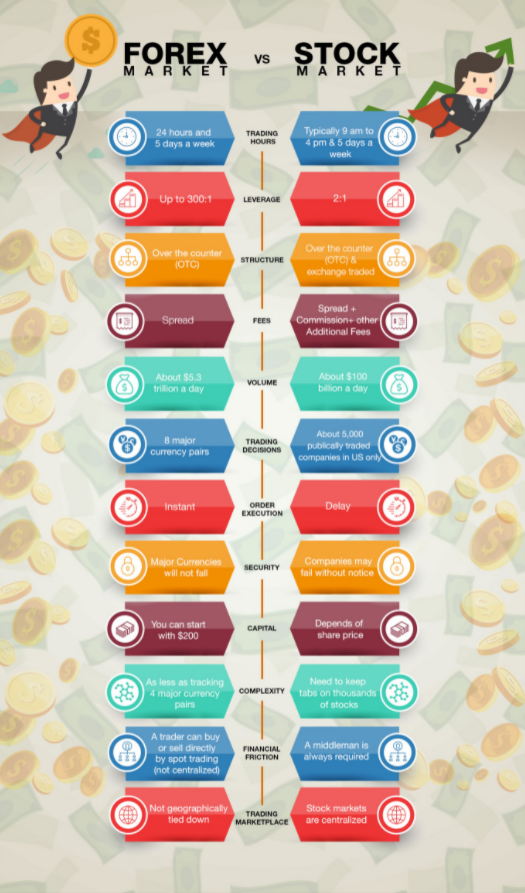
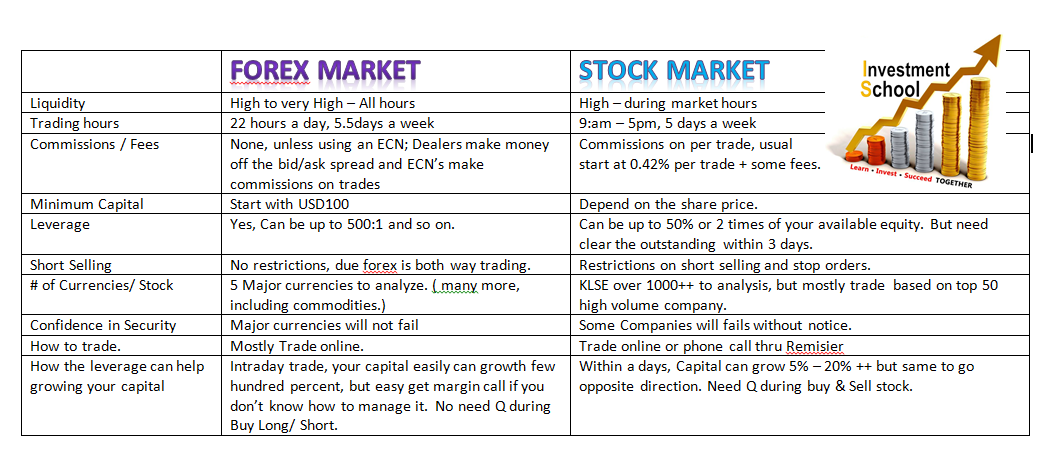
Forex trading, in contrast to the stock market, is not based on physical stock exchanges but is OTC (over the counter). This means that negotiations are conducted via the Internet and people can access them anytime and anywhere, which translates into superb accessibility.

We must know that today, the negotiations with stocks (and in general with any financial instrument) are conducted via the Internet. Anyone who wants to trade, whether with currencies or stocks, just select a broker, open an account and download the trading platform. In this respect, both the Forex and stock markets are easily accessible.

Credit: Investment School

Leverage

First of all, it should be borne in mind that, both in stocks and in the foreign exchange market, entry requirements are minimal and in some cases, it is possible to open accounts without making any deposits. An important element to consider is leverage, which can be accessed when negotiating. This leverage is like a loan that the broker makes to its clients to make a trade with more money than we have.

In the stock market, the usual leverage is 1:2 (you can borrow 2 dollars for every dollar you have of capital), while in Forex it can reach 500:1. There is no need to be too smart to choose the best option. The high margins offered by brokers give this point to the currency market. But…leverage can become a problem for some traders, especially for those starting out in this market. This tool allows you to multiply profits, but the same will happen with losses. So you need to use leverage with responsibility and knowledge.

Another aspect to compare between Forex and the stock market is the different trading costs. In Forex, commissions are usually lower due to the large number of brokers that exist. On the other hand, stock exchange brokers charge commissions, spreads, and other fees that can significantly increase commercial costs.

It may seem that these small costs do not have much incidence because they will mean a few cents, but as time goes by you will see how they add up and become a major expense. These small expenses can deplete a portion of your earnings. At this second point, the Forex market takes the lead with its higher leverage ratios and lower transaction costs.

Operating Hours

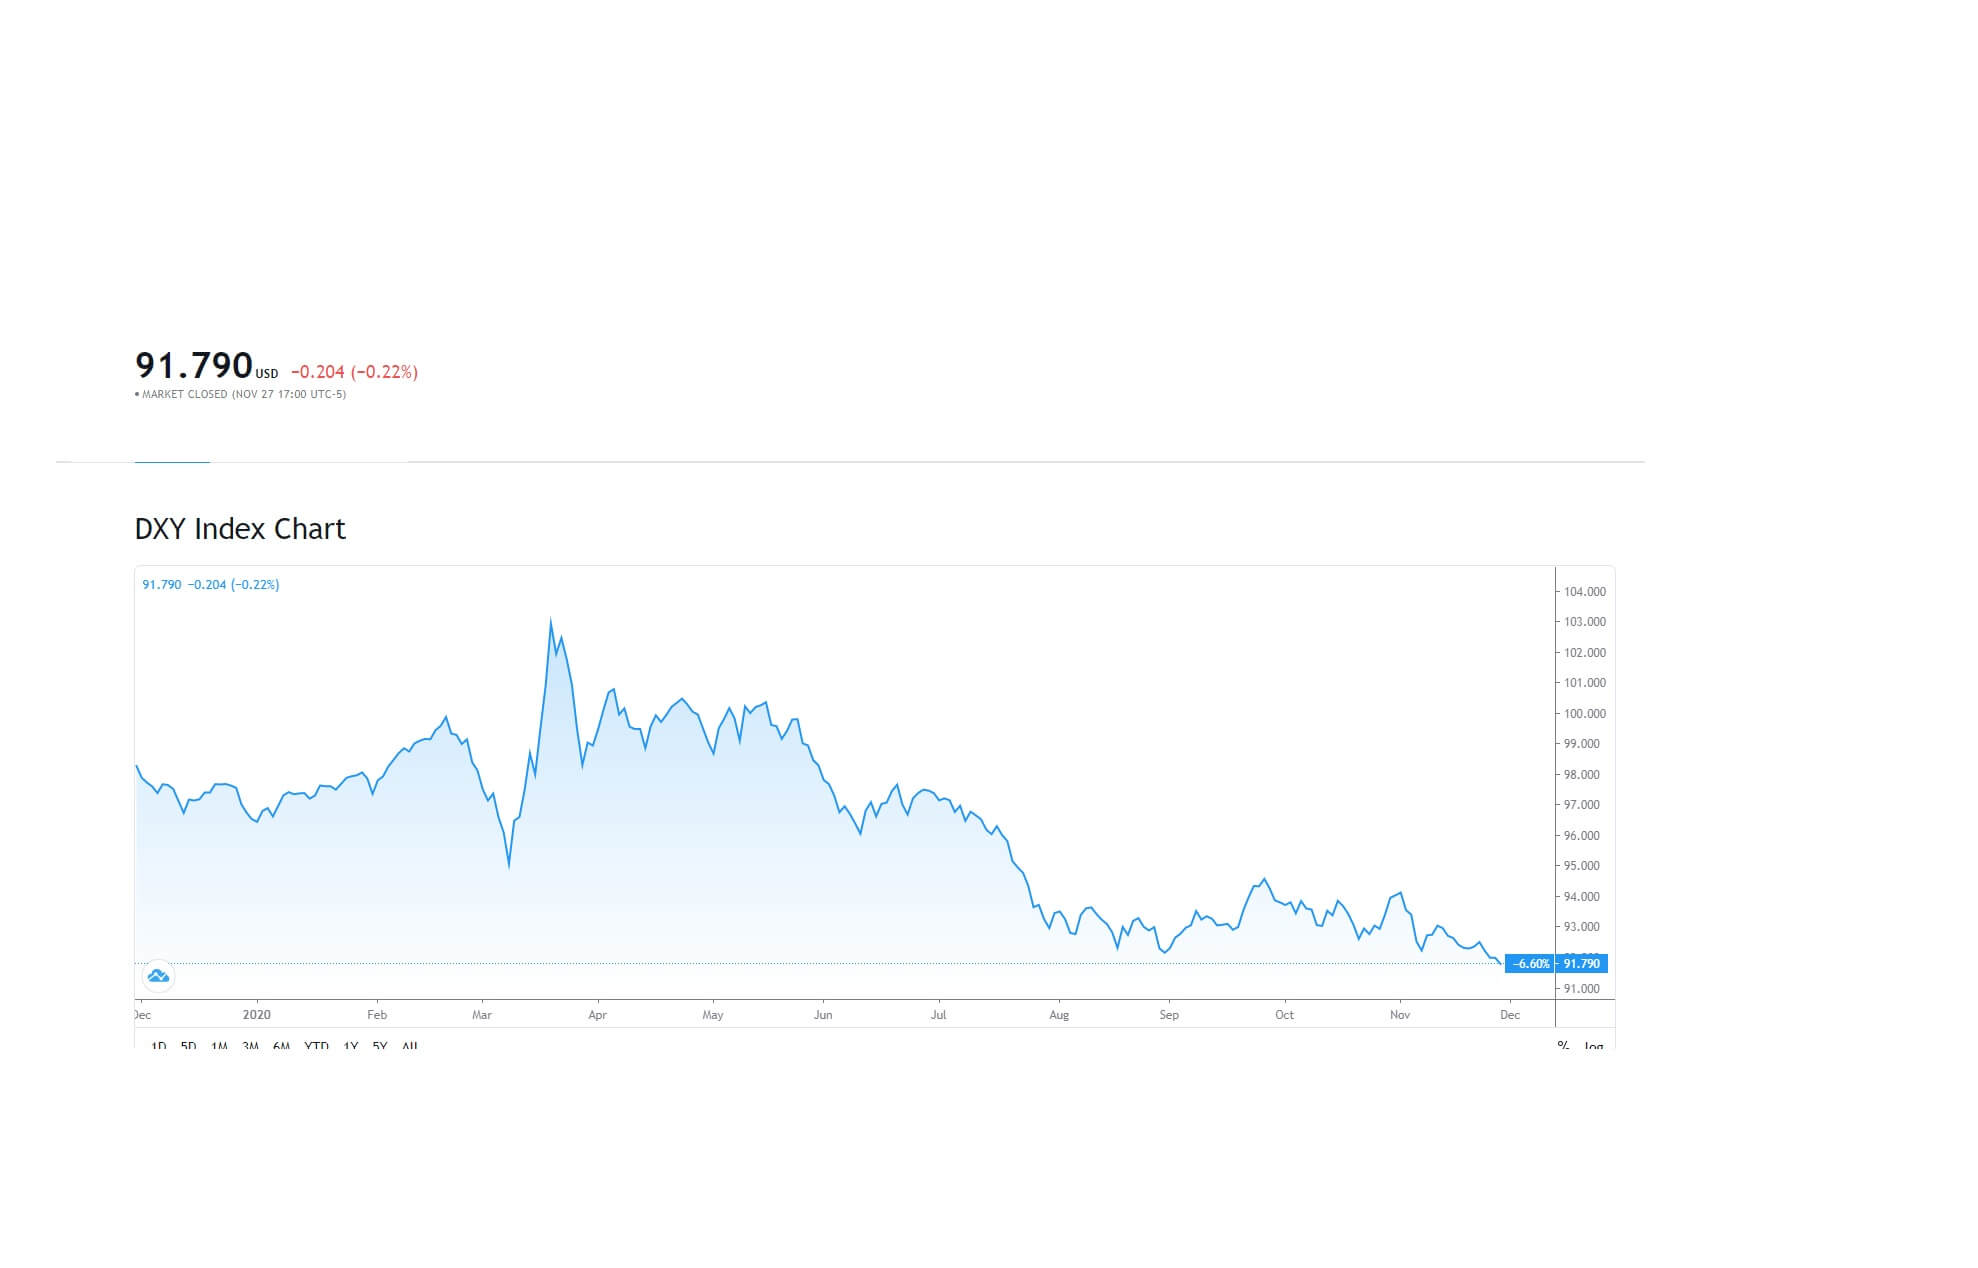
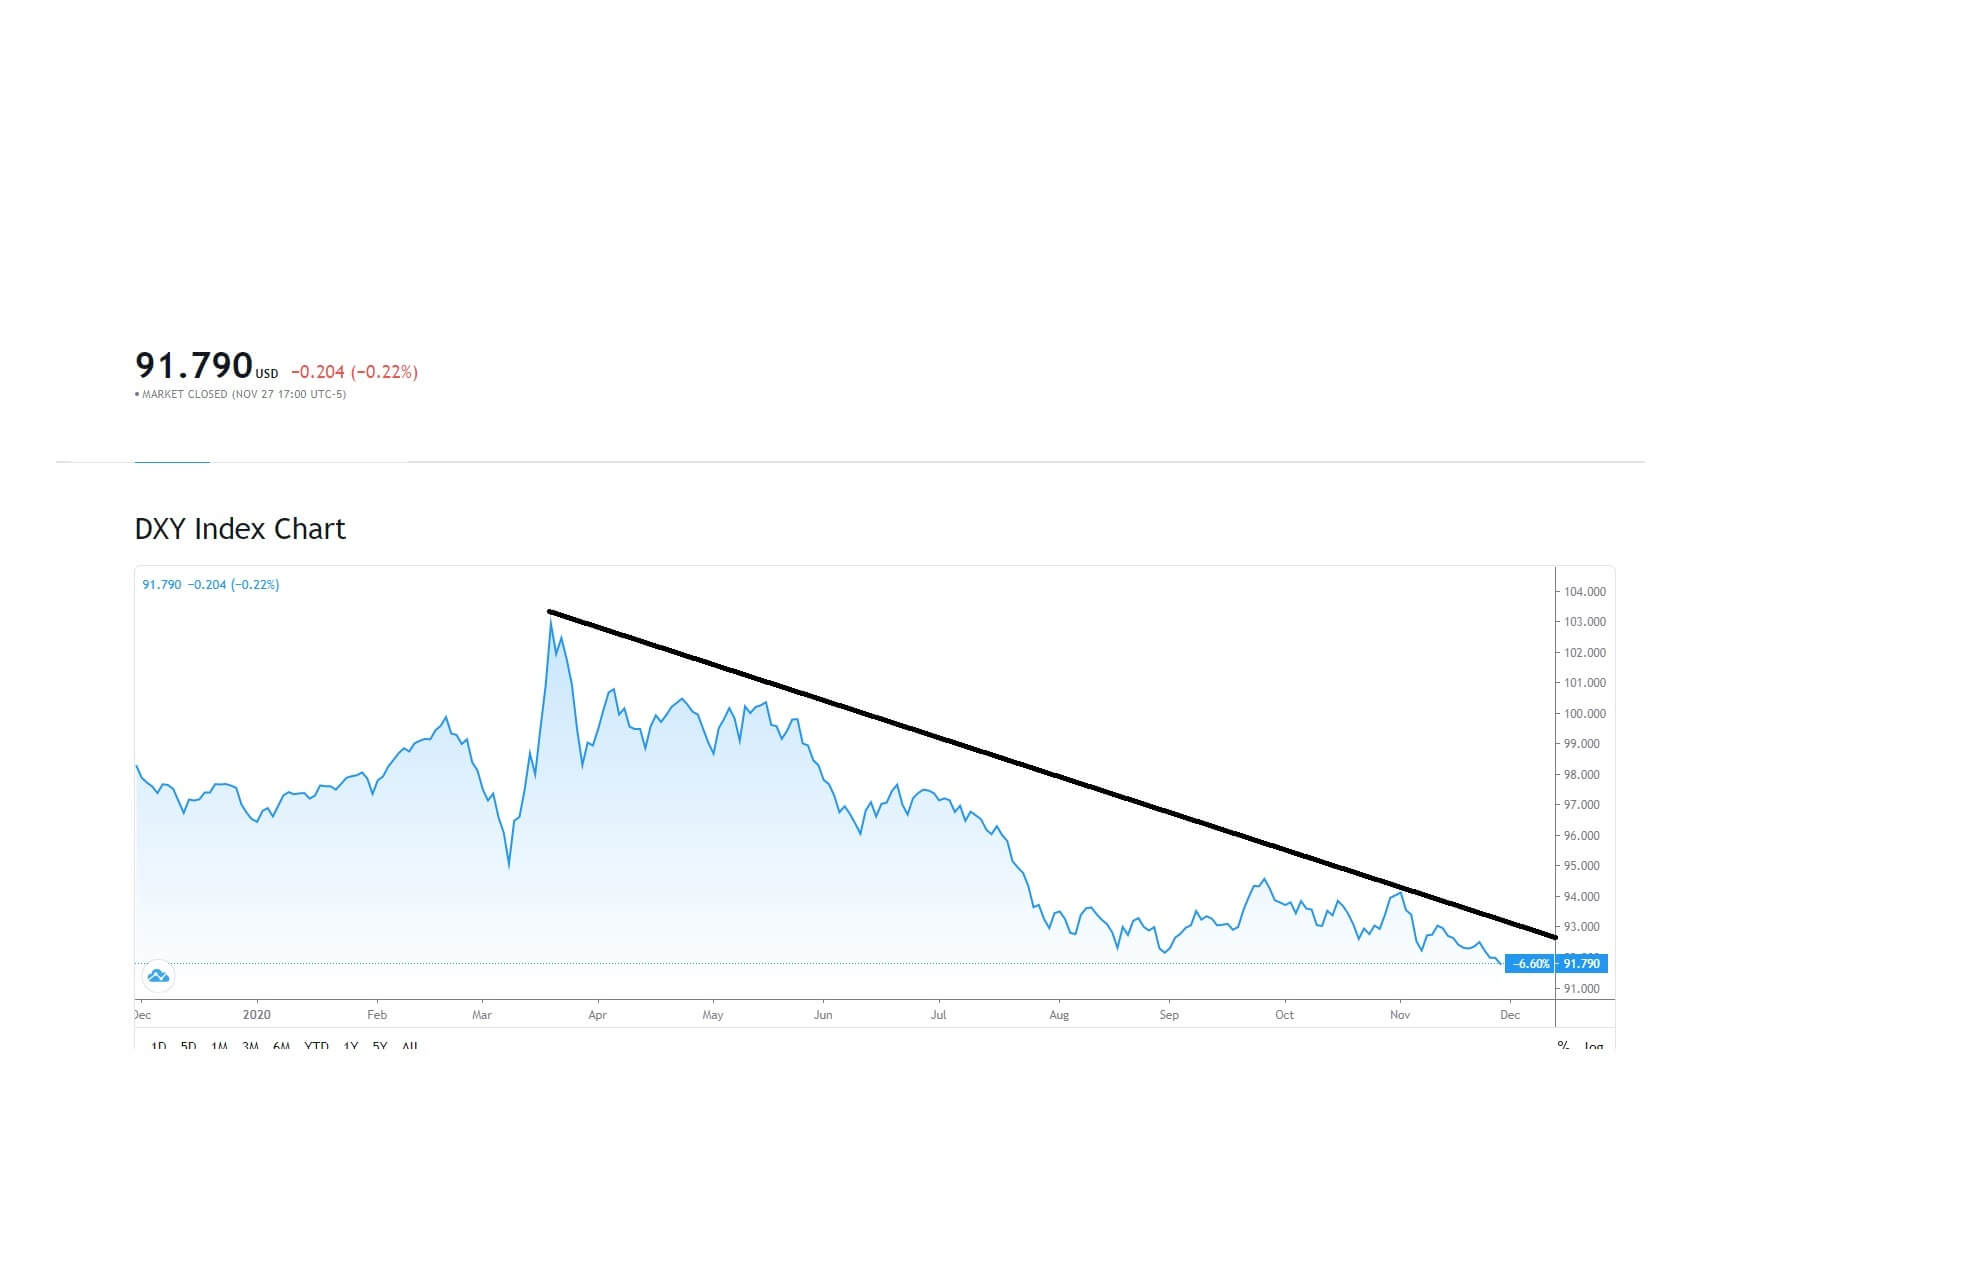
Probably the most obvious difference, when comparing Forex to stock trading, is trading schedules. The stock market is limited by timetables of exchanges worldwide. Forex is open 5 days a week and 24 hours a day. This Forex feature allows people to trade at any time, providing for investors who have traditional jobs. But, although the Forex market is widely accessible, there are hours with higher volumes and therefore better opportunities.

One of the features of Forex is that volatility and liquidity levels remain relatively constant over time, allowing traders to generate profits in the short term. However, that doesn’t mean that you should envy yourself to the market and spend all your time viewing the graphics. The market won’t go anywhere.

Another positive aspect of foreign exchange trading is that if you open a position and get important information that forces you to close the position, you can do it immediately without waiting for the opening of the stock exchange. When deciding between trading stocks or currencies, the advantage of Forex is obvious. Its great accessibility is a plus.

Diversity of Offers

One of the most diverse markets is the stock market. There you will find the stocks of hundreds of open capital companies belonging to a wide variety of sectors and industries. This may seem positive, but such diversity can become confusing and prevent a quick analysis of available options. Can you imagine having to analyze hundreds of stocks and then buy just one of them?

Looking at the Forex market versus the stock market, it is possible to show that with currencies the scenario is significantly different. In Forex, the most quoted instruments are the so-called major pairs (groups of currencies composed of the most important currencies) and the US dollar is part of the vast majority of transactions. A trader who is aware of the key factors affecting the dollar will have a good overview of the other currencies.

Similarly, most Forex brokers offer one more possibility: CFDs (difference contracts). These instruments allow transactions with different assets without actually having them. ¡ That means even on Forex you can trade stocks! And so, when comparing Forex vs stocks, it is the currency market that takes the lead once again thanks to CFDs.

In conclusion, thanks to its greater accessibility, vast amount of possibilities, and superior freedom, Forex manages to position itself as a better investment option than stocks. While it is true that Forex risk may be higher because of increased leverage, we have options to have good risk management and minimize them.

Categories
Forex Course

207. The Affects Of Stock Market On The Foreign Exchange Market

Introduction

The impact of the stock market on the flow of the forex market is quite significant. In fact, the foreign exchange market reflects the performance of the stock market. For instance, when the US stock market with Dow Jones, or NASDAQ, S&P 500 on the upward showing gains, the similar is likely to happen to the USD pairs in the foreign exchange market.

Rising Stock Market’s Impact

When the stock market is booming, investors from around the world will run to invest their money in the rising stocks of the nation as they are looking to obtain higher returns on the investment. With more investors demanding the currency, its value will increase significantly.

This is because if the investors want to put the money on, say, the US market, they have to convert their local currency into the US dollar. This significantly raises the demand for the dollar, hence makes the forex market perform better.

Falling Stock Market’s Impact

If the stock market is performing badly, the investors are likely to take their money out. This means that the investors will convert the currency back into the domestic ones or invest in some other country or asset. Subsequently, this will decrease the value of the concerned currency. This is something that all economies do in terms of investments.

Decision Making Based On Stock Market’s Performance 

Foreign exchange traders can leverage this information to assess the situation and predict the market. If you assess the stock of a particular currency and witness that they are moving up, then evaluate it against the currency, you will be able to make a prediction.

An increasing stock market will be influencing a boost in the value of the currency of the country. So you can base your trading decision on the same. At the same time, when the stock market is performing inadequately, you can sell the currency of that country. This is because the value of the currency will be falling in the market.

This correlation between the stock market and the foreign market can alter based on the global financial marketplace condition. The financial landscape is interconnected to different elements. Policies of central banks, political events, changes in the environment, everything affects how the trades are performed worldwide. The reason why stock influence forex is because stock includes companies that drive the economy of the country.

We hope you find this course article informative. Please let us know if you have any questions in the comments below. Cheers.

[wp_quiz id=”101824″]
Categories
Forex Course

206. The Correlation Between The Stock and Forex Markets

Introduction

The stock market encompasses individual stocks that create an index or a sector. An active under trader must define an approach to the equity as it differs depending on what she or he trades. When purchasing individual shares of an enterprise, some factors such as voting rights, dividend date, earnings per share, earnings releases, etc., play an important role.

The Relationship Between Forex and Stocks

The primary principles theory behind this is when there is an increase in the equity market rise. The demand for that particular currency also rises, resulting in more fund inflow from international investors. Additionally, it generates higher demand for the specific currency, leading it to rally instead of other foreign currencies.

On the other hand, when a local stock market does not perform well, this confidence lowers, resulting in investors to take their funds and put them somewhere safer and more lucrative.

Currency Correlation

Correlation is referred to as the measurement of the degree to which prices of two things have moved in a similar direction at the same time. For instance, if A and B prices always move up and down in sync, they have a correlation coefficient of 1, which implies an ideal positive correlation.

Contrarily if the value of these things moves simultaneously in the opposite direction, then their correlation coefficient is -1, which signifies a negative correlation.

Example – Correlation between Stock & Forex Markets

If the USA stock market performs well, international investors will sell their local currency to purchase USD-denominated stocks. When the demand for the dollar rises, it experiences an increase in value. In the Foreign exchange market, USD pairs will move in favor of the dollar ( i.e., The EURUSD falling, the USDCAD rising); hence a strong US stock market will favor the value of the US Dollar.

On the other hand, if the USA’s stock market is not performing well, investors will sell their USD-denominated shares and buy stocks or ETFs in places where they can generate more yield. This shows that the economy in the USA is performing badly. Since the demand for the dollar is less, it adversely affects the value of the US dollar.

Possibility Of Negative Correlation

There is also a possibility that the currency market will rise in answer to a volatile stock market. This may happen due to tons of other factors that contribute to currency performance. We will discuss more related to this topic in the upcoming course lessons.

Don’t forget to take the quiz below before you go. Cheers.

[wp_quiz id=”100352″]
Categories
Forex Videos

Forex Forecast – Will We See A Rising Dollar As The Stock Markets Crash?


Where next for the US Dollar? 

Thank you for joining this Forex Academy Educational video

The US dollar is the most widely traded currency on the planet.  In terms of volume, the biggest currencies traded against it are the Euro, Japanese Yen, the British pound, Swiss franc, the Australian and New Zealand dollar, and Canadian dollar. 

The dollar is measured as a weighted value against these other currencies and is referred to as the dollar index or DXY. Here we can see that at the time of writing, the value is 91.79, a two-year low.

As we can see here, the dollar has been broadly declining against this basket of currencies since March 2020, when the index hit a high of 103.00, just before the pandemic began to take a grip in the United States.  And with the pandemic still gripping the United States, where just last week 1 million new cases were recorded, could the DXY continue its demise, perhaps down to the 2008 crash level of 72.00? Certainly, some analysts are predicting a slide into the high 80.00’s?

With winter knocking on the door in the United States and pressure mounting on hospitals, the nation’s economy, which has been showing signs of a recovery, albeit at the expense of a lockdown, where President Trump favours the economy over individual’s health, and which might prove a sticking point with the second wave resurgence in motion and a new president in the waiting.

And with US stocks at record highs and with the Dow Jones industrial 30 index somewhat inflated around the 30,000 level, could a short sharp reality check be on the way for the American economy, where the unemployment rate has started to rise in recent weeks? 

If you believe the answer is yes, then us stocks should fall, and in which case we might see the dollar being bought as a safe-haven currency and possibly a rally to the mid 90.00’s.

Another key factor is a failure to pass the new US stimulus bill, which might cause the federal reserve to become more proactive and take an aggressive stance on quantitative easing, which would be negative for the US dollar.  This is unlikely to happen until the January inauguration of the president-elect Joe Biden.

 Another contentious issue which will affect the dollar is the continuation of the Brexit future trade agreement talks with the European Union, which are dragging on but must be concluded shortly if there is to be enough time to implement a new tariff-free trade deal which both parties want, but which seems to be unobtainable because of the lack of agreement on issues such as fisheries and a so-called level playing field, where the EU is concerned that the UK will use its new free trading status to undercut it for trade deals as it goes out to sign up new ones around the world.

 And therefore, any dollar related trading should be done with extreme caution as these issues unfold and where recent swings in pairs such as the GBPUSD, sitting at 1.3315 and EURUSD at 1.1965 at the time of writing, could see significant moves in either direction based on the above metrics. Caution is advised.


Categories
Forex Market Analysis

Russell 2000 in Consolidation, Expecting for More Upsides

Overview

The Russell 2000 Index raised over 64% off its lowest level of the year, advancing from the extreme bearish to the extreme bullish sentiment zone. The incomplete complex corrective structure, still in progress, calls for more upsides in the coming trading sessions.

Market Sentiment Overview

This year, the Russell 2000 index is underperforming by 6.24% (YTD); however, it continues its recovery from the first quarter massive sell-off, when the U.S. index plummeted until its lowest level of the year at 953.77 pts, currently advancing 64.38% off its lows. 

The Russell 2000’s daily chart shows it’s moving inside the 52-week high-low range, exposing the development of a consolidation formation in the extreme bullish sentiment zone. Simultaneously, the 71-point reading observed in the fear and greed index reveals a bullish bias, helping support the upward bias that now prevails on the Russell 2000 Index. 

On the other hand, Russell 2000’s volatility index shows it’s moving in the extreme bearish sentiment zone, which increases the bullish perspective for the U.S index grouping the 2,000 small-cap U.S. companies.

Consequently, both the market structure consolidating in the extreme bullish sentiment zone and the decreasing volatility observed, lead us to expect further upsides for the following trading sessions, which could make it advance till its opening level of the year, at 1,672 pts.

Elliott Wave Outlook

The short-term overview under the Elliott wave perspective is shown in its 4-hour chart, which reveals the structure of a bullish sequence that remains intact since March 23rd when Russell 2000 found fresh buyers at 963.62 pts.

In the previous chart, we distinguish Russell 2000’s upward progression, moving in a complex corrective formation identified as a double three pattern (3-3-3) of Minute degree, marked in black, which belongs to a wave B of Minor degree labeled in green. 

The complexity level in the corrective sequence could be understood under the alternation principle context. Observing the first chart and considering the aggressive sell-off, lasting about in one month (since mid-February till mid-March), the alternation principle states that after a high-momentum level movement, a reduced-momentum move comes next, and vice versa.

Currently, Russell 2000 advances in wave (c) of Minuette degree, which began on July 10th when the U.S. index ended the wave e of the triangle pattern corresponding to wave (b) in blue. Once wave (b) was completed, the market participants pushed prices higher, carrying it till the 1,608 level on August 11th after the Russell 2000 Index found stiff resistance, which ended wave iii of Subminuette degree identified in green.

Consequently, we expect a limited sideways movement during the following trading sessions before continuing its advance toward fresh highs. Russell’s next upward movement could boost it to the 1,702.17 level, to test last February’s highs.

Categories
Forex Market Analysis

NIFTY 50 Rallies with Extreme Bullish Sentiment

Overview

The Indian benchmark NIFTY50 index that groups the 50 largest capitalized companies of the Indian stock market loses over 6.6% during 2020. However, since March’s low at 7,511.10 pts, NIFTY 50 recovers over 51% and could visit the 12,000 pts in the following trading sessions.

Market Sentiment Overview

The Indian stock market led by the NIFTY 50 index underperforms 6.69% (YTD), recovering its losses from the massive sell-off starting last February, which dragged it to lose over 38% mid-March when the price found support at 7,511.10 pts. Once the Indian index found support, the price began to recover from its declines advancing over 51% to date.

The following chart exposes to NIFTY 50 in its daily timeframe moving above the 11,200.65 pts corresponding to the zone of extreme bullish sentiment. At the same time, from the figure, we distinguish the Indian benchmark moving above the 200-day and 60-day moving average, confirming us the bullish bias of NIFTY 50.

Considering that the extreme bullish sentiment prevails in the NIFTY 50 index, the price could advance toward the 12,000 pts as a psychological barrier, which coincides with a previous consolidation zone.

Elliott Wave Outlook

The big picture of NIFTY 50 under the Elliott wave perspective unveiled in the 2-week chart and log scale, exposes the advance of the Indian stock market in the fourth wave of Primary degree labeled in black. Once the price reached its all-time high at 12,430.50 pts in January 2020, completing its wave ((3)) of Primary degree began.

From the chart, we observe some extended waves developed by NIFTY 50 in each impulsive movement identified with ellipses. In the first wave of Primary degree, in its internal structure, the third wave corresponds to the extended wave. While in the third wave of Primary degree, watching inside of the fifth wave of Minor degree labeled in green, which belongs to the third wave of Intermediate degree in blue, corresponds to the extended wave. 

Finally, in the fifth wave of Intermediate degree, we recognize the first wave of Minor degree as the extended wave. In this context, the fifth wave of Intermediate degree could be confused with an ending diagonal pattern. Although the ending diagonal pattern tends to appear in a fifth wave or wave c, this case does not correspond to an ending diagonal pattern.

On the other hand, considering the previous corrective formations that look like a three-wave structural sequence, the current fourth wave of Primary degree could be a complex formation as a triangle pattern, which holds a 3-3-3-3-3 series. Under this scenario, our short-term outlook for the Indian benchmark foresees the bullish continuation, which could surpass the last all-time high at 12,430.50 pts. 

Once the price completes its wave (B) of Intermediate degree in blue, the Indian stock market could develop a sideways movement forming a potential triangle pattern. Once the corrective formation in progress ended, NIFTY 50 could resume its advances developing a wave ((5)) in black, which could see fresh all-time highs.


Categories
Forex Course

23. A Brief Comparison Between The Stock Market & The Forex Market

Introduction

The Stock market and the Forex market are the most widely traded markets in the world. Many traders who enter the universe of trading are often in a dilemma on which market to trade on. Though both markets involve trading instruments, there are many differences between these two. In this lesson, we shall get insights on the different features of both markets and then come to a conclusion on which is the market has got the upper hand.

Market timings

The forex market is open for 24/5. This proves to be a considerable advantage, as traders can trade anytime during the trading hours according to their schedule. While this is not the case with the stock market because they’re open only for 7-9 hours in a day. So, the stock market timings can be helpful only to full-time traders.

Facility to buy and sell short

As already discussed in the previous lesson, there is no directional bias in the forex market. The process and working for buying and selling is the same. Hence, a trader can participate during any condition of the market.  In the case of the stock market, there are few restrictions on short selling a stock. Though the facility for short selling is available, the procedure is not as simple as buying a stock.

Leverage/Margin

Leverage is the facility provided by the brokers to take larger positions with smaller capital. Leverage is one of the reasons why small retail traders take part in the market. Now, comparing the leverage in the stock market with the forex market, the difference is quite significant. In the stock market, maximum leverage for a day trader is up to 4:1 and for a positional trader, it is up to 2:1. Coming to the forex market, the leverage is commonly around 100:1. In fact, in some brokerages, it goes up to 500:1 as well. However, it cannot be concluded that it is better to choose the forex market over the stock market. This is because, as the leverage increases, the risk involved in the trade also increases.

Dividends

Dividends are basically perks given by companies if an investor invests in their company. Investing in a stock that provides dividends to their customers can be considered as a risk-free business. This is because, even if the stock underperforms in the market, you are usually assured of dividend income. But, in the forex market, there is no concept of dividends as such. Hence, this market is for the ones who are willing to take the risk.

Diversification

Many traders look for diversifying their portfolio. In the US stock market, there are around 2,800 stocks listed on the NYSE and 3,100 on the NASDAQ. And these stocks are put into different sectors. The sectors have their specific features and perform differently from other sectors. Hence, the stock market is an ideal market for the ones looking to diversify their investments.

Conclusion

In considerations of the above features of the stock market and the forex market, it is quite hard to stay biased. In the initial features, the forex market proves to be a better market, and when it comes to dividends and diversification, the stock market is the clear winner. Hence, from this, we can conclude, ‘the best market’ is a variable factor. It all depends on the type of trader a person is.

[wp_quiz id=”49036″]